Vignoles, Jean-Marc Leyssale
PII: S0008-6223(17)30454-2 DOI: 10.1016/j.carbon.2017.05.009 Reference: CARBON 11996
To appear in: Carbon
Received Date: 9 March 2017 Revised Date: 28 April 2017 Accepted Date: 4 May 2017
Please cite this article as: B. Farbos, H. Freeman, T. Hardcastle, J.-P. Da Costa, R. Brydson, A.J. Scott, P. Weisbecker, C. Germain, Gé.L. Vignoles, J.-M. Leyssale, A time-dependent atomistic reconstruction of severe irradiation damage and associated property changes in nuclear graphite, Carbon (2017), doi: 10.1016/j.carbon.2017.05.009.
M
AN
US
CR
IP
T
AC
CE
M
AN
US
CR
IP
T
AC
CE
PT
ED
A time-dependent atomistic reconstruction of severe
irradiation damage and associated property changes in
nuclear graphite
Baptiste Farbosa,b, Helen Freemanc, Trevor Hardcastlec, Jean-Pierre Da Costab, Rik Brydsonc, Andrew J. Scottc, Patrick Weisbeckera, Christian
Germainb, G´erard L. Vignolesa, Jean-Marc Leyssalea,d,∗
aLaboratoire des Composites ThermoStructuraux, Universit´e de Bordeaux - CNRS - CEA
- Safran Ceramics, 33600 Pessac, France
bUniversit´e de Bordeaux, IMS UMR 5218, F-33400 Talence, France cInstitute for Materials Research, School of Chemical and Process Engineering,
Univiversity of Leeds, Leeds LS2 9JT, UK
dMultiScale Material Science for Energy and Environment, Massachusetts Institute of
Technology - CNRS, 02139 Cambridge MA, USA
Abstract
Detailed knowledge regarding the nature of and mechanisms causing neutron
irradiation damage in graphite remains a scientific and technological
chal-lenge, particularly at high irradiation doses. Using electrons as a surrogate
for neutron irradiation, we develop a time-dependent atomistic
reconstruc-tion strategy fed by a time series of high-resolureconstruc-tion transmission electron
microscopy (HRTEM) images, to monitor damage propagation in a graphite
grain up to a dose of about one displacement per atom (i.e. well beyond
the conventional irradiation simulations based on molecular dynamics). The
reduction in crystalline order and the development of interlayer bonding
ob-served in the models with increasing irradiation time induce significant
mod-∗Corresponding author
M
AN
US
CR
IP
T
AC
CE
PT
ED
ifications of the elastic constants and thermal conductivity. Homogenizing
these properties to the case of isotropic polycrystalline graphite we are able
to reproduce the increase in Young’s modulus and decrease in thermal
con-ductivity observed experimentally for reactor graphites with increasing dose.
Further validation of the models is provided via a comparison of simulated
and experimental data from irradiated material such as: HRTEM images,
carbon K-edge electron energy loss spectra, dose rate and stored energies.
1. Introduction
Controlled nuclear fission has always been intimately linked to graphite,
from the first nuclear piles in the 1940s, through the first civil nuclear reactor,
Calder Hall, which opened in 1956, and subsequent second and third
gener-ation reactors (Magnox and Advanced Gas-Cooled Reactors (AGR), to the
next generation (GenIV) very high temperature reactors (VHTR). In most
designs, graphite serves not only as a neutron moderator but also as a key
structural component, providing the mechanical integrity of the core, and
acting as a thermal management system. As an example of the importance
of graphite in the field, over 90 % of the current nuclear reactors in the UK
are based on a graphite core. Knowledge of radiation damage and its effects
on properties in nuclear graphite is thus particularly important at a time
where society has to make important choices related to the extension or
de-commissioning of existing, older nuclear reactors, as well as the development
of new high temperature reactors.
Neutron radiation produces atomic displacement cascades in graphite,
M
AN
US
CR
IP
T
AC
CE
PT
ED
the a-axis and swelling along the c-axis [2, 3] also observed upon electron
ir-radiation [4]. Even though graphite core reactors usually operate at high
temperature (≈400◦C), it is often more convenient to study radiation effects
at room temperature to avoid thermal annealing of the produced damage.
From the point of view of physical properties, increases in Young’s modulus
(E) by factors of two [5] to four [6], due to an increase in C44 in graphite
grains [7], as well as decreases in thermal conductivity (κ) by approximately
an order of magnitude [8] have been reported for nuclear graphites upon
neutron irradiation at room temperature.
Using DFT calculations, Heggieet al. have ascribed dimensional changes
to the buckling of graphene layers induced by interlayer defects (spiro-interstitials)
[9, 10] in addition to the growth of vacancy lines and interstitial prismatic
loops as previously hypothesized [11, 12]. Direct molecular dynamics (MD)
simulations of the impact of energetic particles on graphite [13–17] tend to
confirm the formation of pinned interstitial atoms. However, these theoretical
and simulation studies are limited to primary damage, in which only a small
fraction of the atoms are displaced (10−2 in Ref. 17), in contrast to doses of
20-30 displacements per atom (dpa) experienced by nuclear graphite
compo-nents. Constructing structural models of graphite at higher irradiation doses
and rationalizing them with the experimental observations of pronounced
changes in physical properties is therefore a key issue for the development of
new reactors, the assessment of the optimal life time of actual plants or the
decommissioning of older ones.
Reconstructive atomistic modeling methods have proven to be
M
AN
US
CR
IP
T
AC
CE
PT
ED
carbonaceous materials [18–21]. In particular, the image guided atomistic
reconstruction (IGAR) method, using high resolution transmission electron
microscopy (HRTEM) images as input data, has allowed the construction of
atomistic representations of highly anisotropic pyrolytic carbons
reproduc-ing with great accuracy both experimental textural (HRTEM images) and
structural (pair distribution functions) data [21, 22].
Building up on former experimental work [4, 23, 24] showing that electron
and neutron irradiation damage can be compared, we present in this work a
time-dependent IGAR method to model the propagation of radiation damage
in graphite using as experimental input a series of HRTEM images taken
during in situ electron irradiation of graphite. Irradiation induced changes
in physical properties are then discussed based on the proposed models.
2. Materials and methods
2.1. Transmission electron microscopy
TEM samples of Pile Grade A (PGA) graphite were prepared by
grind-ing/crushing. Flakes were mixed with acetone and dispersed onto 3 mm
copper TEM grids coated with holey amorphous carbon support film; the
ar-eas examined were <50 nm thick. In situ TEM studies were performed in a
Philips CM200 field emission TEM operated at 200 kV with a tip extraction
bias of 3.21 kV and equipped with a GIF200 EELS spectrometer. We
oper-ated at Scherzer defocus c.a. -698 ˚A and data were collected periodically
(every 1 min.) during room temperature electron beam exposure over several
regions within the specimen. The localized heating effect from the electron
M
AN
US
CR
IP
T
AC
CE
PT
ED
graphite. The total duration of the exposure was of 13 minutes, which
cor-responds to a total estimated dose of around 1 dpa (see below). Considering
that actual reactor dose rates are on the order of 1 dpa per 15 months of
operation at full power and that significant annealing occurs under operation
temperatures, the damage level corresponding to 1 dpa of room temperature
electron irradiation should be equivalent to the one obtained in a reactor core
after a few years of its lifetime.
2.2. Time-dependent image guided atomistic reconstruction
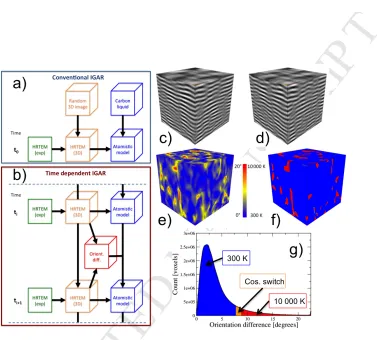
The principles of the IGAR method, introduced in Ref. 25 and further
developed in recent years [21, 22], are schematized in Fig. 1(a). It starts
with the production of a 3D HRTEM image block, from an initial random
distribution of grey levels, using a multi-resolution pyramidal image synthesis
technique trained to reproduce image statistics collected on 2D images and
extended to 3D by considering the equivalence of spatial statistics by rotation
around thecaxis. In a second step, this 3D analogue of the 2D experimental
HRTEM image is used as an external potential in a liquid quench MD
sim-ulation to guide atoms towards regions inferred from HRTEM fringes to be
high atomic density. At the end of the quench, the resulting atomistic model
is both chemically sound, thanks to the used interatomic potential, and
car-ries the nanotexture of the actual material, thanks to the HRTEM template.
This method has proven successful in the elucidation of the nanostructure of
highly textured laminar pyrocarbons [21].
We present in Fig. 1(b) a modification of this method, the time-dependent
IGAR method (TD-IGAR), specifically developed in this work to model
M
AN
US
CR
IP
T
AC
CE
[image:8.612.131.508.134.474.2]PT
ED
Figure 1: Schematic description of (a) the conventional IGAR method and (b) the
time-dependent IGAR method. (c,d) 3D HRTEM image analogues at (c) 4 and (d) 5 minutes
of irradiation. (e) Image of the orientation difference (OD) between the 3D images at 4
and 5 min. (f) Initial temperature image for the reconstruction of the atomistic model
at 5 min of irradiation. (g) histogram of the OD image (e) showing the three regimes
of initial temperatures (in the orange domain a cosine function is used to progressively
M
AN
US
CR
IP
T
AC
CE
PT
ED
of HRTEM images. The starting points here are a pre-existing 3D HRTEM
image block and an atomistic model of the system at a given time ti (for
in-stance produced by a conventional IGAR simulation). Then, a 3D HRTEM
image at time ti+1 is obtained by modifying the 3D HRTEM image at time
ti in order to match the statistics derived from the experimental 2D image at
time ti+1. The pyramidal 3D synthesis, being based on a local optimization
scheme, ensures that the produced block at ti+1 is a minimal perturbation
from the block at time ti (see examples of two such blocks corresponding to
4 and 5 min of electron irradiation in Fig. 1(c) and Fig. 1(d), respectively).
Similarly, the 3D atomistic model at time ti+1 is obtained by modifying the
atomistic model at time ti, however, special care need to be taken such that
only damaged areas get altered, or in other words, areas in which the 3D
im-age block has significantly changed between time ti and time ti+1. In order
to do identify such areas, an orientation difference (OD) image (Fig. 1(e))
is produced from the angular difference between the normal to the grey-level
iso-surface at a given location at times i and i+ 1. The normal vector is
estimated on every voxel of the 3D HRTEM image using the structure tensor
technique [26]. This 3D OD image is converted (see Fig. 1(g)) into a 3D
temperature image block (Fig. 1(f)): 10,000 K and 300 K for OD larger
and lower than some upper and lower thresholds respectively, with a cosine
switch in between. This temperature image block then serves to define the
space-dependent initial temperature for a rapid MD quench run. The latter
starts with the atomistic model at timetiand is biased by the HRTEM image
at time ti+1. The result from this run is the atomistic model at time ti+1 in
M
AN
US
CR
IP
T
AC
CE
PT
ED
OD values.
2.3. Evaluation of elastic properties and thermal conductivities
Elastic constants (and compliances) at room temperature and finite strains
are obtained using relaxed tensile simulations, constrained tensile simulations
and shear simulations under Lees-Edwards [27] boundary conditions as
de-scribed in Ref. 28. Engineering strain rates are set to 0.4 and 1 ns−1 for
ten-sile tests and shear tests, respectively. Phonon contributions (in the classical
limit) to the thermal conductivities are computed using the velocity-swapping
NEMD scheme of M¨uller-Plathe [29]. In these simulations, the systems are
replicated three times along the test direction to limit the magnitude of the
temperature gradients. One velocity swapping event was performed every
12.5 fs and 50 fs for simulations along a and c directions, respectively. This
leads to gradients of the order of 3-5 (a) K/nm and 20-25 K/nm (c).
2.4. Computational details
Molecular dynamics simulations are performed on periodic cubic cells of
5.025 nm width filled with 14009 carbon atoms (i.e. at a fixed density of
2.2 g.cm−3). Interatomic interactions are accounted for by the second
gen-eration reactive empirical bond order potential (REBO) [30], which provides
a reasonable description of defect energies in graphite [31, 32] and has been
recently used to investigate primary damage in graphite [17] and the
struc-ture/property relationships of many graphite-based materials [18, 19, 28].
Van der Waals interactions between non-bonded carbon atoms, not included
in the IGAR quenches, are introduced in order to relax the systems after
M
AN
US
CR
IP
T
AC
CE
PT
ED
using a Lennard-Jones potential introduced in an adaptive way based on both
distance and bond order criteria [33]. Equations of motion are integrated
with a velocity-Verlet integrator with time steps of 0.25 fs for simulations
involving high temperatures (IGAR and TD-IGAR reconstructions) and 0.5
fs for simulations performed at room temperature (relaxations and property
evaluations). The stochastic Andersen thermostat [34] is used to fix the
tem-perature in most simulations. The only exception is the non-equilibrium MD
(NEMD) simulations to evaluate thermal conductivities, for which a
Berend-sen thermostat [35] is used. In this particular case the thermostat only aims
at avoiding energy drifts on long timescale runs. The time constant of the
thermostat was thus set to a large value (0.5 ps) in order to have little effect
on the obtained temperature gradient, which was checked against shorter
Newtonian runs. In some simulations (constant pressure relaxations and
re-laxed tensile tests), all or some diagonal elements of the stress tensor are
fixed to atmospheric pressure using an anisotropic Berendsen barostat [35].
The 3D HRTEM image blocks used as external potentials in the
(TD-)IGAR reconstructions have a 9.81 pm/pixel resolution and were synthesized
from data collected on experimental images at least 25 nm and 10 nm width
along the a and c directions, respectively. The proportionality relationship
between energy and grey level is as in former work [21]: from 0 eV (black) to
4 eV (white). This correspondence between dark contrasts and high atomic
density was verified using HRTEM simulation for atomistic models as wide
as 12.5 nm [21].
The initial atomistic model in the TD-IGAR process is built from the
M
AN
US
CR
IP
T
AC
CE
PT
ED
could not be accurately described by the 5 nm width models used in this
work) using almost the same simulation parameters as those given in Ref.
21. The only difference is that the minimum quench rate is reduced by a
factor of 2, down to 0.25 K/ps, at temperatures between 5,200 and 4,000 K.
In the TD-IGAR approach, the initial temperature Tinit for the quench
process is non-uniform in space; it depends on the difference in orientation
(OD) at a given location between the actual 3D HRTEM-like image block
and the one at the former step. Based on tests of the effects of simulation
parameters on the reproduction of HRTEM features we adopted the following
choice of parameters: Tinit was set to 300 K and 10,000 K at respectively low
and high OD with a cosine switch in between (see Fig. 1(g)). The threshold
OD values for low and highTinitwere chosen so that they belonged to the tail
of the OD histogram, whose precise location showed some slight difference
from one system (i.e. one time) to another. On average we used Tinit = 300
K forOD <7.5◦ and Tinit= 10,000 K forOD >8.5◦ (note that this choice is
not that sensitive as, owing to the very rapid quench rate, structural changes
will only occur where strong alterations of the 3D HRTEM image blocks have
taken place, in other words, far into the tail of the OD histogram). As in
former work, the IGAR and TD-IGAR runs are performed without the van
der Waals potential to save computational time. The latter is introduced in a
second step to relax the system before property calculations are undertaken.
2.5. HRTEM simulation
HRTEM images were simulated from the atomistic models using the
mul-tislice image simulation technique implemented in the NCEMSS package [36].
M
AN
US
CR
IP
T
AC
CE
PT
ED
images were simulated for each atomistic model, with the electron beam
aligned with the two equivalent directions (a and b axes). Average image
properties (L2, τ, RIMOD) were computed based on these two sets of
im-ages.
2.6. EELS calculations
A small-scale (216 atoms) atomistic model was produced using a simple
liquid quench MD simulation to allow for the calculation, using density
func-tional theory (DFT), of C K- electron loss near edge structures (ELNES).
The system density, 2.0 g/cm−3, and the quench rate, 0.25 K/ps, were chosen
so as to produce a structure resembling as much as possible that of the larger
irradiated graphite models. It is worth noting that, in such a small system,
highly anisotropic carbon forms straightforwardly and without imposing any
bias such as the external potentials based on 3D HRTEM image blocks used
in the IGAR simulations, because of the strong interactions with the periodic
boundary conditions.
ELNES features of this model were computed using the plane wave DFT
[37, 38] code CASTEP [39] with the Tkatchenko-Scheffler-van der
Waals-corrected [40] GGA PBE [41] functional with a 4×4×4 Monkhorst-Pack [42]
k point grid (spacing of less than 0.022 ˚A−1), and a plane wave energy
cut-off of 600 eV. The model was fully relaxed before calculation of the carbon
K-edges using 3072 unoccupied states up to +65 eV above the Fermi
en-ergy with self-consistently generated [43] on-the-fly pseudopotentials where
Bl¨ochl’s projector-augmented wave [44] (PAW) formalism was used to
recon-struct the all-electron eigenstates to calculate the matrix elements. The
M
AN
US
CR
IP
T
AC
CE
PT
ED
satisfy the dipole approximation in keeping with the small collection aperture
semi-angle used in the experiment. Energy-independent Gaussian
instrumen-tal broadening of 0.7 eV was applied alongside Lorentzian final-state lifetime
broadening of 0.17 eV based on published values [45].
3. Results
3.1. HRTEM observation
Three HRTEM (002) lattice fringe images taken from the 14 images time
series are presented in Fig. 2(a-c). At short irradiation times (2 min), long
linear fringes, reminiscent of the virgin (unirradiated) graphite structure, are
easily detected in the images. However, fringes exceeding 3 nm length are
very rare at the end of the 13 minute irradiation process as shown in the
filtered images with superimposed fringes in Fig. 2(d-f)). The overall fringe
tortuosity also significantly increases with increasing irradiation time as can
be visually perceived from these images. Damage progression is also evident
in the orientation images (Fig. 2(g-i)) where large columnar domains of even
contrast and hence constant orientation are observed at short irradiation
times, whilst smaller patchy orientation domains can be observed at the end
of the process. A complete time series of rotated HRTEM image cuts is
given as supporting movie S1 and quantitative descriptions of fringe (Fig.
S1) and orientation (Fig. S2) properties are provided in section S1 of the
supplementary material.
3.2. Atomistic models of irradiated graphite
We now present the properties of the times series of atomistic models,
gath-M
AN
US
CR
IP
T
AC
CE
PT
ED
Figure 2: HRTEM images of graphite during in-situ electron irradiation. (a-c) Observed
(002) lattice fringes after (a) 2, (b) 6 and (c) 13 minutes of irradiation. (d-f) Band pass
filtered enlargements of (a-c) with superimposed fringes. (g-i) orientation images of (d-f).
Image analysis was limited to domains having their 002 direction normal to the electron
M
AN
US
CR
IP
T
AC
CE
PT
ED
Figure 3: Full size atomistic models of electron irradiated graphite after (a) two and (b)
thirteen minutes of irradiation. (c) time series of atomistic models by steps of two minutes
(only 2×2×2 nm3 volumes are displayed for clarity). Atoms are color coded according
to C6 (threefold atom in three hexagonal rings) : white; C4 (fourfold atom): red; C3a
(threefold atom bonded to three threefold atoms, yet belonging to a non-hexagonal ring):
orange; C3b (threefold atom bonded to at least one fourfold atom): yellow;C3c (threefold
atom bonded to at least one twofold or singlefold atom): violet;C2(twofold atom): blue;
C1 (onefold): green; bonds between two C6: cyan; other bonds: black (see text for the
definition). The full time series of snapshots is also provided as movies S2 (2×2×2 nm3
M
AN
US
CR
IP
T
AC
CE
PT
ED
ered from the HRTEM images. Some of them are presented as snapshots
(either full sized or small volume cuts) in Fig. 3; the distribution of chemical
environments within these models is described in Fig. 4.
The initial model, reconstructed using the usual IGAR method from the
HRTEM image of graphite after two minutes of electron irradiation is shown
in Fig. 3(a). This model essentially retains a graphite-like structure with
more than 98 % of the atoms being threefold coordinated (sp2) and more
than 70 % (see Fig. 4), denoted asC6atoms in the present work, belonging to
three distinct hexagonal rings (see Fig. 3(c)). Among the remaining 30 % of
“defect” atoms are a few fourfold (sp3) and twofold (either sp or edge-radical
sp2) coordinated atoms denoted asC
4 (0.9 %) andC2 (0.6 %), respectively, as
well as 28 % of defective sp2 atoms. The latter can be subdivided into atoms
bonded only to sp2 atoms yet belonging to a non-hexagonal ring, denoted
as C3a (24 %), atoms bonded to a C4 atom, denoted as C3b (3 %) and the
remainder of sp2 atoms (those bonded to two-fold (C
2) or single-fold (C1)
atoms), denoted as C3c (less than 1 %). C6 atoms form large, well-stacked
graphene domains resulting in relatively long pair correlations and narrow
diffraction peaks (see Fig. S4 in the supplementary materials), corresponding
to relatively large coherence lengths (La = 4.0 nm, Lc = 4.6 nm) compared
to the simulation cell (a 5 nm wide cube). The interlayer distance between
the basal planes, d002, is equal to the value in pristine graphite (0.335 nm),
even though our model adopts a turbostratic stacking of basal planes, due
to random in-plane orientations, inherent to the reconstruction technique.
Hexagonal graphene layers are bound in plane through well-known grain
M
AN
US
CR
IP
T
AC
CE
PT
ED
C3aatoms. In addition, a complex network of interlayer crosslinks, essentially
in the form of screw dislocations, as identified recently in pyrolytic carbons
[22] and predicted to be a stable defect in graphite using DFT calculations
[47, 48], is clearly visible in Fig. 3(a). This is where most C4, C3b and C3c
atoms are apparent, in addition to numerous C3a atoms.
Figure 4: Evolution with irradiation time of the proportions of the different atomic carbon
environments (same definition and color code as in Fig. 3).
Fig. 3(c) and Fig. 4 reveal that under further irradiation, up to 13 min,
the total fraction of sp2 atoms slightly decreases from 98 % down to 93 %,
which is essentially accounted for by an increase in sp3 (C
4) atoms, from 0.9
% up to 6 %, the C2 fraction remaining at around 1 % during the whole
process. With increasing irradiation the fraction of C6 atoms is significantly
reduced, from above 70 % down to 28 %, while the fraction of C3a atoms
increases from 24 % up to 45 % due to a significant increase in the number of
M
AN
US
CR
IP
T
AC
CE
PT
ED
detailed ring statistics). Correspondingly the fraction of C3b atoms increases
from 3 % to about 20 %, yet the ratio of C3b to C4 atoms remains in the
range 3.2 to 3.6, indicative of a very limited clustering ofC4 atoms. We note,
that the production of defects (mainly C4,C3a and C3b atoms), rapid in the
very beginning of the process, tends to saturate above 9 min of irradiation.
Because of the large amount of damage occurring between two successive
models (see the dose rate below) we cannot assess the atomistic details of
damage production. However, as shown in Fig. 3(c), this work provides
for the first time a clear picture of damage progression at larger scale. The
reduction of in-plane order and increase in layer buckling is evident and
consistent with the significant decrease of intensity in the long range pair
correlation functions and reduction in longitudinal and transverse coherence
lengths (see Fig. S4). Also evident in Fig. 3(c) is the nucleation and build-up
of the screw dislocation network.
3.3. Validation
In Fig. 5 we compare some properties of experimental HRTEM images
and images derived from the 3D atomistic models obtained using a
multi-slice HRTEM simulation software [36]: L2, the average fringe length (Fig.
5(a));βM OD, the plateau value of the rotationally invariant mean orientation
difference (RIMOD) [49] at large (inter-domain) distances (Fig. 5(b)); and
LM OD, the average pixel to pixel distance at a fixed intra-domain RIMOD
value (Fig. 5(c)). As can be seen, the simulated HRTEM images reproduce
the evolution with irradiation of the fringe and orientation properties
ob-served in experimental images. The only significant deviation is obob-served for
M
AN
US
CR
IP
T
AC
CE
PT
ED
2 4 6 8 10 12 14
Irradiation time [min]
0.8 1 1.2 1.4 1.6 1.8 2 L 2 [nm] Exp. Sim.
2 4 6 8 10 12 14 6 8 10 12 14 β MOD [º] Exp. Sim.
2 4 6 8 10 12 14 0.1 0.2 0.3 0.4 0.5 L MOD [nm]
Exp. (a axis) Exp. (c axis) Sim. (a axis) Sim. (c axis)
RIMOD = 4º
a)
b)
[image:20.612.129.511.124.261.2]c)
Figure 5: Quantitative comparison of simulated and experimental HRTEM images.
Evo-lutions with irradiation time of (a) the average fringe length L2, (b) the plateau value
βM ODof the RIMOD at large interpixel distance, and (c) the average interpixel distance
at which RIMOD = 4◦. Fringes withL2>4 nm were discarded from the analysis in (a)
to allow for a comparison between simulations and experiments. The complete time series
of simulated HRTEM images are available as supporting movies S4 and S5.
of the misorientation between adjacent orientation domains. Comparison of
experimental (Fig. S2(c)) and simulated (Fig. S3(b)) isovalue polar chats of
the RIMOD, in the supplementary materials, further validate the
reproduc-tion of image properties.
The dose rate, expressed as the number of displacements per atom (dpa)
and per unit time can be relatively easily calculated from the models. For
this, we considered successive models (i.e. separated by a one-minute time
interval) and used two criteria for atomic displacements: one based on a
minimum displacement distance of 1.42 ˚A, corresponding to the bond length
in graphite, and the second one based on a minimum change of connectivity
of at least two neighbors, which holds for the creation (or annihilation) of
all common defects (Stone-Wales, vacancy, interstitial, etc...). These two
M
AN
US
CR
IP
T
AC
CE
PT
ED
step (less than 5% difference between the two methods) and the same average
dose rate: 0.070 dpa/min (see Fig. 6).
0
2
4
6
8
10
12
14
Irradiation time [min]
0
0.5
1
1.5
2
Displacements per atom
Simulations Fit (0.70 dpa/min) 30 eV - 5 barns 15 eV - 27.5 barns
Figure 6: Cumulative number of displaced atoms (expressed in dpa) as a function of
irradiation time. Symbols: simulation results (uncorrected for multiple displacements)
using the connectivity criterion (the data were shifted, based on fit, to match a zero
displacement at the unirradiated stage); full line: linear fit to the simulation data; dashed
blue line: lower limit of the experimental dose based onEd = 30 eV, corresponding toσd
= 5 barns [50, 51]; red dotted line: upper limit based on Ed = 15 eV (σd = 27.5 barns)
[51, 52].
However, our method for the dose calculation does not account for the
possibility that an atom undergoes several (two) displacements between two
successive models and thus provides a lower limit of the dose rate. A
cor-rection to account for double displacement, q2/2 = 0.00245 where q is the
calculated dose rate (this was obtained by integrating over one minute the
proba-M
AN
US
CR
IP
T
AC
CE
PT
ED
bility of an atom in a time interval δt) allows obtaining a corrected dose rate
of 0.072 dpa/min from the MD simulations. The total dose corresponding to
the 13 minutes exposure is thus estimated to 0.94 dpa. We would also like to
stress that this correction term only represents a small fraction of the total
dose rate, thus validating the choice of a one minute interval between two
successive snapshots.
In the TEM experiment, the average electron flux during beam exposure
was approximately 7.85 × 10⁵ nm−2s−1, which, for a 13 minutes long
ex-posure, gives a total fluence of 5.81 × 10⁸ e− nm−2. The conversion from
electron fluence to displacements per atom can be calculated by
consider-ing the displacement cross section (σd) and energy displacement threshold of
a carbon atom (Ed). There has been a relatively broad range of Ed values
quoted in the literature for various graphite-related structures, basically from
10 to 60 eV [50, 52], confusing the issue of the conversion between electron
fluence and dose. However, most recent studies, either based on experiments
or calculations seem to converge towards a narrower range of 15 to 30 eV
[14, 16, 50, 51, 53–55].
Assuming 30 eV and 15 eV as upper and lower bounds forEd, an electron
energy of 200 kV, and referring to Ref. 56 we obtain lower and upper bounds
forσd of 5 and 27.5 barns, respectively. The corresponding dose rates, which
we consider here as lower and upper bounds (see Fig. 6), are thus of around
0.0225 and 0.123 dpa/min, respectively. We see that the dose rate determined
from the models, 0.072 dpa/min, resides almost exactly in the middle of the
experimental uncertainty. It corresponds to an energy displacement threshold
M
AN
US
CR
IP
T
AC
CE
PT
ED
using TEM and DFT [55]) and graphite (25 eV using MD simulations [16,
50]). A last point to mention here is that, for simplicity and because of lack
of available data, we have considered here that the dose is a linear function
of irradiation time (or electron fluence). However, after severe irradiation
damage one can expect the energy displacement threshold to become reduced
[57], and hence, exhibit an increase in dose rate with increasing irradiation
time, as seems to be the case in the simulation data (see Fig. 6).
0 0.2 0.4 0.6 0.8 1
Received dose [dpa]
00.06 0.12 0.18 0.24 0.3 0.36
Stored energy [eV/atom]
Simulations Neutron irradiation
Figure 7: Stored energy of the irradiated graphite models as a function of the received
dose. Heat of combustion measurements for graphite irradiated with neutrons at room
temperature are given for comparison [58].
The amount of energy stored by the material during irradiation (i.e. its
net change in enthalpy) is a crucial and well-characterized property of nuclear
graphites as this energy could be released upon accidental increase in
tem-perature and potentially promote melting of the fission reactor core (Wigner
M
AN
US
CR
IP
T
AC
CE
PT
ED
computed as the average atomic enthalpy difference between irradiated and
pristine graphite models at room temperature and zero pressure. We observe
a sharp increase at the beginning of the irradiation process up to a plateau
of about 220 meV/atom obtained at around 0.6 dpa (corresponding to ≈ 9
min of irradiation), matching well the trend of defect production (see Fig.
4). It has to be compared to the continuous increase in dose (dpa) with time
up to the end of the process (see Fig. 6), in spite of an apparent steady state
for the chemical bonding within the material at times larger than 9 min.
Although we do not have experimental data for electron irradiated graphite,
the values reported here for the stored energy compare reasonably well to
heat of combustion measurements on neutron-irradiated graphite [58],
show-ing saturation at a similar dose value (0.43 dpa) albeit with an energy level
some 45 % larger than predicted here. This is consistent with the fact that
collisions with neutrons being more energetic than with electrons, they, on
average, create higher energy defects [59] (this is not accounted for in the
dose which relates more to the amount of created defects).
A last validation of the structural models concerns the reproduction of
electron energy loss (EEL) C K-edge spectra experimentally measured by
Mironov et al. in a similar in situ experiment in the TEM [60]. As the
di-rect calculation of EELS spectra from the large atomistic models simulated
in this work is not currently achievable, because of the high computational
cost associated with DFT calculations, we adopted a two-stage process: i)
firstly we used density functional theory (DFT) to calculate the C K-
elec-tron loss near edge structures (ELNES) of a small-scale (216 atoms) model
M
AN
US
CR
IP
T
AC
CE
PT
ED
of C6,C4,C3a andC3b atom types; and ii) we then produced simulated
spec-tra for the full series of larger scale models based on these separate relative
contributions.
Figure 8: (a) Small scale model of defective graphite produced by liquid quench MD
simulation and (b) DFT calculated C K-edge including the individual contributions ofC6,
C3a,C3b andC4atoms (same color code as Fig. 3).
The small-scale model, shown in Fig. 8(a), contains 29 %C6, 5 %C4, 50
%C3a and 16 %C3b atoms,i.e., typical of the values obtained from the
large-scale models for irradiation times of 9 min and longer (see Fig. 4). It is worth
mentioning that the bonding structure of the model was entirely preserved
during the DFT relaxation, confirming the stability of the structure produced
with the empirical (AIREBO) potential. Especially, we checked with extra
care the stability of the two interlayer sp3-sp3 bonds present in the model by
testing the local potential energy surface (PES) around these features which
closely resemble the well-known “pinch defect” in graphite (i.e. interlayer
bond between two α atoms) which is known to be artificially stabilized by
M
AN
US
CR
IP
T
AC
CE
PT
ED
S5), they actually correspond to well-defined minima in the DFT based PES,
confirming their stability, at least in sufficiently disordered systems like those
corresponding to doses close to 1 dpa.
The C K-ELNES computed from this model using DFT (Fig. 8(b)) is
typical of disordered carbons with a narrow, low intensity,π∗ band,≈2.5 eV
above the Fermi level, and a broad, high intensity σ∗ band with maximum
intensity in the 7.5-25 eV energy range. Analysis of the contributions from
the different carbon environments reveals that: (i)C4atoms do not show any
π∗ features in agreement with experimental diamond C K ELNES [61]; (ii)
C6 atoms have, as for graphite, narrower bands with an increased intensity
at the π∗ maximum; (iii) C3a atoms show an increase in intensity in the
region between the π∗ and σ∗ bands (the interband intensity); and (iv) C3b
atoms show a strong and narrow feature immediately above the Fermi level.
The origin of the latter feature, consistent with a well-known edge mode
[62] resulting from dangling bonds at the graphene edge, is discussed in the
supplementary materials (Fig. S6).
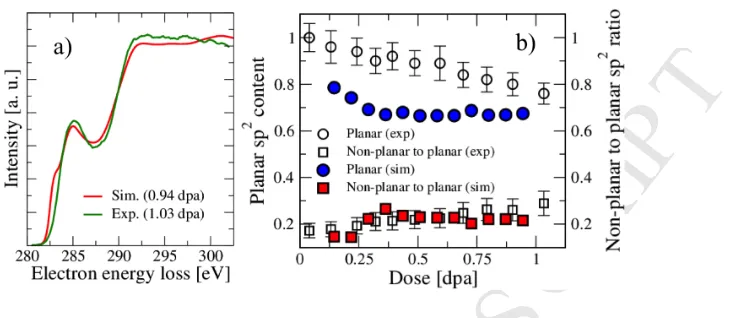
In Fig. 9(a) we compare the EELS spectrum computed for the large-scale
irradiated graphite model at the end of the TD-IGAR reconstruction (0.94
dpa) to an experimental spectrum obtained at a similar irradiation dose (1.03
dpa), and observe an overall good agreement, the main deviation being the
absence in the experimental spectrum of the low energy shoulder associated
to C3b atoms. This can be explained by either the overestimation in the
models of the amount of C4 atoms created by irradition (especially because
of the constraint of operating at fixed density), and hence of C3b atoms,
M
AN
US
CR
IP
T
AC
CE
[image:27.612.148.513.122.281.2]PT
ED
Figure 9: Electron energy loss carbon K-edge spectra. (a) Comparison of the predicted
and experimental spectra at ≈1 dpa. (b) Evolution with irradiation dose of the absolute planar sp2 carbon content (circles) and non-planar to planar sp2 carbon ratio (squares)
derived from predicted and experimental spectra. (experimental data are from Mironov
et al. [60], with the conversion from fluence to dose recalculated based on a displacement
energy threshold of 20 eV instead of 30 eV).
However, C3b atoms are stable defects, regularly encounterd in amorphous
carbon models produced by ab initio molecular dynamics simulations [63, 64].
From both the simulated and the experimental spectra we have been able
to extract and compare the absolute “planar sp2 carbon content”, calculated
from the ratio of π∗ (band) intensity divided by total integrated intensity,
normalized to graphite, and the so-called “non-planar to planar sp2 carbon
ratio” calculated from the ratio of intensity lying between the π∗ and σ∗
bands (the inter-band intensity) divided by the sum of π∗ and inter-band
intensities (see Ref. 60). As shown in Fig. 9(b), the experimental decrease
in planar sp2 content and increase in non-planar to planar sp2 ratio with
dose, up to a dose of ≈ 1 dpa at which they are known to plateau [60], are
M
AN
US
CR
IP
T
AC
CE
PT
ED
values are obtained at significantly lower doses (≈ 0.35 dpa).
3.4. Prediction of properties
Figure 10: Evolution with irradiation time of (a) the longitudinal and (b) transverse
Young’s moduli and thermal conductivities as well as of (c) the basal shear elastic constant
(C44). Values and error bars of Ekandκk for the IGAR models are based on the average
values and deviations, respectively, from simulations performed along xandy directions.
Following validation of the models, we present in Fig. 10 some of their
elastic constants (the complete list of elastic compliances is given in table
S2) and their classical phonon contributions to the thermal conductivity.
Interestingly, the evolution of in-plane (Fig. 10(a)) and out-of-plane (Fig.
10(b)) properties show a very similar behavior with increasing irradiation for
both the Young’s modulus and thermal conductivity. The in-plane modulus,
Ek, quickly drops during the early stages of irradiation, before slowly reaching
a plateau at around 560 GPa, accounting for ≈ 2/3 of the pristine value.
Correspondingly, the in-plane conductivity,κk, decreases by approximately a
factor of four. Out-of-plane properties, E⊥ andκ⊥, progressively increase by
a factor of≈2 between 2 and 13 minutes of irradiation (note that the strong
reduction in these properties between pristine graphite and the 2 minutes
M
AN
US
CR
IP
T
AC
CE
PT
ED
IGAR reconstructed models [28]). As shown in Fig. 10(c), and in agreement
with experimental observations [65] (at much lower damage levels), the most
affected elastic constant is C44 which increases by a factor of ≈ 35 after
13 min of irradiation. The findings reported here can be rationalized by
the structural alterations observed in the models: the decrease in in-plane
properties is consistent with the decrease of in-plane structural order and the
increase in transverse (except between 0 and 2 min of irradiation) and shear
properties can be attributed to the progressive development of interlayer
covalent bonding [28]. Further discussion of these properties, in line with
literature data, is provided in section S4 in the supplementary materials.
0
0.2
0.4
0.6
0.8
1
Dose [dpa]
0
25
50
75
100
125
E
iso[GPa]
E
iso0
5
10
15
20
25
κ
iso[W/m/K]
κ
isoFigure 11: Evolution with dose of the Young’s modulus and thermal conductivity
homog-enized to isotropic graphite (Voigt-Reuss-Hill average).
Finally, we present in Fig. 11 the evolution with irradiation dose of the
Young’s modulus Eiso and thermal conductivity κiso for a dense isotropic
M
AN
US
CR
IP
T
AC
CE
PT
ED
been predicted via homogenization of the elastic constants and thermal
con-ductivities computed from the anisotropic irradiated graphite models (see
section S5 and Fig. S7 in the supplementary materials). Eiso shows the
well-known increase in modulus with increasing dose, as well as signs of saturation
at around 3 times the value of the virgin material at a dose approaching 1
dpa, in good agreement with experimental observation on neutron irradiated
nuclear graphite [5]. Quantitatively speaking, the predicted values of Eiso
are typically ≈ 4 times larger than experimental values for nuclear grade
graphite, including the virgin unirradiated material. This is expected as we
operate at the density of the single crystal of graphite (2.2 g/cm3), whilst the
density of actual nuclear graphites is usually lower than 1.8 g/cm3, because
of porosity, thus reducing stiffness. The well-known experimental decrease in
κiso with increasing dose [8] is also well accounted for, here by a factor of 4,
although a fully quantitative description of thermal conductivity is definitely
not achievable using such small (5 nm width) models, as discussed in section
S4 in the supplementary materials.
4. Conclusion
We have presented a relatively intuitive and robust methodology to
ex-tract the atomistic features of room temperature irradiation damage in graphite
solely from HRTEM (002) lattice fringe images. The dynamic reconstructed
models have allowed us to characterize damage propagation at doses
corre-sponding to years in a nuclear reactor core and where conventional damage
mechanisms, based on Frenkel pair formation and migration, do not apply.
M
AN
US
CR
IP
T
AC
CE
PT
ED
dose rate, HRTEM image contrast, EELS carbon K-edges and stored
ener-gies. We have demonstrated that these models capture the elastic properties
and thermal conductivities of irradiated graphite and, upon homogenization
to the case of an isotropic polycrystalline graphite, we are able to predict,
for the first time using an atomistic model, the increase in Young’s modulus
and decrease in thermal conductivity occurring during the irradiation of a
nuclear grade graphite. Whilst improvements are possible, for instance by
taking into account dimensional changes or using HRTEM images of graphite
irradiated with neutrons in the reconstruction procedure, we believe that the
approach proposed in this paper opens up many opportunities for the
deduc-tion of structure/property diagnostics for irradiated graphite, a particularly
relevant issue for current and future graphite-based nuclear power plants.
Acknowledgements
Prof. Malcolm Heggie is gratefully acknowledged by the authors for
useful discussions on the manuscript. This work was supported by the
french Agence Nationale de la Recherche through the PyroMaN project
(grant ANR-2010-BLAN-929), the Materials and System Institute in
Bor-deaux (Carnot Institute), the UK National Nuclear Laboratory and EPSRC
(grants EP/J502042/1 and EP/I002588/1). EPSRC is also acknowledged by
TH for a Doctoral Prize Fellowship. JML acknowledges support from the
French ICoME2 LabEx (grant ANR-11-LABX-0053). Part of the classical
atomistic simulations were performed using the computational resources of
the M´esocentre de Calcul Intensif en Aquitaine (MCIA). DFT calculations
perfor-M
AN
US
CR
IP
T
AC
CE
PT
ED
mance computing facility at the University of Leeds.
References
[1] Tanabe T, Muto S, Gotoh Y, Niwase K. Reduction of the crystalline
size of graphite by neutron irradiation. J Nucl Mater. 1990;175(3):258
– 261.
[2] Thrower PA, Reynolds WN. Microstructural changes in
neutron-irradiated graphite. J Nucl Mater. 1963;8(2):221–226.
[3] Kelly BT, Marsden BJ, Hall K, Martin DG, Harper A, Blanchard A.
Tech. Rep. Ref. TECDOC-1154, IAEA, Vienna. IAEA, Vienna; 2000.
[4] Koike J, Pedraza DF. Dimensional changes in highly oriented pyrolytic
graphite due to electron irradiation. J Mater Res. 1994;9(7):1899–1907.
[5] Taylor R, Brown RG, Gilchirst K, Hall E, Hodds AT, Kelly BT, et al.
The mechanical properties of reactor graphite. Carbon. 1967;5:519–531.
[6] Burchell TD, Eatherly WP. The effects of radiation damage on the
properties of GraphNOL N3M. J Nucl Mater. 1991;179:205 – 208.
[7] Burchell TD. Graphite: Properties and Characteristics. In: Konings
RJM, editor. Comprehensive Nuclear Materials. Oxford: Elsevier; 2012.
p. 285 – 305.
[8] Snead LL, Burchell TD. Thermal conductivity degradation of graphites
due to neutron irradiation at low temperature. J Nucl Mater.
M
AN
US
CR
IP
T
AC
CE
PT
ED
[9] Telling RH, Ewels CP, El-Barbary AA, Heggie MI. Wigner defects bridge
the graphite gap. Nat Mater. 2003;2(5):333–337.
[10] Telling RH, Heggie MI. Radiation defects in graphite. Philos Mag.
2007;87(31):4797–4846.
[11] Bacon GE, Warren BE. X-ray diffraction studies of neutron-irradiated
graphite. Acta Cryst. 1956;9(12):1029–1035.
[12] Kelly BT. Graphite - the most fascinating nuclear material. Carbon.
1982;20(1):3–11.
[13] Smith R, Beardmore K. Molecular dynamics studies of particle impacts
with carbon-based materials. Thin Sol Films. 1996;272(2):255–270.
[14] Yazyev OV, Tavernelli I, Rothlisberger U, Helm L. Early stages of
radi-ation damage in graphite and carbon nanostructures: A first-principles
molecular dynamics study. Phys Rev B. 2007;75:115418.
[15] Chartier A, Van Brutzel L, Pannier B, Baranek P. Atomic scale
mechanisms for the amorphisation of irradiated graphite. Carbon.
2015;91:395–407.
[16] Christie HJ, Robinson M, Roach DL, Ross DK, Suarez-Martinez I,
Marks NA. Simulating radiation damage cascades in graphite.
Car-bon. 2015;81:105–114.
[17] Trevethan T, Heggie MI. Molecular dynamics simulations of irradiation
defects in graphite: Single crystal mechanical and thermal properties.
M
AN
US
CR
IP
T
AC
CE
PT
ED
[18] Jain SK, Pellenq RJM, Pikunic JP, Gubbins KE. Molecular
Model-ing of Porous Carbons UsModel-ing the Hybrid Reverse Monte Carlo Method.
Langmuir. 2006;22(24):9942–9948.
[19] Bousige C, Ghimbeu CM, Vix-Guterl C, Pomerantz AE, Suleimenova A,
Vaughan G, et al. Realistic molecular model of kerogen’s nanostructure.
Nat Mater. 2016;15(5):576–582.
[20] Petersen TC, Snook IK, Yarovsky I, McCulloch DG, O’Malley B.
Curved-Surface Atomic Modeling of Nanoporous Carbon. J Phys Chem
C. 2007;111(2):802–812.
[21] Farbos B, Weisbecker P, Fischer HE, Da Costa JP, Lalanne M, Chollon
G, et al. Nanoscale structure and texture of highly anisotropic
pyrocar-bons revisited with transmission electron microscopy, image processing,
neutron diffraction and atomistic modelling. Carbon. 2014;80:472–489.
[22] Leyssale JM, Da Costa JP, Germain C, Weisbecker P, Vignoles GL.
Structural features of pyrocarbon atomistic models constructed from
transmission electron microscopy images. Carbon. 2012;50:4388–4400.
[23] Takeuchi M, Muto S, Tanabe T, Kurata H, Hojou K. Structural change
in graphite under electron irradiation at low temperatures. J Nucl Mater.
1999;271–272:280–284.
[24] Karthik C, Kane J, Butt DP, Windes WE, Ubic R. In situ transmission
electron microscopy of electron-beam induced damage process in nuclear
M
AN
US
CR
IP
T
AC
CE
PT
ED
[25] Leyssale JM, Da Costa JP, Germain C, Weisbecker P, Vignoles GL.
An Image Guided Atomistic Reconstruction of pyrolytic carbons. Appl
Phys Lett. 2009;95(23):231912.
[26] Knutsson H. Representing local structure using tensors. In: Proceedings
of the 6th Scandinavian Conf. on Image Analysis; 1989. p. 244–251.
[27] Lees AW, Edwards SF. The computer study of transport processes under
extreme conditions. J Phys C. 1972;5:1921–9.
[28] Farbos B, Da Costa JP, Vignoles GL, Leyssale JM. Nanoscale elasticity
of highly anisotropic pyrocarbons. Carbon. 2015;94:285–294.
[29] M¨uller-Plathe F. A simple nonequilibrium molecular dynamics method
for calculating the thermal conductivity. J Chem Phys. 1997;106:6082–
6085.
[30] Brenner DW, Shenderova OA, Harrison JA, Stuart SJ, Ni B, Sinnott
SB. A second-generation reactive empirical bond order (REBO)
po-tential energy expression for hydrocarbons. J Phys: Condens Matt.
2002;14(4):783–802.
[31] Leyssale JM, Vignoles GL. A Large-Scale Molecular Dynamics Study of
the Divacancy Defect in Graphene. J Phys Chem C. 2014;118(15):8200–
8216.
[32] Latham CD, McKenna AJ, Trevethan TP, Heggie MI, Rayson MJ,
Brid-don PR. On the validity of empirical potentials for simulating
ra-diation damage in graphite: a benchmark. J Physi: Condens Matt.
M
AN
US
CR
IP
T
AC
CE
PT
ED
[33] Stuart SJ, Tutein AB, Harrison JA. A reactive potential for
hydrocar-bons with intermolecular interactions. J Chem Phys. 2000;112(14):6472–
6486.
[34] Andersen HC. Molecular dynamics simulations at constant pressure
and/or temperature. J Chem Phys. 1980;72:2384.
[35] Berendsen HJC, Postma JPM, van Gunsteren WF, DiNola A, Haak JR.
Molecular Dynamics with Coupling to an External Bath. J Chem Phys.
1984;81:3684–3690.
[36] Kilaas R. Interactive software for simulation of high resolution TEM
im-ages. In: Geiss RH, editor. Proceedings of the 22nd Annual Conference
of the Microbeam Aanalysis Society; 1987. p. 293–300.
[37] Hohenberg P, Kohn W. Inhomogeneous electron gas. Phys Rev.
1964;136:B864.
[38] Kohn W, Sham LJ. Self-consistent equations including exchange and
correlation effects. Phys Rev. 1965;140:A14433.
[39] Clark SJ, Segall MD, Pickard CJ, Hasnip PJ, Probert MJ, Refson
K, et al. First principles methods using CASTEP. Z Kristallogr.
2005;220:567.
[40] Tkatchenko A, Scheffler M. Accurate molecular van der Waals
interac-tions from ground-state electron density and free-atom reference data.
M
AN
US
CR
IP
T
AC
CE
PT
ED
[41] Perdew JP, Burke K, Ernzerhof M. Generalized Gradient Approximation
Made Simple. Phys Rev Lett. 1996;77:3865–8.
[42] Monkhorst HJ, Pack JD. Special points for Brillouin-zone integrations.
Phys Rev B. 1976;13:5188–5192.
[43] Pickard CJ, Payne M. In: Rodenburg JM, editor. Ab Initio EELS:
Beyond the Fingerprint. Philadelphia, PA: IOP Publishing LTD; 1997.
p. 175.
[44] Bl¨ochl PE. Projector augmented-wave method. Phys Rev B.
1994;50:17953–17979.
[45] Krause MO. Atomic radiative and radiationless yields for K and L shells.
J Phys Chem Ref Data. 1979;8:307–327.
[46] Huang PY, Ruiz-Vargas CS, van der Zande AM, Whitney WS,
Leven-dorf MP, Kevek JW, et al. Grains and grain boundaries in single-layer
graphene atomic patchwork quilts. Nature. 2011;469:389–392.
[47] Suarez-Martinez I, Savini G, Haffenden G, Campanera JM, Heggie MI.
Dislocations of Burgers vector c /2 in graphite. Phys Stat Sol (c).
2007;4(8):2958–2962.
[48] Trevethan T, Dyulgerova P, Latham CD, Heggie MI, Seabourne CR,
Scott AJ, et al. Extended Interplanar Linking in Graphite Formed from
Vacancy Aggregates. Phys Rev Lett. 2013;111:095501.
Ger-M
AN
US
CR
IP
T
AC
CE
PT
ED
main C. Investigating carbon materials nanostructure using image
ori-entation statistics. Carbon. 2015;84:160–173.
[50] McKenna AJ, Trevethan T, Latham CD, Young PJ, Heggie MI.
Thresh-old displacement energy and damage function in graphite from molecular
dynamics. Carbon. 2016;99:71–78.
[51] Krasheninnikov AV, Banhart F, Li JX, Foster AS, Nieminen RM.
Sta-bility of carbon nanotubes under electron irradiation: Role of tube
di-ameter and chirality. Phys Rev B. 2005;72:125428.
[52] Banhart F. Irradiation effects in carbon nanostructures. Rep Prog Phys.
1999;62:1181–1221.
[53] Banhart F, F¨uller T, Redlich P, Ajayan PM. The formation, annealing
and self-compression of carbon onions under electron irradiation. Chem
Phys Lett. 1997;269(3):349–355.
[54] Zobelli A, Gloter A, Ewels CP, Seifert G, Colliex C. Electron
knock-on cross sectiknock-on of carbknock-on and borknock-on nitride nanotubes. Phys Rev B.
2007;75:245402.
[55] Susi T, Hofer C, Argentero G, Leuthner GT, Pennycook TJ, Mangler
C, et al. Isotope analysis in the transmission electron microscope. Nat
Commun. 2016;7:13040.
[56] Oen O. Cross Sections for Atomic Displacements in Solids by Fast
M
AN
US
CR
IP
T
AC
CE
PT
ED
[57] Kotakoski J, Santos-Cottin D, Krasheninnikov AV. Stability of
Graphene Edges under Electron Beam: Equilibrium Energetics versus
Dynamic Effects. ACS Nano. 2012;6:671–676.
[58] Nightingale RE. Nuclear Graphite. Academic Press; 1962.
[59] Krasheninnikov AV, Nordlund K. Ion and electron irradiation-induced
effects in nanostructured materials. J App Phys. 2010;107:071301.
[60] Mironov BE, Freeman HM, Brown AP, Hage FS, Scott AJ, Westwood
AVK, et al. Electron irradiation of nuclear graphite studied by
transmis-sion electron microscopy and electron energy loss spectroscopy. Carbon.
2015;83:106–117.
[61] Mykhaylyk OO, Solonin YM, Batchelder DN, Brydson R.
Transfor-mation of nanodiamond into carbon onions: A comparative study by
high-resolution transmission electron microscopy, electron energy-loss
spectroscopy, x-ray diffraction, small-angle x-ray scattering, and
ultra-violet Raman spectroscopy. J Appl Phys. 2005;97(7):074302.
[62] Suenaga K, Koshino M. Atom-by-atom spectroscopy at graphene edge.
Nature. 2010;468(7327):1088–1090.
[63] Marks NA, McKenzie DR, Pailthorpe BA, Bernasconi M, Parrinello M.
Microscopic Structure of Tetrahedral Amorphous Carbon. Phys Rev
Lett. 1996;76:768–771.
[64] Martin N, Pailler R, Leyssale JM. Carbon-ceramic (AlN) interfaces from
liquid quench ab initio molecular dynamics simulations. Mol Simul.
M
AN
US
CR
IP
T
AC
CE
PT
ED
[65] Seldin EJ, Nezbeda CW. Elastic constants and electron-microscope
observations of neutron-irradiated compression-annealed pyrolytic and