This is a repository copy of
Generalisation in named entity recognition: A quantitative
analysis
.
White Rose Research Online URL for this paper:
http://eprints.whiterose.ac.uk/110909/
Version: Published Version
Article:
Augenstein, I., Derczynski, L. and Bontcheva, K. (2017) Generalisation in named entity
recognition: A quantitative analysis. Computer Speech & Language, 44. pp. 61-83. ISSN
0885-2308
https://doi.org/10.1016/j.csl.2017.01.012
[email protected] https://eprints.whiterose.ac.uk/
Reuse
This article is distributed under the terms of the Creative Commons Attribution (CC BY) licence. This licence allows you to distribute, remix, tweak, and build upon the work, even commercially, as long as you credit the authors for the original work. More information and the full terms of the licence here:
https://creativecommons.org/licenses/
Takedown
If you consider content in White Rose Research Online to be in breach of UK law, please notify us by
Generalisation in named entity recognition: A quantitative analysis
TaggedP
D1
X X
Isabelle Augenstein
D2
X X
*
,
D3
X X
Leon Derczynski
D4
X X
,
D5
X X
Kalina Bontcheva
D6
X X
TaggedP
University of Sheffield, Sheffield, S14DP, UK
Received 5 January 2016; received in revised form 22 August 2016; accepted 1 January 2017 Available online 14 February 2017
TaggedP
Abstract
Named Entity Recognition (NER) is a key NLP task, which is all the more challenging on Web and user-generated content with their diverse and continuously changing language. This paper aims to quantify how this diversity impacts state-of-the-art NER meth-ods, by measuring named entity (NE) and context variability, feature sparsity, and their effects on precision and recall. In particular, our findings indicate that NER approaches struggle to generalise in diverse genres with limited training data. Unseen NEs, in partic-ular, play an important role, which have a higher incidence in diverse genres such as social media than in more regular genres such as newswire. Coupled with a higher incidence of unseen features more generally and the lack of large training corpora, this leads to significantly lowerF1 scores for diverse genres as compared to more regular ones. We also find that leading systems rely heavily on surface forms found in training data, having problems generalising beyond these, and offer explanations for this observation.
Ó 2017 The Authors. Published by Elsevier Ltd.
This is an open access article article under the CC BY license. (http://creativecommons.org/licenses/by/4.0/).
TaggedP
Keywords: Natural language processing; Information extraction; Named entity recognition; Generalisation; Entity drift; Social media; Quantitative study
1. Introduction
TaggedP
Named entity recognition and classification (NERC, shortNER), the task of recognising and assigning a class to
mentions of proper names (named entities,NEs) in text, has attracted many years of research (Nadeau and Sekine,
2007; Ratinov and Roth, 2009), analyses (Palmer and Day, 1997), starting from the first MUC challenge in 1995
(Grishman and Sundheim, 1995). Recognising entities is key to many applications, including text summarisation
(Schiffman et al., 2002), search (Toda and Kataoka, 2005), the semantic web (Maynard et al., 2016), topic modelling
(Newman et al., 2006), and machine translation (Al-Onaizan and Knight, 2002; Steinberger et al., 2011).
TaggedP
As NER is being applied to increasingly diverse and challenging text genres (Derczynski et al., 2013, Fromreide
et al., 2014, Whitelaw et al., 2008), this has lead to a noisier, sparser feature space, which in turn requires
regularisa-tion (Cherry and Guo, 2015) and the avoidance of overfitting. This has been the case even for large corpora all of the
same genre and with the same entity classification scheme, such as ACE (Mooney and Bunescu, 2005). Recall, in
particular, has been a persistent problem, as named entities often seem to have unusual surface forms, e.g. unusual
* Corresponding author.
E-mail addresses:[email protected],[email protected](I. Augenstein).
http://dx.doi.org/10.1016/j.csl.2017.01.012
0885-2308/Ó2017 The Authors. Published by Elsevier Ltd. This is an open access article under the CC BY license. (http://creativecommons.org/
licenses/by/4.0/)
Computer Speech & Language 44 (2017) 61 83
TaggedP
character sequences for the given language (e.g.Szegedin an English-language document) or words that individually
are typically not NEs, unless they are combined together (e.g.the White House).
TaggedP
Indeed, the move from ACE and MUC to broader kinds of corpora has presented existing NER systems and
resources with a great deal of difficulty (Maynard et al., 2003), which some researchers have tried to address through
domain adaptation, specifically with entity recognition in mind (Daume, 2007; Wu et al., 2009; Guo et al., 2009;
Chiticariu et al., 2010; Augenstein, 2014). However, more recent performance comparisons of NER methods over
different corpora showed that older tools tend to simply fail to adapt, even when given a fair amount of in-domain
data and resources (Ritter et al., 2011; Derczynski et al., 2015). Simultaneously, the value of NER in non-newswire
data (Ritter et al., 2011; Liu et al., 2011; Plank et al., 2014; Rowe et al., 2015; Baldwin et al., 2015) has rocketed: for
example, social media now provides us with a sample of all human discourse, unmolested by editors, publishing
guidelines and the like, and all in digital format leading to whole new fields of research opening in computational
social science (Hovy et al., 2015; Plank and Hovy, 2015; Preotiuc-Pietro et al., 2015¸ ).
TaggedP
The prevailing assumption has been that this lower NER performance is due to domain differences arising from
using newswire (NW) as training data, as well as from the irregular, noisy nature of new media (e.g.Ritter et al.,
2011). Existing studies (Derczynski et al., 2015) further suggest that named entity diversity, discrepancy between
named entities in the training set and the test set (entity driftover time in particular), and diverse context, are the
likely reasons behind the significantly lower NER performance on social media corpora, as compared to newswire.
TaggedP
No prior studies, however, have investigated these hypotheses quantitatively. For example, it is not yet estab-lished whether this performance drop is really due to a higher proportion of unseen NEs in the social media, or is it instead due to NEs being situated in different kinds of linguistic context.
TaggedP
Accordingly, the contributions of this paper lie in investigating the following open research questions:
TaggedP RQ1How does NERC performance differ for corpora between different NER approaches? TaggedP RQ2How does NERC performance differ for corpora over different text types/genres? TaggedP RQ3What is the impact of NE diversity on system performance?
TaggedP RQ4 What is the relationship between Out-of-Vocabulary (OOV) features (unseen features), OOV entities (unseen NEs) and performance?
TaggedP RQ5How well do NERC methods perform out-of-domain and what impact do unseen NEs (i.e. those which appear in the test set, but not the training set) have on out-of-domain performance?
TaggedP
In particular, the paper carries out a comparative analysis of the performance of several different approaches to statistical NER over multiple text genres, with varying NE and lexical diversity. In line with prior analyses of NER
performance (Palmer and Day, 1997; Derczynski et al., 2015), we carry out corpus analysis and introduce briefly the
NER methods used for experimentation. Unlike prior efforts, however, our main objectives are to uncover the impact
of NE diversity and context diversity on performance (measured primarily byF1 score), and also to study the
rela-tionship between OOV NEs and features andF1. SeeSection 3for details.
TaggedP
To ensure representativeness and comprehensiveness, our experimental findings are based on key benchmark NER corpora spanning multiple genres, time periods, and corpus annotation methodologies and guidelines. As
detailed inSection 2.1, the corpora studied are OntoNotes (Hovy et al., 2006), ACE (Walker et al., 2006), MUC 7
(Chinchor, 1998), the Ritter NER corpus (Ritter et al., 2011), the MSM 2013 corpus (Rowe et al., 2013), and the
UMBC Twitter corpus (Finin et al., 2010). To eliminate potential bias from the choice of statistical NER approach,
experiments are carried out with three differently-principled NER approaches, namely Stanford NER (Finkel et al.,
2005), SENNA (Collobert et al., 2011) and CRFSuite (Okazaki, 2007) (seeSection 2.2for details).
2. Datasets and methods
2.1. Datasets
TaggedP
Since the goal of this study is to compare NER performance on corpora from diverse domains and genres, seven benchmark NER corpora are included, spanning newswire, broadcast conversation, Web content, and social media
(seeTable 1for details). These datasets were chosen such that they have been annotated with the same or very similar
TaggedP
entities (e.g. biomedical corpora) were excluded. The choice of corpora was also motivated by their chronological age; we wanted to ensure a good temporal diversity, in order to study possible effects of entity drift over time.
TaggedP
A note is required about terminology. This paper refers to textgenreand also textdomain. These are two
dimen-sions by which a document or corpus can be described. Genre here accounts the general characteristics of the text, measurable with things like register, tone, reading ease, sentence length, vocabulary and so on. Domain describes the dominant subject matter of text, which might give specialised vocabulary or specific, unusal word senses. For example, “broadcast news” is a genre, describing the manner of use of language, whereas “financial text” or “popular culture” are domains, describing the topic. One notable exception to this terminology is social media, which tends to
be a blend of myriad domains and genres, with huge variation in both these dimensions (Hu et al., 2013; Baldwin
et al., 2013); for simplicity, we also refer to this as a genre here.
TaggedP
2.1.1. Corpora used
TaggedP
In chronological order, the first corpus included here is MUC 7, which is the last of the MUC challenges
(Chinchor, 1998). This is an important corpus, since the Message Understanding Conference (MUC) was the first
one to introduce the NER task in 1995 (Grishman and Sundheim, 1995), with focus on recognising persons, locations
and organisations in newswire text.
TaggedP
A subsequent evaluation campaign was the CoNLL 2003 NER shared task (Tjong Kim Sang and De Meulder,
2003), which created gold standard data for newswire in Spanish, Dutch, English and German. The corpus of this
evaluation effort is now one of the most popular gold standards for NER, with new NER approaches and methods often reporting performance on that.
TaggedP
Later evaluation campaigns began addressing NER for genres other than newswire, specifically ACE (Walker et al.,
2006) and OntoNotes (Hovy et al., 2006). Both of those contain subcorpora in several genres, namely newswire,
broad-cast news, broadbroad-cast conversation, weblogs, and conversational telephone speech. ACE, in addition, contains a subcor-pus with usenet newsgroups. Like CoNLL 2003, the OntoNotes corsubcor-pus is also a popular benchmark dataset for NER. The languages covered are English, Arabic and Chinese. A further difference between the ACE and OntoNotes corpora on one hand, and CoNLL and MUC on the other, is that they contain annotations not only for NER, but also for other tasks such as coreference resolution, relation and event extraction and word sense disambiguation. In this paper, how-ever, we restrict ourselves purely to the English NER annotations, for consistency across datasets. The ACE corpus contains HEAD as well as EXTENT annotations for NE spans. For our experiments we use the EXTENT tags.
TaggedP
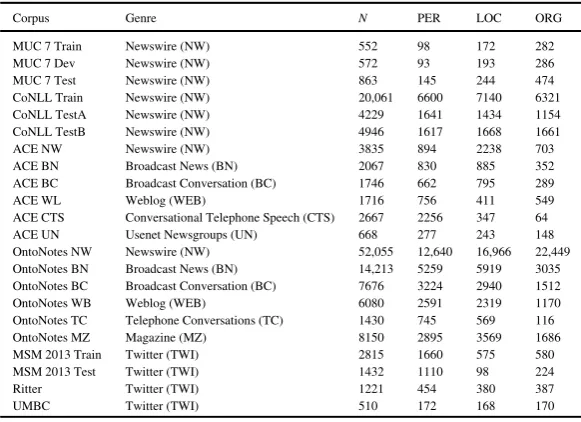
[image:4.544.124.415.86.297.2]With the emergence of social media, studying NER performance on this genre gained momentum. So far, there have been no big evaluation efforts, such as ACE and OntoNotes, resulting in substantial amounts of gold
Table 1
Corpora genres and number of NEs of different classes.
Corpus Genre N PER LOC ORG
MUC 7 Train Newswire (NW) 552 98 172 282
MUC 7 Dev Newswire (NW) 572 93 193 286
MUC 7 Test Newswire (NW) 863 145 244 474
CoNLL Train Newswire (NW) 20,061 6600 7140 6321
CoNLL TestA Newswire (NW) 4229 1641 1434 1154
CoNLL TestB Newswire (NW) 4946 1617 1668 1661
ACE NW Newswire (NW) 3835 894 2238 703
ACE BN Broadcast News (BN) 2067 830 885 352
ACE BC Broadcast Conversation (BC) 1746 662 795 289
ACE WL Weblog (WEB) 1716 756 411 549
ACE CTS Conversational Telephone Speech (CTS) 2667 2256 347 64
ACE UN Usenet Newsgroups (UN) 668 277 243 148
OntoNotes NW Newswire (NW) 52,055 12,640 16,966 22,449
OntoNotes BN Broadcast News (BN) 14,213 5259 5919 3035
OntoNotes BC Broadcast Conversation (BC) 7676 3224 2940 1512
OntoNotes WB Weblog (WEB) 6080 2591 2319 1170
OntoNotes TC Telephone Conversations (TC) 1430 745 569 116
OntoNotes MZ Magazine (MZ) 8150 2895 3569 1686
MSM 2013 Train Twitter (TWI) 2815 1660 575 580
MSM 2013 Test Twitter (TWI) 1432 1110 98 224
Ritter Twitter (TWI) 1221 454 380 387
TaggedP
standard data. Instead, benchmark corpora were created as part of smaller challenges or individual projects. The first
such corpus is the UMBC corpus for Twitter NER (Finin et al., 2010), where researchers used crowdsourcing
to obtain annotations for persons, locations and organisations. A further Twitter NER corpus was created by
Ritter et al. (2011), which, in contrast to other corpora, contains more fine-grained classes defined by the Freebase
schema (Bollacker et al., 2008). Next, the Making Sense of Microposts initiative (Rowe et al., 2013) (MSM)
pro-vides single annotated data for named entity recognition on Twitter for persons, locations, organisations and miscel-laneous. MSM initiatives from 2014 onwards in addition feature a named entity linking task, but since we only focus on NER here, we use the 2013 corpus.
TaggedP
These corpora are diverse not only in terms of genres and time periods covered, but also in terms of NE classes and their definitions. In particular, the ACE and OntoNotes corpora try to model entity metonymy by introducing facilities and geo-political entities (GPEs). Since the rest of the benchmark datasets do not make this distinction, metonymous entities are mapped to a more common entity class (see below).
TaggedP
In order to ensure consistency across corpora, only Person (PER), Location (LOC) and Organisation (ORG) are used in our experiments, and other NE classes are mapped to O (no NE). For the Ritter corpus, the 10 entity classes
are collapsed to three as inRitter et al. (2011). For the ACE and OntoNotes corpora, the following mapping is used:
PERSON!PER; LOCATION, FACILITY, GPE!LOC; ORGANIZATION!ORG; all other classes!O.
TaggedP
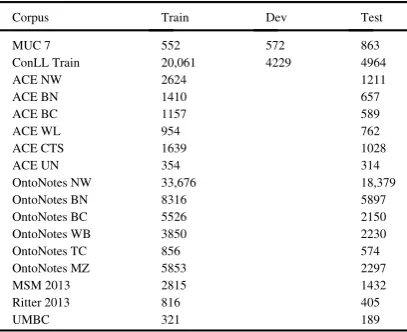
Tokens are annotated with BIO sequence tags, indicating that they are the beginning (B) or inside (I) of NE men-tions, or outside of NE mentions (O). For the Ritter and ACE 2005 corpora, separate training and test corpora are not publicly available, so we randomly sample 1/3 for testing and use the rest for training. The resulting training and
test-ing data sizes measured in number of NEs are listed inTable 2. Separate models are then trained on the training parts
of each corpus and evaluated on the development (if available) and test parts of the same corpus. If development parts are available, as they are for CoNLL (CoNLL Test A) and MUC (MUC 7 Dev), they are not merged with the training corpora for testing, as it was permitted to do in the context of those evaluation challenges.
TaggedP
2.1.2. Dataset sizes and characteristics
TaggedP
Table 1shows which genres the different corpora belong to, the number of NEs and the proportions of NE classes
per corpus. Sizes of NER corpora have increased over time, from MUC to OntoNotes.
TaggedP
[image:5.544.172.376.515.681.2]Further, the class distribution varies between corpora: while the CoNLL corpus is very balanced and contains about equal numbers of PER, LOC and ORG NEs, other corpora are not. The least balanced corpus is the MSM 2013 Test corpus, which contains 98 LOC NEs, but 1110 PER NEs. This makes it difficult to compare NER perfor-mance here, since perforperfor-mance partly depends on training data size. Since comparing NER perforperfor-mance as such is not the goal of this paper, we will illustrate the impact of training data size by using learning curves in the next
Table 2
Sizes of corpora, measured in number of NEs, used for training and testing. Note that the for the ConLL corpus the dev set is called “Test A” and the test set “Test B”.
Corpus Train Dev Test
MUC 7 552 572 863
ConLL Train 20,061 4229 4964
ACE NW 2624 1211
ACE BN 1410 657
ACE BC 1157 589
ACE WL 954 762
ACE CTS 1639 1028
ACE UN 354 314
OntoNotes NW 33,676 18,379
OntoNotes BN 8316 5897
OntoNotes BC 5526 2150
OntoNotes WB 3850 2230
OntoNotes TC 856 574
OntoNotes MZ 5853 2297
MSM 2013 2815 1432
Ritter 2013 816 405
TaggedP
section; illustrate NERC performance on trained corpora normalised by size inTable 3; and then only use the
origi-nal training data size for subsequent experiments.
TaggedP
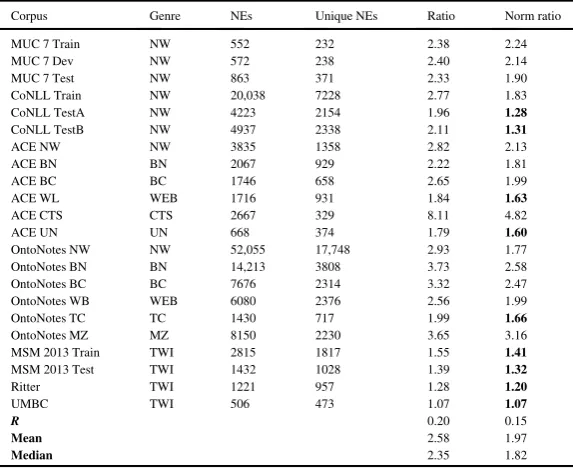
In order to compare corpus diversity across genres, we measure NE and token/type diversity (following e.g.
Palmer and Day, 1997). Note that types are the unique tokens, so the ratio can be understood as ratio of total tokens
to unique ones.Table 5shows the ratios between the number of NEs and the number of unique NEs per corpus, while
Table 6reports the token/type ratios. The lower those ratios are, the more diverse a corpus is. While token/type ratios
also include tokens which are NEs, they are a good measure of broader linguistic diversity.
TaggedP
Aside from these metrics, there are other factors which contribute to corpus diversity, including how big a corpus is and how well sampled it is, e.g. if a corpus is only about one story, it should not be surprising to see a high token/ type ratio. Therefore, by experimenting on multiple corpora, from different genres and created through different methodologies, we aim to encompass these other aspects of corpus diversity.
TaggedP
Since the original NE and token/type ratios do not account for corpus size,Tables 5and6present also the
normal-ised ratios. For those, a number of tokens equivalent to those in the corpus, e.g. 7037 for UMBC (Table 6) or,
respec-tively, a number of NEs equivalent to those in the corpus (506 for UMBC) are selected (Table 5).
TaggedP
[image:6.544.71.471.87.302.2]An easy choice of sampling method would be to sample tokens and NEs randomly. However, this would not reflect the composition of corpora appropriately. Corpora consist of several documents, tweets or blog entries, which are
Table 3
P,RandF1 of NERC with different models evaluated on different testing corpora, trained on corpora normalised by size.
Corpus Genre CRFSuite Stanford NER SENNA Average
P R F1 P R F1 P R F1 P R F1
MUC 7 Dev NW 62.95 61.3 62.11 68.94 69.06 69 55.82 65.38 60.23 62.6 65.2 63.8
MUC 7 Test NW 63.4 50.17 56.02 70.91 51.68 59.79 54.35 51.45 52.86 62.9 51.1 56.2
CoNLL TestA NW 66.63 44.62 53.45 70.31 48.1 57.12 72.22 70.75 71.48 69.7 54.5 60.7
CoNLL TestB NW 67.73 43.47 52.95 69.61 44.88 54.58 48.6 48.46 48.53 62.0 45.6 52.0
ACE NW NW 49.73 30.72 37.98 46.41 34.19 39.37 46.78 50.45 48.55 47.6 38.5 42.0
ACE BN BN 56.69 13.55 21.87 56.09 26.64 36.12 40.07 36.83 38.38 51.0 25.7 32.1
ACE BC BC 59.46 29.88 39.77 60.51 40.07 48.21 39.46 41.94 40.66 53.1 37.3 42.9
ACE WL WEB 65.48 21.65 32.54 59.52 22.57 32.73 53.07 32.94 40.65 59.4 25.7 35.3
ACE CTS TC 69.77 14.61 24.15 74.76 23.05 35.24 72.36 68 70.11 72.3 35.2 43.2
ACE UN UN 20 0.41 0.81 10.81 1.65 2.87 12.59 7.44 9.35 14.5 3.2 4.3
OntoNotes NW NW 53.48 28.42 37.11 64.03 30.45 41.28 36.84 51.56 42.97 51.5 36.8 40.5
OntoNotes BN BN 65.08 55.58 59.96 76.5 57.81 65.86 59.33 66.12 62.54 67.0 59.8 62.8
OntoNotes BC BC 49.13 30.14 37.36 55.47 36.56 44.07 36.33 50.79 42.36 47.0 39.2 41.3
OntoNotes WB WEB 50.41 22.02 30.65 57.46 28.83 38.4 51.39 48.16 49.72 53.1 33.0 39.6
OntoNotes TC TC 67.18 22.82 34.07 65.25 29.44 40.58 59.92 50 54.51 64.1 34.1 43.1
OntoNotes MZ MZ 58.15 44.1 50.16 74.59 43.84 55.22 54.19 54.64 54.41 62.3 47.5 53.3
MSM 2013 Test TWI 70.98 36.38 48.11 75.37 38.9 51.31 56.7 60.89 58.72 67.7 45.4 52.7
Ritter TWI 75.56 25.19 37.78 78.29 29.38 42.73 59.06 46.67 52.14 71.0 33.7 44.2
[image:6.544.81.459.550.680.2]UMBC TWI 47.62 10.64 17.39 62.22 14.81 23.93 33.15 31.75 32.43 47.7 19.1 24.6 Standard deviation 12.46 16.04 15.73 15.27 15.56 15.40 14.24 15.04 14.18 14.0 15.5 15.1 Macro average 58.92 30.82 38.64 63.00 35.36 44.13 49.59 49.17 48.98 57.2 38.5 43.9
Table 4
P,RandF1 of NERC with different models evaluated on different testing corpora, trained on corpora normalised by size, metrics macro averaged by genres.
Genre CRFSuite Stanford NER SENNA Average
P R F1 P R F1 P R F1 P R F1
NW 60.65 43.12 49.94 65.04 46.39 53.52 52.44 56.34 54.10 59.37 48.62 52.52
BN 60.89 34.57 40.92 66.30 42.23 50.99 49.70 51.48 50.46 58.96 42.76 47.46
BC 54.30 30.01 38.57 57.99 38.32 46.14 37.90 46.37 41.51 50.06 38.23 42.07
WEB 57.95 21.84 31.60 58.49 25.70 35.57 52.23 40.55 45.19 56.22 29.36 37.45
CTS 69.77 14.61 24.15 74.76 23.05 35.24 72.36 68.00 70.11 72.30 35.22 43.17
UN 20.00 0.41 0.81 10.81 1.65 2.87 12.59 7.44 9.35 14.47 3.17 4.34
TC 67.18 22.82 34.07 65.25 29.44 40.58 59.92 50.00 54.51 64.12 34.09 43.05
MZ 58.15 44.10 50.16 74.59 43.84 55.22 54.19 54.64 54.41 62.31 47.53 53.26
TWI 64.72 24.07 34.43 71.96 27.70 39.32 49.64 46.44 47.76 62.11 32.73 40.50
Table 5
NE/Unique NE ratios and normalised NE/Unique NE ratios of different corpora, mean and median of those values plusRcorrelation of ratios with Stanford NERF1 on original corpora.
Corpus Genre NEs Unique NEs Ratio Norm ratio
MUC 7 Train NW 552 232 2.38 2.24
MUC 7 Dev NW 572 238 2.40 2.14
MUC 7 Test NW 863 371 2.33 1.90
CoNLL Train NW 20,038 7228 2.77 1.83
CoNLL TestA NW 4223 2154 1.96 1.28
CoNLL TestB NW 4937 2338 2.11 1.31
ACE NW NW 3835 1358 2.82 2.13
ACE BN BN 2067 929 2.22 1.81
ACE BC BC 1746 658 2.65 1.99
ACE WL WEB 1716 931 1.84 1.63
ACE CTS CTS 2667 329 8.11 4.82
ACE UN UN 668 374 1.79 1.60
OntoNotes NW NW 52,055 17,748 2.93 1.77
OntoNotes BN BN 14,213 3808 3.73 2.58
OntoNotes BC BC 7676 2314 3.32 2.47
OntoNotes WB WEB 6080 2376 2.56 1.99
OntoNotes TC TC 1430 717 1.99 1.66
OntoNotes MZ MZ 8150 2230 3.65 3.16
MSM 2013 Train TWI 2815 1817 1.55 1.41
MSM 2013 Test TWI 1432 1028 1.39 1.32
Ritter TWI 1221 957 1.28 1.20
UMBC TWI 506 473 1.07 1.07
R 0.20 0.15
Mean 2.58 1.97
Median 2.35 1.82
Table 6
Token/type ratios and normalised token/type ratios of different corpora, mean and median of those values plusRcorrelation of ratios with Stanford NERF1 on original corpora.
Corpus Genre Tokens Types Ratio Norm ratio
MUC 7 Train NW 8476 2086 4.06 3.62
MUC 7 Dev NW 9117 1722 5.29 4.79
MUC 7 Test NW 12,960 2895 4.48 3.80
CoNLL Train NW 204,567 23,624 8.66 2.91
CoNLL TestA NW 34,392 7815 4.40 2.62
CoNLL TestB NW 39,474 8428 4.68 2.64
ACE NW NW 66,875 8725 7.66 3.40
ACE BN BN 66,534 7630 8.72 3.40
ACE BC BC 52,758 5913 8.92 4.40
ACE WL WEB 50,227 8529 5.89 3.12
ACE CTS CTS 58,205 3425 16.99 7.22
ACE UN UN 82,515 8480 9.73 4.49
OntoNotes NW NW 1,049,713 42,716 24.57 3.69
OntoNotes BN BN 259,347 16,803 15.43 3.77
OntoNotes BC BC 245,545 13,218 18.58 3.95
OntoNotes WB WEB 205,081 17,659 11.61 3.86
OntoNotes TC TC 110,135 5895 18.68 6.98
OntoNotes MZ MZ 197,517 15,412 12.82 3.68
MSM 2013 Train TWI 56,722 10,139 5.59 3.50
MSM 2013 Test TWI 32,295 6474 4.99 3.66
Ritter TWI 48,864 10,587 4.62 2.78
UMBC TWI 7037 3589 1.96 1.96
R 0.25 ¡0.07
Mean 9.47 3.83
[image:7.544.134.415.445.679.2]TaggedP
likely to repeat the words or NEs since they are about one story. The difference between bigger and smaller corpora is then that bigger corpora consist of more of those documents, tweets, blog entries, interviews, etc. Therefore, when we
downsample, we take the firstntokens for the token/type ratios or the firstnNEs for the NEs/Unique NEs ratios.
TaggedP
Looking at the normalised diversity metrics, the lowest NE/Unique NE ratios <D1:5 (in bold,Table 5) are
observed on the Twitter and CoNLL Test corpora. Seeing this for Twitter is not surprising since one would expect noise in social media text (e.g. spelling variations or mistakes) to also have an impact on how often the same NEs are seen. Observing this in the latter, though, is less intuitive and suggests that the CoNLL corpora are well balanced
in terms of stories. Low NE/Unique ratios (<D1:7) can also be observed for ACE WL, ACE UN and OntoNotes
TC. Similar to social media text, content from weblogs, usenet discussions and telephone conversations also contains a larger amount of noise compared to the traditionally-studied newswire genre, so this is not a surprising result.
Cor-pora bearing high NE/Unique NE ratios (>2.5) are ACE CTS, OntoNotes MZ and OntoNotes BN. These results are
also not surprising. The telephone conversations in ACE CTS are all about the same story, and newswire and broad-cast news tend to contain longer stories (reducing variety in any fixed-size set) and are more regular due to editing.
TaggedP
The token/type ratios reflect similar trends (Table 6). Low token/type ratios <D2:8 (in bold) are observed for the
Twitter corpora (Ritter and UMBC), as well as for the CoNLL Test corpus. Token/type ratios are also low (<D3:2)
for CoNLL Train and ACE WL. Interestingly, ACE UN and MSM Train and Test do not have low token/type ratios although they have low NE/Unique ratios. That is, many diverse persons, locations and organisations are mentioned
in those corpora, but similar context vocabulary is used. Token/type ratios are high (>D4:4) for MUC7 Dev, ACE
BC, ACE CTS, ACE UN and OntoNotes TC. Telephone conversations (TC) having high token/type ratios can be attributed to the high amount filler words (e.g. “uh”, “you know”). NE corpora are generally expected to have regular
language use for ACE, at least, in this instance.
TaggedP
Furthermore, it is worth pointing out that, especially for the larger corpora (e.g. OntoNotes NW), size normalisa-tion makes a big difference. The normalised NE/Unique NE ratios drop by almost a half compared to the un-normal-ised ratios, and normalun-normal-ised Token/Type ratios drop by up to 85%. This strengthens our argument for size normalisation and also poses the question of low NERC performance for diverse genres being mostly due to the lack
of large training corpora. This is examined inSection 3.2.
TaggedP
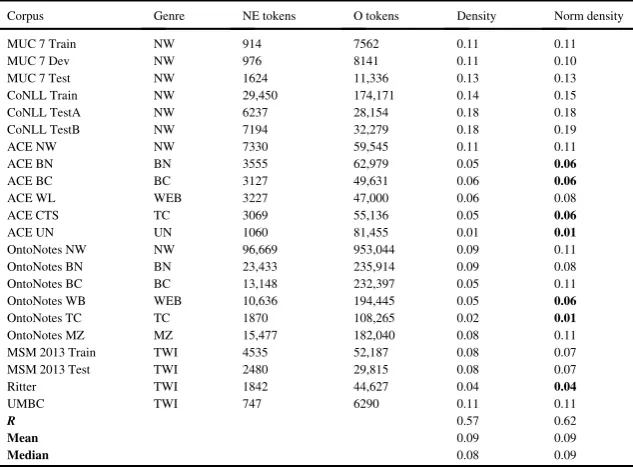
Lastly,Table 7reports tag density (percentage of tokens tagged as part of a NE), which is another useful metric of
[image:8.544.112.429.447.682.2]corpus diversity that can be interpreted as the information density of a corpus. What can be observed here is that the
Table 7
Tag density and normalised tag density, the proportion of tokens with NE tags to all tokens, mean and median of those values plusRcorrelation of density with Stanford NERF1 on original corpora.
Corpus Genre NE tokens O tokens Density Norm density
MUC 7 Train NW 914 7562 0.11 0.11
MUC 7 Dev NW 976 8141 0.11 0.10
MUC 7 Test NW 1624 11,336 0.13 0.13
CoNLL Train NW 29,450 174,171 0.14 0.15
CoNLL TestA NW 6237 28,154 0.18 0.18
CoNLL TestB NW 7194 32,279 0.18 0.19
ACE NW NW 7330 59,545 0.11 0.11
ACE BN BN 3555 62,979 0.05 0.06
ACE BC BC 3127 49,631 0.06 0.06
ACE WL WEB 3227 47,000 0.06 0.08
ACE CTS TC 3069 55,136 0.05 0.06
ACE UN UN 1060 81,455 0.01 0.01
OntoNotes NW NW 96,669 953,044 0.09 0.11
OntoNotes BN BN 23,433 235,914 0.09 0.08
OntoNotes BC BC 13,148 232,397 0.05 0.11
OntoNotes WB WEB 10,636 194,445 0.05 0.06
OntoNotes TC TC 1870 108,265 0.02 0.01
OntoNotes MZ MZ 15,477 182,040 0.08 0.11
MSM 2013 Train TWI 4535 52,187 0.08 0.07
MSM 2013 Test TWI 2480 29,815 0.08 0.07
Ritter TWI 1842 44,627 0.04 0.04
UMBC TWI 747 6290 0.11 0.11
R 0.57 0.62
Mean 0.09 0.09
TaggedP
NW corpora have the highest tag density and generally tend to have higher tag density than corpora of other genres;
that is, newswire bears a lot of entities. Corpora with especially low tag density <D0:06 (in bold) are the TC
cor-pora, Ritter, OntoNotes WB, ACE UN, ACE BN and ACE BC. As already mentioned, conversational corcor-pora, to which ACE BC also belong, tend to have many filler words, thus it is not surprising that they have a low tag density. There are only minor differences between the tag density and the normalised tag density, since corpus size as such does not impact tag density.
2.2. NER models and features
TaggedP
To avoid system-specific bias in our experiments, three widely-used supervised statistical approaches to
NER are included: Stanford NER,1 SENNA,2 and CRFSuite.3 These systems each have contrasting notable
attributes.
TaggedP
Stanford NER (Finkel et al., 2005) is the most popular of the three, deployed widely in both research and
com-merce. The system has been developed in terms of both generalising the underlying technology and also specific additions for certain languages. The majority of openly-available additions to Stanford NER, in terms of models, gazetteers, prefix/suffix handling and so on, have been created for newswire-style text. Named entity recognition
and classification is modelled as a sequence labelling task with first-order conditional random fields (CRFs) (Lafferty
et al., 2001).
TaggedP
SENNA (Collobert et al., 2011) is a more recent system for named entity extraction and other NLP tasks. Using
word representations and deep learning with deep convolutional neural networks, the general principle for SENNA is to avoid task-specific engineering while also doing well on multiple benchmarks. The approach taken to fit these desiderata is to use representations induced from large unlabelled datasets, including LM2 (introduced in the paper
itself) and Brown clusters (Brown et al., 1992; Derczynski and Chester, 2016). The outcome is a flexible system that
is readily adaptable, given training data. Although the system is more flexible in general, it relies on learning
lan-guage models from unlabelled data, which might take a long time to gather and retrain. For the setup inCollobert
et al. (2011)language models are trained for seven weeks on the English Wikipedia, Reuters RCV1 (Lewis et al.,
2004) and parts of the Wall Street Journal, and results are reported over the CoNLL 2003 NER dataset. Reuters
RCV1 is chosen as unlabelled data because the English CoNLL 2003 corpus is created from the Reuters RCV1 cor-pus. For this paper, we use the original language models distributed with SENNA and evaluate SENNA with the
DeepNL framework (Attardi, 2015). As such, it is to some degree also biased towards the CoNLL 2003 benchmark
data.
TaggedP
Finally, we use the classical NER approach from CRFsuite (Okazaki, 2007), which also uses first-order CRFs.
This frames NER as a structured sequence prediction task, using features derived directly from the training text. Unlike the other systems, no external knowledge (e.g. gazetteers and unsupervised representations) are used. This
provides a strong basic supervised system, and unlike Stanford NER and SENNA has not been tuned for any
particular domain, giving potential to reveal more challenging domains without any intrinsic bias.
TaggedP
We use the feature extractors natively distributed with the NER frameworks. For Stanford NER we use the feature set “chris2009” without distributional similarity, which has been tuned for the CoNLL 2003 data. This feature was tuned to handle OOV words through word shape, i.e. capitalisation of constituent characters. The goal is to reduce
feature sparsity the basic problem behind OOV named entities by reducing the complexity of word shapes for
long words, while retaining word shape resolution for shorter words. In addition, word clusters, neighbouring
n-grams, label sequences and quasi-Newton minima search are included.4SENNA uses word embedding features and
gazetteer features; for the training configuration see https://github.com/attardi/deepnl#benchmarks. Finally, for
CRFSuite, we use the provided feature extractor without POS or chunking features, which leaves unigram and bigram word features of the mention and in a window of 2 to the left and the right of the mention, character shape, prefixes and suffixes of tokens.
1
http://nlp.stanford.edu/projects/project-ner.shtml.
2
https://github.com/attardi/deepnl.
3https://github.com/chokkan/crfsuite/blob/master/example/ner.py.
4For further details, see the official feature mnemonic list athttps://github.com/stanfordnlp/CoreNLP/blob/master/scripts/ner/english.conll.
TaggedP
These systems are compared against a simple surface form memorisation tagger. The memorisation baseline picks the most frequent NE label for each token sequence as observed in the training corpus. There are two kinds of ambi-guity: one is overlapping sequences, e.g. if both “New York City” and “New York” are memorised as a location. In that case the longest-matching sequence is labelled with the corresponding NE class. The second, class ambiguity, occurs when the same textual label refers to different NE classes, e.g. “Google” could either refer to the name of a company, in which case it would be labelled as ORG, or to the company’s search engine, which would be labelled as O (no NE).
3. Experiments
3.1. RQ1: NER performance with different approaches
TaggedP
Our first research question is how NERC performance differs for corpora between approaches. In order to answer
this, Precision (P), Recall (R) andF1 metrics are reported on size-normalised corpora (Table 3) and original corpora
(Tables 8and9). The reason for size normalisation is to make results comparable across corpora. For size
normalisa-tion, the training corpora are downsampled to include the same number of NEs as the smallest corpus, UMBC. For that, sentences are selected from the beginning of the train part of the corpora so that they include the same number
of NEs as UMBC. Other ways of downsampling the corpora would be to select the firstnsentences or the firstn
tokens, wherenis the number of sentences in the smallest corpus. The reason that the number of NEs, which
repre-sent the number of positive training examples, is chosen for downsampling the corpora is that the number of positive training examples have a much bigger impact on learning than the number of negative training examples. For
instance, Forman and Cohen (2004), among others, study topic classification performance for small corpora and
sample from the Reuters corpus. They find that adding more negative training data gives little to no improvement, whereas adding positive examples drastically improves performance.
TaggedP
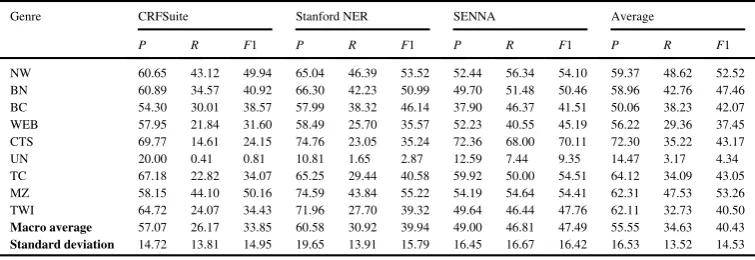
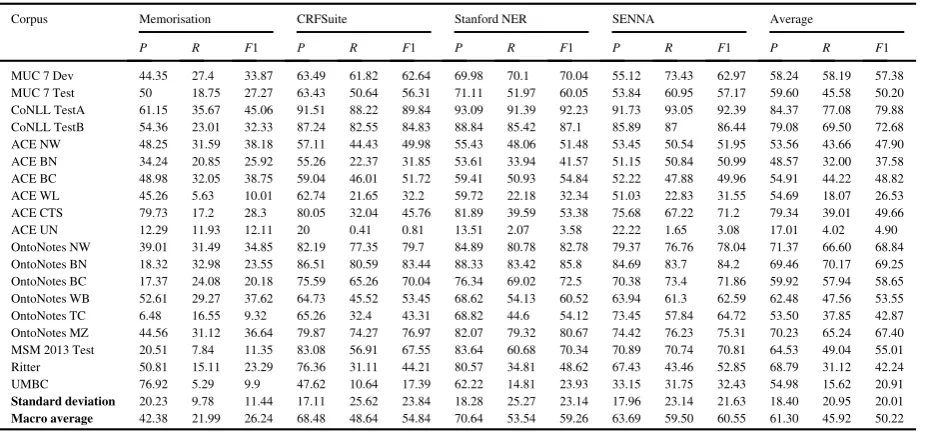
Table 3shows results with size normalised precision (P), recall (R), andF1-Score (F1). The five lowestP,Rand
F1 values per method (CRFSuite, Stanford NER, SENNA) are in bold to highlight underperformers. Results for all
corpora are summed with macro average.
TaggedP
Comparing the different methods, the highestF1 results are achieved with SENNA, followed by Stanford NER
and CRFSuite. SENNA has a balancedPandR, which can be explained by the use of word embeddings as features,
[image:10.544.41.504.463.679.2]which help with the unseen word problem. For Stanford NER as well as CRFSuite, which do not make use of
Table 8
P,RandF1 of NERC with different models trained on original corpora.
Corpus Memorisation CRFSuite Stanford NER SENNA Average
P R F1 P R F1 P R F1 P R F1 P R F1
MUC 7 Dev 44.35 27.4 33.87 63.49 61.82 62.64 69.98 70.1 70.04 55.12 73.43 62.97 58.24 58.19 57.38
MUC 7 Test 50 18.75 27.27 63.43 50.64 56.31 71.11 51.97 60.05 53.84 60.95 57.17 59.60 45.58 50.20
CoNLL TestA 61.15 35.67 45.06 91.51 88.22 89.84 93.09 91.39 92.23 91.73 93.05 92.39 84.37 77.08 79.88
CoNLL TestB 54.36 23.01 32.33 87.24 82.55 84.83 88.84 85.42 87.1 85.89 87 86.44 79.08 69.50 72.68
ACE NW 48.25 31.59 38.18 57.11 44.43 49.98 55.43 48.06 51.48 53.45 50.54 51.95 53.56 43.66 47.90
ACE BN 34.24 20.85 25.92 55.26 22.37 31.85 53.61 33.94 41.57 51.15 50.84 50.99 48.57 32.00 37.58
ACE BC 48.98 32.05 38.75 59.04 46.01 51.72 59.41 50.93 54.84 52.22 47.88 49.96 54.91 44.22 48.82
ACE WL 45.26 5.63 10.01 62.74 21.65 32.2 59.72 22.18 32.34 51.03 22.83 31.55 54.69 18.07 26.53
ACE CTS 79.73 17.2 28.3 80.05 32.04 45.76 81.89 39.59 53.38 75.68 67.22 71.2 79.34 39.01 49.66
ACE UN 12.29 11.93 12.11 20 0.41 0.81 13.51 2.07 3.58 22.22 1.65 3.08 17.01 4.02 4.90
OntoNotes NW 39.01 31.49 34.85 82.19 77.35 79.7 84.89 80.78 82.78 79.37 76.76 78.04 71.37 66.60 68.84
OntoNotes BN 18.32 32.98 23.55 86.51 80.59 83.44 88.33 83.42 85.8 84.69 83.7 84.2 69.46 70.17 69.25
OntoNotes BC 17.37 24.08 20.18 75.59 65.26 70.04 76.34 69.02 72.5 70.38 73.4 71.86 59.92 57.94 58.65
OntoNotes WB 52.61 29.27 37.62 64.73 45.52 53.45 68.62 54.13 60.52 63.94 61.3 62.59 62.48 47.56 53.55
OntoNotes TC 6.48 16.55 9.32 65.26 32.4 43.31 68.82 44.6 54.12 73.45 57.84 64.72 53.50 37.85 42.87
OntoNotes MZ 44.56 31.12 36.64 79.87 74.27 76.97 82.07 79.32 80.67 74.42 76.23 75.31 70.23 65.24 67.40
MSM 2013 Test 20.51 7.84 11.35 83.08 56.91 67.55 83.64 60.68 70.34 70.89 70.74 70.81 64.53 49.04 55.01
Ritter 50.81 15.11 23.29 76.36 31.11 44.21 80.57 34.81 48.62 67.43 43.46 52.85 68.79 31.12 42.24
UMBC 76.92 5.29 9.9 47.62 10.64 17.39 62.22 14.81 23.93 33.15 31.75 32.43 54.98 15.62 20.91
TaggedP
embeddings, recall is about half of precision. These findings are in line with other work reporting the usefulness of
word embeddings and deep learning for a variety of NLP tasks and domains (Socher et al., 2011; Glorot et al., 2011;
Bengio, 2012). With respect to individual corpora, the ones where SENNA outperforms other methods by a large
margin (>D13 points inF1) are CoNLL Test A, ACE CTS and OntoNotes TC. The first success can be attributed to
being from the same the domain SENNA was originally tuned for. The second is more unexpected and could be due to those corpora containing a disproportional amount of PER and LOC NEs (which are easier to tag correctly)
com-pared to ORG NEs, as can be seen inTable 9, whereF1 of NERC methods is reported on the original training data.
TaggedP
Our analysis of CRFSuite here is that it is less tuned for NW corpora and might therefore have a more balanced performance across genres does not hold. Results with CRFSuite for every corpus are worse than the results for that corpus with Stanford NER, which is also CRF-based.
TaggedP
To summarise, our findings are:
TaggedP
F1 is highest with SENNA, followed by Stanford NER and CRFSuite.
TaggedP
SENNA outperforms other methods by a large margin (e.g. >D13 points inF1) for CoNLL Test A, ACE CTS
and OntoNotes TC.
TaggedP
Our hypothesis that CRFSuite is less tuned for NW corpora and will therefore have a more balanced performance
across genres does not hold, as results for CRFSuite for every corpus are worse than with Stanford NER.
3.2. RQ2: NER performance in different genres
TaggedP
Our second research question is whether existing NER approaches generalise well over corpora in different
genres. To do this we study again Precision (P), Recall (R) and F1 metrics on size-normalised corpora
(Table 3), on original corpora (Tables 8 and9), and we further test performance per genre in a separate table
(Table 4).
TaggedP
F1 scores over size-normalised corpora vary widely (Table 13). For example, the SENNA scores range from
9.35%F1 (ACE UN) to 71.48% (CoNLL Test A). Lowest results are consistently observed for the ACE subcorpora,
UMBC, and OntoNotes BC and WB. The ACE corpora are large and so may be more prone to non-uniformities emerging during downsampling; they also have special rules for some kinds of organisation which can skew results
[image:11.544.46.505.87.302.2](as described inSection 2.1.1). The highest results are on the CoNLL Test A corpus, OntoNotes BN and MUC 7
Table 9
F1 per NE type with different models trained on original corpora.
Corpus Memorisation CRFSuite Stanford NER SENNA Average
PER LOC ORG PER LOC ORG PER LOC ORG PER LOC ORG PER LOC ORG
MUC 7 Dev 3.67 28.3 43.87 58.54 63.83 63.03 57.61 75.44 70.44 60.83 62.99 63.8 45.16 57.64 60.29
MUC 7 Test 16.77 51.15 9.56 52.87 59.79 55.33 61.09 72.8 50.42 79.08 61.38 47.4 52.45 61.28 40.68
CoNLL TestA 34.88 49.11 55.66 92 91.92 84 94.31 93.85 87.09 95.14 94.65 85.55 79.08 82.38 78.08
CoNLL TestB 12.8 40.52 41.71 87.45 87.09 79.78 90.47 89.21 81.45 91.42 89.35 78.78 70.54 76.54 70.43
ACE NW 0 52.12 0 37.47 57.35 33.89 39.92 58.46 38.84 49.72 57.89 30.99 31.78 56.46 25.93
ACE BN 13.37 41.26 18 35.58 35.36 14.81 45.86 41.56 31.09 55.74 55.02 26.73 37.64 43.30 22.66
ACE BC 0 62.64 0 44.32 64.07 23.19 49.34 65.24 30.77 44.98 61.81 18.92 34.66 63.44 18.22
ACE WL 1.44 33.06 0 39.01 37.5 10.97 37.41 42.91 7.96 37.75 40.15 5.96 28.90 38.41 6.22
ACE CTS 18.62 63.77 0 46.28 46.64 0 52.67 60.56 0 75.31 47.35 26.09 48.22 54.58 6.52
ACE UN 0 14.92 7.55 3.08 0 0 0 6.17 0 5.48 2.78 0 2.14 5.97 1.89
OntoNotes NW 20.85 55.67 14.85 84.75 82.39 74.82 86.39 85.62 78.47 80.82 85.71 69.08 68.20 77.35 59.31
OntoNotes BN 15.37 27.52 12.59 88.67 86.4 66.64 90.98 88.88 68.78 90.06 87.46 66.24 71.27 72.57 53.56
OntoNotes BC 10.92 24.89 10.9 69.13 79.28 52.26 75.54 79.04 54.48 74.13 81.02 50.98 57.43 66.06 42.16
OntoNotes WB 26.2 54.86 5.71 50.17 67.76 22.33 60.28 72.05 30.21 66.63 73.15 31.03 50.82 66.96 22.32
OntoNotes TC 19.67 7.71 0 40.68 50.38 8.16 54.24 58.43 18.87 67.06 68.39 7.84 45.41 46.23 8.72
OntoNotes MZ 21.39 58.76 4.55 83.49 80.44 52.86 86.44 84.65 56.88 83.92 78.06 48.25 68.81 75.48 40.64
MSM 2013 Test 4.62 44.71 26.14 75.9 43.75 24.14 78.46 42.77 31.37 81.04 45.42 28.12 60.01 44.16 27.44
Ritter 15.54 35.11 20.13 43.19 54.08 33.54 48.65 57 37.97 63.64 61.47 22.22 42.76 51.92 28.47
UMBC 5.97 22.22 0 8.33 32.61 6.06 25.32 39.08 2.94 33.12 52.1 6.38 18.19 36.50 3.85
TaggedP
Dev. This moderately supports our hypothesis that NER systems perform better on NW than on other genres, proba-bly due to extra fitting from many researchers using them as benchmarks for tuning their approaches. Looking at the Twitter (TWI) corpora present the most challenge due to increased diversity, the trends are unstable. Although results for UMBC are among the lowest, results for MSM 2013 and Ritter are in the same range or even higher than those on NW datasets. This begs the question whether low results for Twitter corpora reported previously were due to the lack of sufficient in-genre training data.
TaggedP
Comparing results on normalised to non-normalised data, Twitter results are lower than those for most OntoNotes corpora and CoNLL test corpora, mostly due to low recall. Other difficult corpora having low performance are ACE UN and WEB corpora. We further explicitly examine results on size normalised corpora grouped by corpus type,
shown inTable 4. It becomes clear that, on average, newswire corpora and OntoNotes MZ are the easiest corpora
and ACE UN, WEB and TWI are the hardest. This confirms our hypothesis that social media and Web corpora are challenging for NERC.
TaggedP
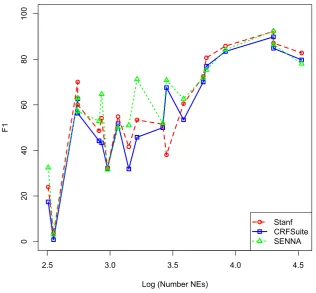
The CoNLL results, on the other hand, are the highest across all corpora irrespective of the NERC method. What is very interesting to see is that they are much higher than the results on the biggest training corpus, OntoNotes NW.
For instance, SENNA has anF1 of 78.04 on OntoNotes, compared to anF1 of 92.39 and 86.44 for CoNLL Test A
and Test B respectively. So even though OntoNotes NW is more than twice the size of CoNLL in terms of NEs (see
Table 5), NERC performance is much higher on CoNLL. NERC performance with respect to training corpus size is
represented inFig. 1. The latter figure confirms that although there is some correlation between corpus size andF1,
the variance between results on comparably sized corpora is big. This strengthens our argument that there is a need for experimental studies, such as those reported below, to find out what, apart from corpus size, impacts NERC per-formance.
TaggedP
Another set of results presented in Table 8 are those of the simple NERC memorisation baseline. It can be
observed that corpora with a lowF1 for NERC methods, such as UMBC and ACE UN, also have a low
memorisa-tion performance. Memorisamemorisa-tion is discussed in more depth inSection 3.5.
2.5 3.0 3.5 4.0 4.5
02
0
4
0
6
0
80
100
Log (Number NEs)
F1
[image:12.544.113.430.373.666.2]Stanf CRFSuite SENNA
TaggedP
When NERC results are compared to the corpus diversity statistics, i.e. NE/Unique NE ratios (Table 5), token/
type ratios (Table 6), and tag density (Table 7), the strongest predictor forF1 is tag density, as can be evidenced by
theRcorrelation values between the ratios andF1 scores with the Stanford NER system, shown in the respective
tables.
TaggedP
There is a positive correlation between highF1 and high tag density (Rof 0.57 andRof 0.62 with normalised tag
density), a weak positive correlation for NE/unique ratios (Rof 0.20 andRof 0.15 for normalised ratio), whereas
for token/type ratios, no such clear correlation can be observed (Rof 0.25 andRof¡0.07 for normalised ratio).
TaggedP
However, tag density is also not an absolute predictor for NERC performance. While NW corpora have both high NERC performance and high tag density, corpora of other genres with high tag density not not necessarily so easy.
TaggedP
One factor that can explain the difference in genre performance between e.g. newswire and social media is entity drift. In this case, it is evident from the differing surface forms and contexts for a given entity class. For example, the concept of “location” that NER systems try to learn might be frequently represented in
English newswire from 1991 with terms like Iraqor Kuwait, but more with Atlanta, Bosnia and Kabul in the
same language and genre from 1996. Informally, drift on Twitter is often characterised as both high-frequency and high-magnitude; that is, the changes are both rapid and correspond to a large amount of surface form
occurrences (e.g.Fromreide et al., 2014; Derczynski et al., 2015).
TaggedP
We examined the impact of drift in newswire and Twitter corpora. To do this, we used just the surface lexicalisa-tions of entities as the entity representation. The overlap of surface forms was measured across different corpora of
the same genre and language. We used an additional corpus based on recent data that from the W-NUT 2015
chal-lenge (Baldwin et al., 2015). This is measured in terms of occurrences, rather than distinct surface forms, so that the
[image:13.544.124.426.493.562.2]magnitude of the drift is shown instead of having skew in results from the the noisy long tail. Results are given in
Table 10for newswire andTable 11for Twitter corpora.
TaggedP
It is evident that the within-class commonalities in surface forms are much higher in newswire than in Twitter. That is to say, observations of entity texts in one newswire corpus are more helpful in labelling other newswire cor-pora, than if the same technique is used to label other twitter corpora.
TaggedP
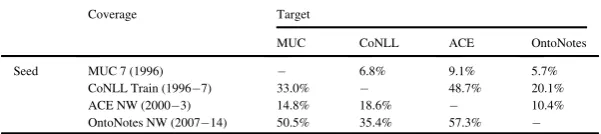
This indicates that drift is lower in newswire than in tweets. Certainly, the proportion of entity mentions in most recent corpora (the rightmost-columns) are consistently low compared to entity forms available in earlier data. These
reflect the raised OOV and drift rates found inFromreide et al. (2014). Another explanation is that there is higher
noise in variation, and that the drift is not longitudinal, but rather general. This is partially addressed by RQ3, which
we will address next, inSection 3.3.
TaggedP
To summarise, our findings are:
TaggedP
Overall,F1 scores vary widely across corpora.
Table 10
Entity surface form occurrence overlap between Twitter corpora.
Coverage Target
Ritter UMBC MSM W-NUT
Seed Ritter (2010) 9.3% 14.3% 11.1%
UMBC (2011) 5.0% 6.1% 3.0%
MSM 2013 Train 16.2% 12.1% 10.4%
[image:13.544.124.425.611.678.2]W-NUT (2015) 5.3% 3.2% 2.6%
Table 11
Entity surface form occurrence overlap between news corpora.
Coverage Target
MUC CoNLL ACE OntoNotes
Seed MUC 7 (1996) 6.8% 9.1% 5.7%
CoNLL Train (1996 7) 33.0% 48.7% 20.1%
ACE NW (2000 3) 14.8% 18.6% 10.4%
TaggedP
Trends can be marked in some genres. On average, newswire corpora and OntoNotes MZ are the easiest corpora
and ACE UN, WEB and TWI are the hardest corpora for NER methods to reach good performance on.
TaggedP
Normalising corpora by size results in more noisy data such as TWI and WEB data achieving similar results to
NW corpora.
TaggedP
Increasing the amount of available in-domain training data will likely result in improved NERC performance.
TaggedP
There is a strong positive correlation between highF1 and high tag density, a weak positive correlation for NE/
unique ratios and no clear correlation between token/type ratios andF1.
TaggedP
NE drift is lower in newswire than in tweets.
TaggedP
The next section will take a closer look at the impact of seen and unseen NEs on NER performance.
3.3. RQ3: impact of NE diversity
TaggedP
UnseenNEs are those with surface forms present only in the test, but not training data, whereas seenNEs are
those also encountered in the training data. As discussed previously, the ratio between those two measures is an indi-cator of corpus NE diversity.
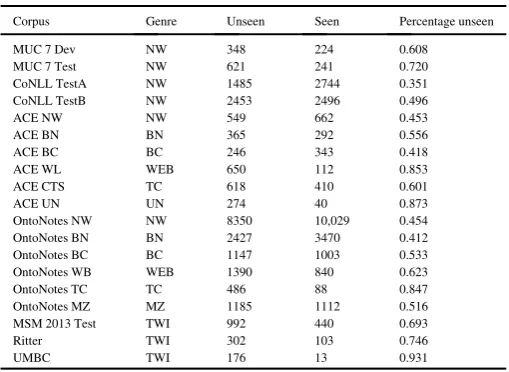
[image:14.544.143.398.455.641.2]TaggedP
Table 12shows how the number of unseen NEs per test corpus relates to the total number of NEs per corpus. The
proportion of unseen forms varies widely by corpus, ranging from 0.351 (ACE NW) to 0.931 (UMBC). As expected there is a correlation between corpus size and percentage of unseen NEs, i.e. smaller corpora such as MUC and UMBC tend to contain a larger proportion of unseen NEs than bigger corpora such as ACE NW. In addition, similar
to the token/type ratios listed inTable 6, we observe that TWI and WEB corpora have a higher proportion of unseen
entities.
TaggedP
As can be seen fromTable 8, corpora with a low percentage of unseen NEs (e.g. CoNLL Test A and OntoNotes
NW) tend to have high NERC performance, whereas corpora with high percentage of unseen NEs (e.g. UMBC) tend to have low NERC performance. This suggests that systems struggle to recognise and classify unseen NEs correctly.
TaggedP
To check this seen/unseen performance split, next we examine NERC performance for unseen and seen NEs
sepa-rately; results are given in Table 13. The “All” column group represents an averaged performance result. What
becomes clear from the macro averages5is thatF1 on unseen NEs is significantly lower thanF1 on seen NEs for all
three NERC approaches. This is mostly due to recall on unseen NEs being lower than that on seen NEs, and suggests some memorisation and poor generalisation in existing systems. In particular, Stanford NER and CRFSuite have
Table 12
Proportion of unseen entities in different test corpora.
Corpus Genre Unseen Seen Percentage unseen
MUC 7 Dev NW 348 224 0.608
MUC 7 Test NW 621 241 0.720
CoNLL TestA NW 1485 2744 0.351
CoNLL TestB NW 2453 2496 0.496
ACE NW NW 549 662 0.453
ACE BN BN 365 292 0.556
ACE BC BC 246 343 0.418
ACE WL WEB 650 112 0.853
ACE CTS TC 618 410 0.601
ACE UN UN 274 40 0.873
OntoNotes NW NW 8350 10,029 0.454
OntoNotes BN BN 2427 3470 0.412
OntoNotes BC BC 1147 1003 0.533
OntoNotes WB WEB 1390 840 0.623
OntoNotes TC TC 486 88 0.847
OntoNotes MZ MZ 1185 1112 0.516
MSM 2013 Test TWI 992 440 0.693
Ritter TWI 302 103 0.746
UMBC TWI 176 13 0.931
TaggedP
almost 50% lower recall on unseen NEs compared to seen NEs. One outlier is ACE UN, for which the average seen
F1 is 1.01 and the average unseenF1 is 1.52, though both are miniscule and the different negligible.
TaggedP
Of the three approaches, SENNA exhibits the narrowestF1 difference between seen and unseen NEs. In fact
underperforms Stanford NER for seen NEs on many corpora. This may be because SENNA has but a few features, based on word embeddings, which reduces feature sparsity; intuitively, the simplicity of the representation is likely to help with unseen NEs, at the cost of slightly reduced performance on seen NEs through slower fitting. Although SENNA appears to be better at generalising than Stanford NER and our CRFSuite baseline, the difference between its performance on seen NEs and unseen NEs is still noticeable. This is 21.77 for SENNA (macro average), whereas it is 29.41 for CRFSuite and 35.68 for Stanford NER.
TaggedP
The fact that performance over unseen entities is significantly lower than on seen NEs partly explains what we observed in the previous section; i.e., that corpora with a high proportion of unseen entities, such as the ACE WL corpus, are harder to label than corpora of a similar size from other genres, such as the ACE BC corpus (e.g. systems
reachF1 of»30 compared to»50;Table 8).
TaggedP
[image:15.544.76.477.87.466.2]However, even though performance on seen NEs is higher than on unseen, there is also a difference between seen NEs in corpora of different sizes and genres. For instance, performance on seen NEs in ACE WL is 70.86 (averaged over the three different approaches), whereas performance on seen NEs in the less-diverse ACE BC corpus is higher
Table 13
P,RandF1 of NERC with different models of unseen and seen NEs.
CRFSuite Stanf SENNA All
P R F1 P R F1 P R F1 P R F1
MUC 7 Dev Seen 96.00 85.71 90.57 98.65 98.21 98.43 90.48 93.3 91.87 95.04 92.41 93.62
Unseen 65.22 47.41 54.91 75.31 52.59 61.93 59.54 60.06 59.8 66.69 53.35 58.88
MUC 7 Test Seen 87.02 74.79 80.44 97.81 92.53 95.10 82.81 87.6 85.14 89.21 84.97 86.89
Unseen 59.95 41.22 48.85 61.93 37.2 46.48 51.57 50.24 50.9 57.82 42.89 48.74
CoNLL TestA Seen 96.79 94.46 95.61 97.87 97.34 97.61 97.34 96.55 96.94 97.33 96.12 96.72
Unseen 86.34 79.19 82.61 87.85 81.82 84.73 95.32 92.43 93.85 89.84 84.48 87.06
CoNLL TestB Seen 93.70 89.98 91.80 96.07 94.07 95.06 94.3 91.77 93.02 94.69 91.94 93.29
Unseen 85.71 76.76 80.99 86.76 79.05 82.72 91.69 87.32 89.46 88.05 81.04 84.39
ACE NW Seen 97.28 64.80 77.79 96.05 69.79 80.84 93.3 63.14 75.32 95.54 65.91 77.98
Unseen 57.48 22.40 32.24 56.05 25.32 34.88 63.49 36.43 46.3 59.01 28.05 37.81
ACE BN Seen 93.65 40.41 56.46 94.29 67.81 78.88 91.32 68.49 78.28 93.09 58.90 71.21
Unseen 66.04 9.59 16.75 47.44 10.14 16.7 71.57 40 51.32 61.68 19.91 28.26
ACE BC Seen 90.76 65.89 76.35 91.01 70.85 79.67 88.11 62.68 73.25 89.96 66.47 76.42
Unseen 62.82 19.92 30.25 62.89 24.8 35.57 57.5 28.05 37.7 61.07 24.26 34.51
ACE WL Seen 89.47 60.71 72.34 96.67 77.68 86.14 91.49 38.39 54.09 92.54 58.93 70.86
Unseen 75.76 15.38 25.58 61.03 12.77 21.12 62.21 20.77 31.14 66.33 16.31 25.95
ACE CTS Seen 97.38 45.37 61.90 98.48 63.17 76.97 96.35 64.39 77.19 97.40 57.64 72.02
Unseen 95.42 23.66 37.92 92.55 24.11 38.25 96.43 69.9 81.05 94.80 39.22 52.41
ACE UN Seen 0.00 0.00 0.00 0 0 0 100 1.53 3.02 33.33 0.51 1.01
Unseen 100.00 0.51 1.02 62.5 1.82 3.55 0 0 0 54.17 0.78 1.52
OntoNotes NW Seen 95.18 90.44 92.75 96.88 93.98 95.4 73.12 65.76 69.24 88.39 83.39 85.80
Unseen 73.43 63.00 67.81 76.17 65.8 70.6 96.88 93.98 95.4 82.16 74.26 77.94
OntoNotes BN Seen 95.60 90.86 93.17 96.75 94.5 95.61 81.76 73.34 77.32 91.37 86.23 88.70
Unseen 82.67 67.24 74.16 83.45 68.97 75.52 96.75 94.5 95.61 87.62 76.90 81.76
OntoNotes BC Seen 95.29 88.83 91.95 93.85 88.24 90.96 64.27 59.11 61.58 84.47 78.73 81.50
Unseen 70.91 47.60 56.96 74.82 55.19 63.52 93.85 88.24 90.96 79.86 63.68 70.48
OntoNotes WB Seen 91.96 81.57 86.45 94.01 89.64 91.77 63.75 47.73 54.59 83.24 72.98 77.60
Unseen 58.97 26.49 36.56 64.86 34.39 44.95 94.01 89.64 91.77 72.61 50.17 57.76
OntoNotes TC Seen 94.03 56.25 70.39 94.81 82.95 88.48 80.2 51.73 62.89 89.68 63.64 73.92
Unseen 70.79 27.27 39.38 74.8 37.86 50.27 94.81 82.95 88.48 80.13 49.36 59.38
OntoNotes MZ Seen 95.24 88.89 91.95 99.09 97.75 98.42 71.31 62.86 66.82 88.55 83.17 85.73
Unseen 75.44 57.95 65.55 80.23 64.05 71.23 99.09 97.75 98.42 84.92 73.25 78.40
MSM 2013 Test Seen 92.40 69.09 79.06 91.73 78.18 84.42 84.22 69.96 76.43 89.45 72.41 79.97
Unseen 87.21 52.22 65.32 87.08 54.33 66.91 91.73 78.18 84.42 88.67 61.58 72.22
Ritter Seen 100.00 65.05 78.82 98.8 79.61 88.17 100 68.93 81.61 99.60 71.20 82.87
Unseen 79.73 19.54 31.38 76.62 19.54 31.13 78.17 36.75 50 78.17 25.28 37.50
UMBC Seen 100.00 23.08 37.50 100 53.85 70 90 69.23 78.26 96.67 48.72 61.92
Unseen 59.38 10.86 18.36 66.67 12.5 21.05 52.78 32.39 40.14 59.61 18.58 26.52
Macro average Seen 89.57 67.17 75.02 91.20 78.43 83.79 92.99 74.38 79.85 91.25 73.32 79.55
TaggedP
at 76.42; the less diverse data is, on average, easier to tag. Interestingly, averageF1 on seen NEs in the Twitter
cor-pora (MSM and Ritter) is around 80, whereas averageF1 on the ACE corpora, which are of similar size, is lower, at
around 70.
TaggedP
To summarise, our findings are:
TaggedP
F1 on unseen NEs is significantly lower thanF1 on seen NEs for all three NERC approaches, which is mostly due
to recall on unseen NEs being lower than that on seen NEs.
TaggedP
Performance on seen NEs is significantly and consistently higher than that of unseen NEs in different corpora,
with the lower scores mostly attributable to lower recall.
TaggedP
However, there are still significant differences at labelling seen NEs in different corpora, which means that if NEs
are seen or unseen does not account for all of the difference ofF1 between corpora of different genres.
3.4. RQ4: unseen features, unseen NEs and NER performance
TaggedP
Having examined the impact of seen/unseen NEs on NERC performance in RQ3, and touched upon surface form drift in RQ2, we now turn our attention towards establishing the impact of seen features, i.e. features appearing in
the test set that are observed also in the training set. While feature sparsity can help to explain lowF1, it is not a
good predictor of performance across methods: sparse features can be good if mixed with high-frequency ones. For
instance, Stanford NER often outperforms CRFSuite (seeTable 8) despite having a lower proportion of seen features
(i.e. those that occur both in test data and during training). Also, some approaches such as SENNA use a small num-ber of features and base their features almost entirely on the NEs and not on their context.
TaggedP
Subsequently, we want to measure F1 for unseens and seen NEs, as in Section 3.3, but also examine how
the proportion of seen features impacts on the result. We define seen features as those observed in the test
data and also the training data. In turn, unseen features are those observed in the test data but not in the
train-ing data. That is, they have not been previously encountered by the system at the time of labelltrain-ing. Unseen features are different from unseen words in that they are the difference in representation, not surface form. For example, the entity “Xoxarle” may be an unseen entity not found in training data This entity could rea-sonably have “shape:Xxxxxxx” and “last-letter:e” as part of its feature representation. If the training data con-tains entities “Kenneth” and “Simone”, each of this will have generated these two features respectively. Thus, these example features will not be unseen features in this case, despite coming from an unseen entity.
Con-versely, continuing this example, if the training data contains no feature “first-letter:X” which applies to
the unseen entity in question then thiswill be an unseen feature.
TaggedP
We therefore measure the proportion of unseen features per unseen and seen proportion of different corpora. An
analysis of this with Stanford NER is shown inFig. 2. Each data point represents a corpus. The blue squares are data
points for seen NEs and the red circles are data points for unseen NEs. The figure shows a negative correlation
betweenF1 and percentage of unseen features, i.e. the lower the percentage of seen features, the higher theF1. Seen
and unseen performance and features separate into two groups, with only two outlier points. The figure shows that
novel, previously unseen NEs have more unseen features and that systems score a lowerF1 on them. However, one
would expect individual features to give different generalisation power for other sets of entities, and for systems use these features in different ways. That is, machine learning approaches to the NER task do not seem to learn clear-cut decision boundaries based on a small set of features. This is reflected in the softness of the correlation.
TaggedP
Finally, the proportion of seen features is higher for seen NEs. The two outlier points are ACE UN (lowF1 for
seen NEs despite low percentage of unseen features) and UMBC (highF1 for seen NEs despite high percentage of
unseen features). An error analysis shows that the ACE UN corpus suffers from the problem that the seen NEs are ambiguous, meaning even if they have been seen in the training corpus, a majority of the time they have been observed with a different NE label. For the UMBC corpus, the opposite is true: seen NEs are unambiguous. This kind of metonymy is a known and challenging issue in NER, and the results on these corpora highlight the impact is still has on modern systems.
TaggedP
For all approaches the proportion of observed features for seen NEs is bigger than the proportion of observed fea-tures for unseen NEs, as it should be. However, within the seen and unseen testing instances, there is no clear trend
TaggedP
that the smaller the token/type ratio is (Table 6), the bigger the variance between the smallest and biggestnfor each
corpus, or, in other words, the smaller the token/type ratio is, the more diverse the features.
TaggedP
To summarise, our findings are:
TaggedP
Seen NEs have more unseen features and systems score a lowerF1 on them.
TaggedP
Outliers are due to low/high ambiguity of seen NEs.
TaggedP
The proportion of observed features for seen NEs is bigger than the proportion of observed features for unseen
NEs.
TaggedP
Within the seen and unseen testing instances, there is no clear trend indicating whether having more observed
fea-tures overall increasesF1 performance.
TaggedP
The smaller the token/type ratio is, the more diverse the features.
3.5. RQ5: out-of-domain NER performance and memorisation
TaggedP
This section explores baseline out-of-domain NERC performance without domain adaptation; what percentage of NEs are seen if there is a difference between the the training and the testing domains; and how the difference in per-formance on unseen and seen NEs compares to in-domain perper-formance.
TaggedP
As demonstrated by the above experiments, and in line with related work, NERC performance varies across domains while also being influenced by the size of the available in-domain training data. Prior work on transfer
learning and domain adaptation (e.g.Daume, 2007) has aimed at increasing performance in domains where only
small amounts of training data are available. This is achieved by adding out-of domain data from domains where larger amounts of training data exist. For domain adaptation to be successful, however, the seed domain needs to be similar to the target domain, i.e. if there is no or very little overlap in terms of contexts of the training and testing
0.05 0.10 0.15 0.20 0.25
02
0
4
0
6
0
80
100
% Features Unseen
F1
[image:17.544.119.432.50.344.2]Seen NEs Unseen NEs
TaggedP
instances, the model does not learn any additional helpful weights. As a confounding factor, Twitter and other social
media generally consist of many (thousands-millions) of micro-domains, with each author (Gella et al., 2014)
com-munity (Yang and Eisenstein, 2017) and even conversation (Pavalanathan and Eisenstein, 2015) having its own
style, which makes it hard to adapt to it as a single, monolithic genre; accordingly, adding out-of-domain NER data
gives bad results in this situation (Ritter et al., 2011). And even if recognised perfectly, entities that occur just once
cause problems beyond NER, e.g. in co-reference (Recasens et al., 2013).
TaggedP
In particular,Sutton and McCallum (2005)has reported improvingF1 by around 6% through adaptation from the
CoNLL to the ACE dataset. However, transfer learning becomes more difficult if the target domain is very noisy or,
as mentioned already, too different from the seed domain. For example, Locke and Martin (2009)unsuccessfully
tried to adapt the CoNLL 2003 corpus to a Twitter corpus spanning several topics. They found that hand-annotating a Twitter corpus consisting of 24,000 tokens performs better on new Twitter data than their transfer learning efforts with the CoNLL 2003 corpus.
TaggedP
The seed domain for the experiments here is newswire, where we use the classifier trained on the biggest NW cor-pus investigated in this study, i.e. OntoNotes NW. That classifier is then applied to all other corpora. The rationale is to test how suitable such a big corpus would be for improving Twitter NER, for which only small training corpora are available.
TaggedP
Results for out-of-domain performance are reported inTable 14. The highestF1 performance is on the OntoNotes
BC corpus, with similar results to the in-domain task. This is unsurprising as it belongs to a similar domain as the training corpus (broadcast conversation) the data was collected in the same time period, and it was annotated using the same guidelines. In contrast, out-of-domain results are much lower than in-domain results for the CoNLL cor-pora, even though they belong to the same genre as OntoNotes NW. Memorisation recall performance on CoNLL TestA and TestB with OntoNotes NW test suggest that this is partly due to the relatively low overlap in NEs between the two datasets. This could be attributed to the CoNLL corpus having been collected in a different time period to the
OntoNotes corpus, when other entities were popular in the news; an example of drift (Masud et al., 2010).
Con-versely, Stanford NER does better on these corpora than it does on other news data, e.g. ACE NW. This indicates that Stanford NER is capable of some degree of generalisation and can detect novel entity surface forms; however, recall is still lower than precision here, achieving roughly the same scores across these three (from 44.11 to 44.96), showing difficulty in picking up novel entities in novel settings.
TaggedP
[image:18.544.55.492.481.680.2]In addition, there are differences in annotation guidelines between the two datasets. If the CoNLL annotation guidelines were more inclusive than the Ontonotes ones, then even a memorisation evaluation over the same dataset would yield this result. This is, in fact, the case: OntoNotes divides entities into more classes, not all of which can be readily mapped to PER/LOC/ORG. For example, OntoNotes includes PRODUCT, EVENT, and WORK OF ART
Table 14
Out of domain performance:F1 of NERC with different models.
Memorisation CRFSuite Stanf SENNA
P R F1 P R F1 P R F1 P R F1
MUC 7 Dev 38.24 20.89 27.02 54.27 50.09 52.09 57.01 55.42 56.21 50 59.97 54.53
MUC 7 Test 47.45 24.43 32.25 65.54 49.36 56.31 69.46 54.81 61.27 56.37 55.85 56.11
CoNLL TestA 53.14 22.36 31.48 67.12 38.57 48.99 69.22 48.27 56.88 68.62 58.68 63.26
CoNLL TestB 55.85 22.49 32.07 67.94 36.41 47.41 67.99 44.11 53.51 64.61 51.94 57.58
ACE NW 29.52 28.48 28.99 40.45 47.4 43.65 40.67 49.46 44.63 41.47 54 46.92
ACE BN 1.49 0.15 0.28 0 0 0 0 0 0 36.7 6.09 10.44
ACE BC 24.42 25.13 24.77 36.06 45.67 40.3 32.73 45.84 38.19 33.37 50.93 40.32
ACE WL 25.45 16.54 20.05 40.53 38.45 39.46 41.39 41.34 41.37 41.48 45.01 43.17
ACE CTS 68.31 25.58 37.23 26.28 16.94 20.6 35.93 22.47 27.65 24.69 23.05 23.84
ACE UN 8.07 27.69 12.5 9.76 40.08 15.7 10.48 42.56 16.82 9.95 49.59 16.57
OntoNotes BN 36.97 26.06 30.57 47.77 68.57 56.31 49.49 46.48 47.94 48.43 46.7 47.55
OntoNotes BC 33.68 24.21 28.17 72.24 64.74 68.29 72.69 66.47 69.44 69.49 70.88 70.18
OntoNotes WB 47.45 31.23 37.67 59.14 53.81 56.35 63.88 60.58 62.19 57.04 57.94 57.49
OntoNotes TC 54.15 28.4 37.26 60.88 48.26 53.84 65.09 60.1 62.5 57.79 62.02 59.83
OntoNotes MZ 40.38 20.1 26.84 47.75 64.05 54.71 51.31 41.05 45.61 43.23 39.05 41.03
MSM 2013 Test 14.87 5.8 8.34 41.29 23.32 29.81 49.2 32.19 38.92 16.81 37.85 23.28
Ritter 42.34 11.6 18.22 35.34 24.69 29.07 37.07 26.91 26.91 27.09 36.79 31.2
UMBC 52.27 12.17 19.74 44.71 20.21 27.84 59.09 27.51 37.55 31.39 22.75 26.38