Int. J. Electrochem. Sci., 6 (2011) 5189 - 5199
International Journal of
ELECTROCHEMICAL
SCIENCE
www.electrochemsci.org
A Glucose Biosensor Based on Nanographene and ZnO
Nanoparticles Using FFT Continuous Cyclic Voltammetry
Parviz Norouzi1,2,*, Hamed Ganjali1, Bagher Larijani2,*, Mohammad Reza Ganjali1,2, Farnoush Faridbod2, Hassan Ali Zamani3
1
Center of Excellence in Electrochemistry, University of Tehran, Tehran, Iran
2
Endocrinology and Metabolism Research Center, Tehran University of Medical Sciences, Tehran, Iran
3
Department of Applied Chemistry, Quchan branch, Islamic Azad University, Quchan, Iran
*
Corresponding Author; E-mail: [email protected]
Received: 6 September 2011 / Accepted: 11 October 2011 / Published: 1 November 2011
In this work, a new glucose electrochemical biosensor was made based on immobilization of glucose oxidase (GOx) on zinc oxide nanoparticles (ZnO NPs) doped in nanographene (NGs) sheets. A glassy carbon electrode was used as a transducer of the biosensor and Fast Fourier transformation continuous cyclic voltammetry (FFTCCV) was used as detection method in a flow injection system. Effect of scan rate, solution flow rate and buffer pH were modified. The results show that the linear response range of the biosensor was between 0.1 to 20 µM and the detection limit was calculated 0.02 µM at a signal-to-noise ratio of 3. The proposed biosensor showed an acceptable reproducibility, good stability and low interferences.
Keywords: Glucose, Biosensor, Nanographene, ZnO nanoparticles, FFT Cyclic voltammetry, Flow injection System
1. INTRODUCTION
modifiers and the electrolyte. Also, size and morphology of the electrode and the production method can be very important on the electrochemical response of a biosensor.
Glucose monitoring is essential in clinic and industry. Rapid determination of blood sugar for treatment and control of diabetes is vital. Development of cost-effective, simple, accurate, portable and rapid sensors for glucose are important in biosensor field because of the diabetics global prevalence which represents about 6.4% of the world’s population in 2010 [1].
Glucose biosensors have been developed for a long time. Till now, three generations of glucose biosensors using natural oxygen co-substrate and generation and detection of hydrogen peroxide, synthetic electron mediators, and direct electron transfer between enzymes and electrode surface, have been reported [2,3]. To develop the performance of the glucose biosensors, different nano-materials have been incorporated into the electrode surface [4-10].
Overall, it is difficult to exchange the electron between an enzyme and solid surface of the electrodes directly due to the inaccessibility of the redox center of enzyme and loss of its bioactivity by adsorption on the electrode surface.
Graphene is an allotrope of carbon, whose structure is one-atom-thick planar sheets of sp2 -bonded carbon atoms that are densely packed in a honeycomb crystal lattice. Recently, it has attracted considerable attention in construction of sensors and biosensors [11-14]. Graphene differs from most conventional three-dimensional materials. Intrinsic graphene is a semi-metal or zero-gap semiconductor. Experimental results from transport measurements show that graphene has a remarkably high electron mobility at room temperature, with reported values in excess of 15,000 cm2V−1s−1 [15]. Graphene exhibits excellent electron transfer promoting ability for some enzymes and excellent catalytic behavior toward small biomolecules such as H2O2, which makes graphene
extremely attractive for enzyme-based biosensors, e.g. glucose biosensors.
Metal nanoparticles (NPs) generally have high effective surface area, catalysis and biocompatibility. One of the interesting metal oxide nanoparticles which have interesting properties for using in electrochemical biosensors is ZnO nanoparticles (ZnO NPs). ZnO NPs have a high isoelectric point, which are about 9.5. In biological pH, which is lower than its isoelectric points, the surface of ZnO metal oxide nanoparticles has a positive charge. Thus, protein with low isoelectric point can be immobilized on it by an electrostatic force. ZnO NPs also show nontoxicity, good biocompatibility and high chemical stability when it used in construction of biosensors [16-18].
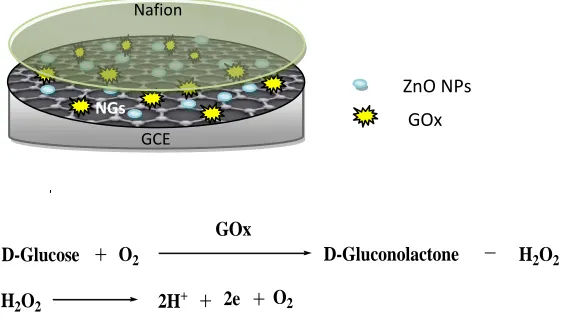
Most of the electrochemical glucose biosensors are based on the glucose oxidase (GOx) enzyme, which catalyzes the oxidation of glucose to gluconolactone which was hydrolyzed to gluconic acid in water as seen in Fig. 1.
The quantification of glucose can be achieved via electrochemical detection of the enzymatical released of H2O2. In the current study, the electrochemical response of the graphene-based glucose
biosensor was obtained from the anodic oxidation current of the enzymatic product, H2O2. It is well
known that H2O2 undergoes electrochemical oxidation processes at the solid electrodes, but the
[image:3.596.177.459.527.689.2]
constructing biosensors for detecting H2O2. However, graphene has shown promise in this aspect
[19,20].
This work introduces a new designed electrochemical biosensor for monitoring of glucose using FFT continuous cyclic voltammetry (FFTCCV) technique as a detection method [21-34]. Fast Fourier transform method provides a sensitive system in combination of an electrochemical method. Fourier Transform (FT) is a defined technique for converting or transforming electrochemical signals from the time domain to the frequency domain. Hence, the electrochemical signal does not suffer from environmental noises. The approach used here is designed to separate the voltammetric signal and background signal in frequency domain by using discrete Fast Fourier Transformation (FFT) method. Based on FFT information, the cutoff frequency of the analog filter is set at a certain value. Thus, some of the noises filtrate digitally and decrease the bandwidth of the measurement.
2. EXPERIMENTAL SECTION
2.1. Reagents
Glucose oxidase (GOx) (from Aspergillus niger, >100 U/mg) was purchased from Sigma-Aldrich Co. and its solution (10 mg/mL) was prepared in 0.1 M phosphate buffer solution (PBS, pH=7.0) and stored in a refrigerator (at 4 ºC). D-(+)-glucose was purchased from Merck Co. The nano graphene (xGnP®, particle thickness is about 7 nanometers, with an average surface area of about 120 to 150 m2/g) was purchased from XG Sciences Co. All other chemicals were of analytical grade and purchased from Merck Co. All solutions were made up with doubly distilled deionized water.
2.2. Preparation of Nafion/GOx/ZnO NPs-NGs/GC electrode
D-Glucose O2
GOx
H2O2
D-Gluconolactone
2H+ O2
H2O2 2e
Figure 1. Schematic diagram of glucose oxidase (GOx) enzymatic reaction and the glucose biosensor preparation
ZnO NPs
GOx
Nafion
Glassy carbon electrode (3 mm-diameter) was polished first with 1.0, and 0.05-μm alumina slurry. After rinsing with doubly distilled water, they were sonicated in absolute ethanol and doubly distilled water for about 5 min, respectively. 1 mg graphene–ZnO NPs composites were added to 1 mL of DMF solution and sonicated to form homogenous dispersion. 2 µL of the graphene–ZnO NPs solution was dropped onto a cleaned glassy carbon electrode surface and allowed to dry in ambient air for 12 h to obtain graphene-ZnO NPs modified electrode. Then, 20 μL of GOx solution was dropped onto the surface of the modified GC electrode with a microsyringe and allowed to dry at ambient temperature.
Finally, 5 μL of nafion (5 wt.%) was casted and used as a net to hold the GOx/ZnO NPs-NGs on the electrode surface stably. The solvent was allowed to evaporate before use.
To prevent loss of the enzyme molecules, nafion films have been used in the construction of biosensors. Nafion, due to its easy fabrication, good electrical conductivity, high chemical stability and good biocompatibility, has been widely used as a protective coating material and as a support for the enzyme immobilization. The final electrode is taken as the Nafion/GOx/ZnO NPs-NGs/GC electrode. All resulting electrodes were stored at 4 °C when not in use.2.3. Instrumentation
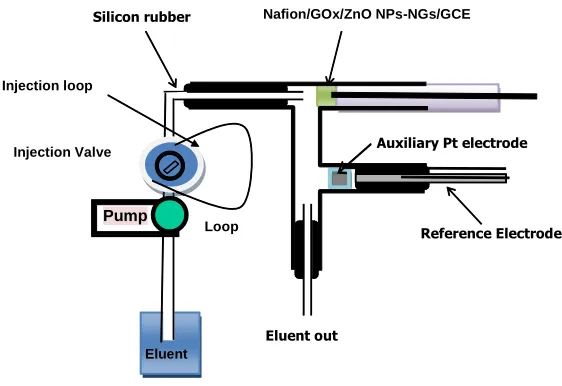
[image:4.596.160.441.356.549.2]
Figure 2. Schematic diagram of the flow injection analysis
FFTCCV measurements were performed by a homemade potentiostat, connected to a PC via an analog to digital (A/D) data acquisition board (PCL-818H, Advantech Co.) [21-25]. The A/D board was used for generating the analog waveform and acquiring current. During the measurements, the potential waveform was repeatedly applied to the cell, and the obtained data was stored by the software. In the measurements, the data acquisition requirements electrochemical software was developed using Delphi 6.0.
The flow injection analysis system included an eight roller peristaltic pump (UltratekLabs Co., Iran) and a four way injection valve (Supelco Rheodyne Model 5020) with 300 L sample injection
Eluent out
Auxiliary Pt electrode
Reference Electrode Silicon rubber
Pump
Eluent Injection Valve
Injection loop
Nafion/GOx/ZnO NPs-NGs/GCE
loop. The glucose solutions were introduced into the sample loop by means of a plastic syringe. The electrochemical cell used in flow injection analysis is shown in Fig. 2.
3. RESULTS AND DISCUSSION
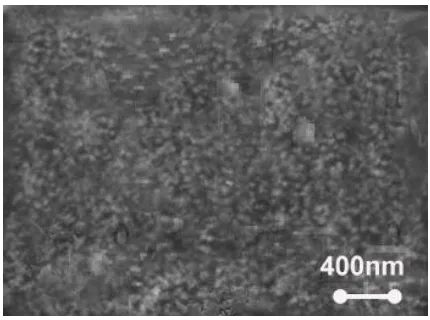
[image:5.596.183.398.304.464.2]The typical scanning electron microscope (SEM) of the modified glassy carbon electrode with ZnO NP-Nanographene is shown in Fig. 3. This figure indicates that the sample is composed of a large quantity of well-dispersed nanoparticles. The modified electrode would have larger ratio of surface and is more suitable for the immobilization of the enzyme. The ZnO Nps–NGs modified glassy carbon electrode (GCE) exhibited favorable electron transfer kinetics and electrocatalytic activity for the oxidation of glucose. Based on the results, it is cleared that the physical morphology of the biosensor can play an important role in the sensitivity of the detection method.
Figure 3. Typical SEM image of the modified glassy carbon electrode by ZnO NPs-NGs
3.1. Electrochemical characterization of the biosensor
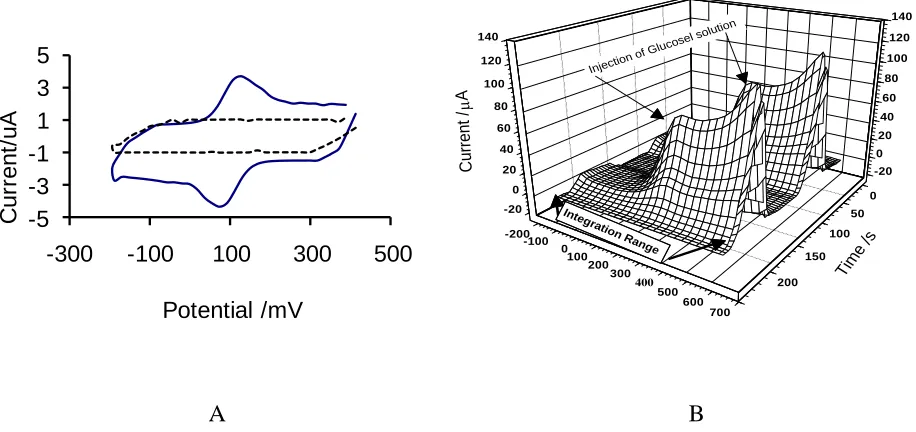
In the three dimensional graph, the applied potential to the working electrode during each scan is shown (at the potential axis), and the time axis, represents a quantity proportional to number of scans, for one measurement [16]. The figure, also, shows that before injection of glucose, there is not any significant peak current in the voltammograms, but by injection of 300 μL of 2.0×10⁻⁵ M of glucose in 0.1 M PBS at pH=7.0, a well-defined catalytic peak current at potential 250 mV was developed as a consequence of the GOx catalytic oxidation of glucose. The existence of the peak current can be related to the production of H2O2 by GOx enzyme during the oxidation of glucose at the
biosensor surface. Even so, it can be suggested that attachment of GOx to high surface area of ZnO NPs-NGs/GC facilitates a higher rate of direct electron transfer between the active sites of immobilized GOx, which can amplify the peak current at the cyclic voltammograms.
A B
Figure 4. A) Cyclic voltammograms for 0.1 M PBS with pH 7.0 obtained at the GC electrode modified with ZnO NPs-NGs (the dashed curve), and GOx/ZnO NPs-NGs (the solid curve), Scan rate: 100 mV/s ; B) FFTCCV voltammograms of the Nafion/GOx/ZnO NPs-NGs/GC biosensor in absent and presence of 300 μL of 2.0×10⁻⁵
M glucose in 0.1 M PBS at pH=7.0 in the potential range of -200 to 600 mV at 4 V/s scan rate.
In this detection method the current passing through the electrode was sampled only during the potential ramp. This data processing operation was carried out simultaneously with data acquisition during running the experiments. Due to this fact that the current integration method can significantly reduce the low frequency noise, the biosensor response was calculated based on charge under the peak. The result of the integration is shown in Fig. 4B. The response was calculated as follow:
ΔQ = Q – Q0 (1)
where Q is the electrical charge obtained by integration of cyclic voltammetry curves, from -200 to 600 mV, and Q0 represents the calculated charge in the absence of glucose. The integration of
-200 -100 0 100 200 300 400 500 600 700 0 50 100 150 200 -20 0 20 40 60 80 100 120 140 -20 0 20 40 60 80 100 120 140 Time /s Cu rrent / A
Injection o f Gluco
sel solution
Integra tion Range -5 -3 -1 1 3 5
-300 -100 100 300 500
[image:6.596.70.528.265.481.2]
net current changes is applied over the selected scanned potential range. Also, in this calculation in order to improve the sensitivity the background response was subtracted. The absolute difference charge (ΔQ) was calculated numerically by using the following equation:
(2)
Where, s is the scan number, is the time period between subsequent potential scan, Δt is the time difference between two subsequent points on the cyclic voltammograms, i (s, E) represents the current of the cyclic voltammograms recorded during the s-th scan and i (sr, E) is the reference current
of the cyclic voltammograms. Ei and Ef are the initial and the final potential for integrating of current,
respectively (see Fig. 4B). The reference cyclic voltammogram was obtained by averaging a 5 to 10 cyclic voltammograms, recorded at the beginning of the measurements. The results of FFTCCV monitoring in the flowing injection analysis showed that the catalytic oxidation will cause a very sensitive current change at the voltammograms. In addition, the results show that with increasing the concentration of glucose in the injected sample, ΔQ increases. The result of the calculation for different of glucose standard solutions, is shown in Fig 5.
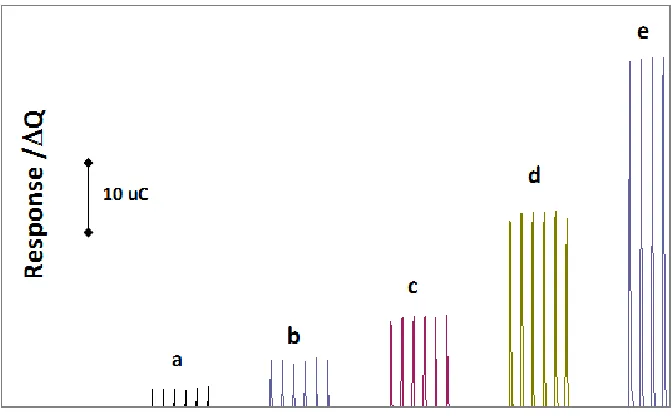
Figure 5. Response ΔQ of Nafion/GOx/ZnO NPs-NGs/GC electrode to the consecutive injection of 300 μL of glucose standard solution; a)2, b)4, c)8, d)16 and e)24 µM, (the integration rang was -200 to 600 mV) the experimental condition was as shown in Fig. 4B.
To evaluate the biological activity of a biosensor, the Michaelis–Menten constant KMapp is
generally used. According to the Lineweaver–Burk equation:
f
i
E E
E E
r E
s i E s i t s
[image:7.596.130.466.413.621.2]
1/i=KMapp/imax(1/C)+(1/imax) (3)
where i is the current, imax is the maximum current measured under saturated substrate
conditions, and C is the glucose concentration. According to the Lineweaver–Burk plot, the KMapp was
calculated to be 0.49 mM. This value of KMapp is indication of good bioactivity of the biosensor. In
addition, the high sensitivity of the enzyme electrode can be attributed to the excellent adsorption ability, highly enhanced electrocatalytic activity of GOx and good biocompatibility of the used ZnO NPs-NGs. Moreover, the result of excellent conductivity of GOx/ZnO NPs-NGs/GC biosensor is performing a better electron communication. This can be the reason of the enhancement of the rate of the electrochemical process and the direct electron transfer between the active sites of the enzyme and the surface of the electrode.
3.2. Optimizing the experimental parameters
In this method, sensitivity of the measurement mainly depends on the potential scan rate and eluent solution flow rate. This dependent look likes as a result of kinetic factors of the electrochemical processes at the biosensor surface, and instrumental circumstances [21-34]. The effects of the scan rate on the detection performance can be taken into consideration from three different characteristics; rate of data acquisition, kinetic factors of processes, and the flow rate of the eluent, which controls the time retention of the solution sample zone in the electrochemical cell. Based on these circumstances, it was necessary to study those parameters.
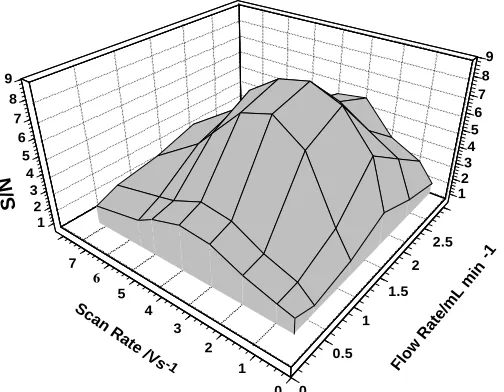
The effects of the potential scan rate, from 0.5 to 7 V/s, and the eluent flow rate (from 0.5 to 3 mL/min) on the sensitivity of the biosensor response were investigated. The obtained results for the injecting solutions of 2.0×10⁻⁵
[image:8.596.146.398.500.696.2]M of glucose solution are presented in Fig. 6.
Figure 6. The effect of the scan rate and the solution flow rate on the S/N of Nafion/GOx/ZnO NPs- NGs/GC electrode to injection of 2.0×10⁻⁵ M glucose (the integration rang was -200 to 600 mV). 0 1 2 3 4 5 6 7 0 0.5 1 1.5 2 2.5 1 2 3 4 5 6 7 8 9 1 2 3 4 5 6 7 8 9 Sc an R ate /Vs
-1 Flow
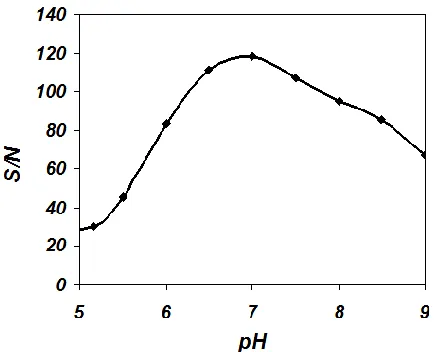
As it is shown in this figure, the detector exhibits the maximum sensitivity (or signal to noise, S/N) at 4 V/s of scan rate and 2.5 mL/min of the eluent flow rate. The main reason for seeing a lower sensitivity of the biosensor, at scan rates higher than 4V/s, is the limitation in the rate of electron transfer of the electrochemical process. Also, at flow rates larger than 2.5 mL/min retention time is very short, and due to lower data point, the S/N decline.Due to this fact that the activity of the immobilized GOx is significantly pH dependent, the S/N of the detector was studied in various pH. The charge response of Nafion/GOx/ZnO NPs-NGs/GC was measured in the pH range of 5.0–9.0 (Fig. 7). This figure shows that the maximum S/N of the detector obtained at pH of 7.0. The main reason for this is redaction enzyme activity and the existence of a large background noise at pHs higher and lower than 7.0.
Figure 7. The effect of pH on the S/N of Nafion/GOx/ZnO NPs-NGs/GC electrode to injection of 2.0×10⁻⁵
M glucose (the integration rang was -200 to 600 mV)
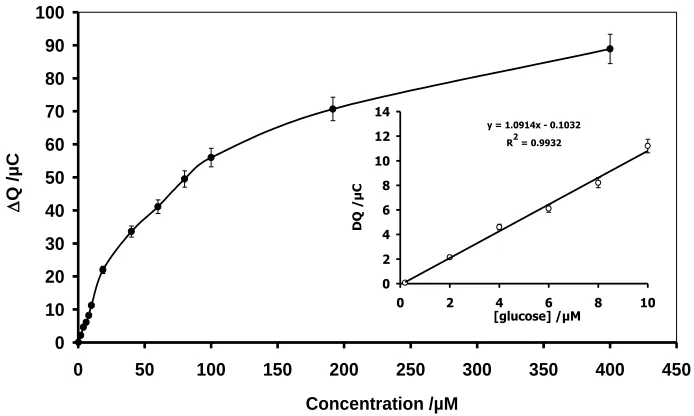
3.3. Calibration curve and biosensor characterization
[image:9.596.186.403.292.468.2]
0 10 20 30 40 50 60 70 80 90 100
0 50 100 150 200 250 300 350 400 450
Concentration /µM
Q
/µ
C
y = 1.0914x - 0.1032 R2 = 0.9932
0 2 4 6 8 10 12 14
0 2 4 6 8 10
[glucose] /µM
DQ
/µ
[image:10.596.127.474.74.282.2]C
Figure 8. The calibration curve for glucose determination in 0.1 M PBS pH=7.0,(the integration rang was -200 to 600 mV) the experimental condition was as shown in Fig. 4B.
4. CONCLUSIONS
In this work, a highly sensitive glucose biosensor has been fabricated by modification of a GC electrode surface with ZnO NPs and nanographene. In assessment, it was confirmed that the presented Nafion/GOx/ZnO NPs-NGs/GC electrode combined with FFTCCV method exhibits an excellent and reproducible sensitivity for the glucose detector. In this detection technique, the response of the detector the charge under the peak was calculated in a specific potential range. The sensitivity of the detector retained 94.8% of initial sensitivity up to 45 days, and then gradually decreases afterwards. This decline of the response might be due to the loss of the catalytic activity of the biosensor. The long-term storage stability of the sensor was tested for 60 days.
References
1. R. Sicree, J. Shaw, and P. Zimmet, IDF Diabetes Atlas fourth edition, 2009, IDF: Brussels. 2. J. Wang, Chem. Rev. 108 (2008) 814.
3. E. Yoo and S. Lee, Sensors, 10 (2010) 4558.
4. P. Norouzi, F. Faridbod, B. Larijani, and M. R. Ganjali, Int. J. Electrochem. Sci., 5 (2010) 1213. 5. A. Shokuhi Rad, A. Mirabi, E. Binaian, H. TayebiInt. J. Electrochem. Sci., 6 (2011) 3671.
6. Y. F. Zhang, G. P. Guo, F. Q. Zhao, Z. R. Mo, F. Xiao, and B. Z. Zeng, Electroanalysis 22 (2010) 223.
7. L. Q. Luo, Q. X. Li, Y. H. Xu, Y. P. Ding, X. Wang, D. M. Deng, and Y. J. Xu, Sens. Actuators B 145 (2010) 293.
8. C. Zou, Y. C. Fu, Q. J. Xie, and S. Z. Yao, Biosens. Bioelectron. 25 (2010) 1277.
9. L. Z. Zheng, J. H. Li, J. P. Xu, L. Y. Xiong, D. Zheng, Q. Liu, W. Liu, Y. D. Li, S. M. Yang, and J. Xia, Analyst 135 (2010) 1339.
11.M. R. Ganjali, S. O. Ranaei-Siadat, H. Rashedi, M. Rezapour, and P. Norouzi, Int. J. Electrochem. Sci., 6(2011)3684.
12. B. Huang, Z. Li, Z. Liu, G. Zhou, S. Hao, J. Wu, B. Gu, and W.H. Duan, J. Phys. Chem. C 112 (2008) 13442.
13.L. Zhang, Y. Li, L. Zhang, D. Li, D. Karpuzov, Y. Long, Int. J. Electrochem. Sci., 6 (2011) 819. 14. Z. Zhuang, J. Li, R. Xu, D. Xiao, Int. J. Electrochem. Sci., 6 (2011) 2149.
15. A. K. Geim, and K. S. Novoselov, Nature Materials 6 (2007) 183.
16. P. Norouzi, V. K. Gupta, F. Faridbod, M. Pirali-Hamedani, B. Larijani, and M. R. Ganjali, Anal. Chem., 83 (2011) 1564.
17. X. Luo, J. Xu, and W. Zhao, Chen, H. Biosens. Bioelectron. 19 (2004) 1295. 18. B. J. Casey, and P. Kofinas, J. Biomed. Mater. Res. A 87 (2008) 359.
19. M. Zhou, Y. M. Zhai, and S. J. Dong, Anal. Chem. 81 (2009) 5603.
20.Y. Shao, J. Wang, H. Wu, J. Liu, I. A. Aksay, and Y. Lin, Electroanalysis 22 (2010) 1027.
21.P. Norouzi, H. Rashedi, T. Mirzaei Garakani, R. Mirshafian and M. R. Ganjali, Int. J. Electrochem. Sci. 5 (2010) 377.
22.P. Norouzi, M. R. Ganjali, B. Larijani, A. Mirabi-Semnakolaii, F. S. Mirnaghi, and A. Mohammadi, Pharmazie 63 (2008) 633.
23.P. Norouzi, G. R. Nabi Bidhendi, M. R. Ganjali, A. Sepehri, and M. Ghorbani, Michrochim. Acta, 152 (2005) 123.
24.P. Norouzi, M. R. Ganjali, S. Shirvani-Arani, and A. Mohammadi, J. Pharm. Sci. 95 (2007) 893. 25.M. R. Pourjavid, P. Norouzi, and M. R. Ganjali, Int. J. Electrochem. Sci. 4 (2009) 923.
26.P. Norouzi, M. R. Ganjali, M. Zare, and A. Mohammadi, J. Pharm. Sci. 96 (2007) 2009. 27.P. Norouzi, M. Qomi, A. Nemati, and M. R. Ganjali, Int. J. Electrochem Sci. 4 (2009) 1248. 28.P. Norouzi, B. Larijani, M. Ezoddin and M. R. Ganjali, Mater. Sci. Eng. C 28 (2008) 87.
29.M. R. Ganjali, P. Norouzi, R. Dinarvand, R. Farrokhi, and A. A. Moosavi-Movahedi, Mater. Sci. Eng. C 28 (2008) 1311.
30.P. Norouzi, M. R. Ganjali, and L. Hajiaghababaei, Anal. Lett., 39 (2006) 1941.
31.P. Norouzi, M. R. Ganjali, T. Alizadeh, and P. Daneshgar, Electroanalysis 18 (2006) 947. 32.M. R. Ganjali, P. Norouzi, M. Ghorbani, and A. Sepehri, Talanta 66 (2005) 1225.
33.P. Norouzi, M. R. Ganjali, A. Sepehri, and M. Ghorbani, Sens. Actuators B 110 (2005) 239. 34.P. Norouzi, M. R. Ganjali, and P. Matloobi, Electrochem. Commun. 7 (2005) 333.