David Duffy
Joseph Durkan
Eddie Casey
Summer 2012
The
Economic
Research
Institute was founded in Dublin
in
1960,
with
the assistance
of
a
grant
from
the
Ford
Foundation
of New York. In
1966
the
remit
of the
Institute
was expanded to include social research, resulting in the Institute being renamed The
Economic
and
Social
Research
Institute
(ESRI).
In
2010
the
Institute
entered
into
a
strategic research alliance with Trinity College Dublin, while retaining its status as an
independent research institute.
The
ESRI
is
governed
by
an
independent
Council
which
acts
as
the
board
of
the
Institute
with
responsibility
for
guaranteeing
its
independence
and
integrity.
The
Institute’s
research
strategy
is
determined
by
the
Council
in
association
with
the
Director and staff. The research agenda seeks to contribute to three overarching and
interconnected
goals,
namely,
economic
growth,
social
progress
and
environmental
sustainability.
The
Institute’s
research
is
disseminated
through
international
and
national peer reviewed journals and books, in reports and books published directly by
the
Institute
itself
and
in
the
Institute’s
working
paper
series.
Researchers
are
responsible
for
the
accuracy
of
their
research.
All
ESRI
books
and
reports
are
peer
reviewed
and
these
publications
and the
ESRI’s
working
papers can
be
downloaded
from the ESRI website at
www.esri.ie
The
Institute’s
research
is
funded
from
a
variety
of
sources
including:
an
annual
grant‐in‐aid
from
the Irish Government;
competitive
research grants
(both
Irish
and
international);
support
for
agreed
programmes
from
government
departments/agencies
and
commissioned
research
projects
from
public
sector
bodies.
Sponsorship
of
the
Institute’s
activities
by
Irish
business
and
membership
subscriptions provide a minor source of additional income.
Quarterly
Economic
Commentary
The
Quarterly
Economic
Commentary
analyses
current
economic
trends
and
provides macro‐economic
forecasts
for
the
current
and
following
year.
It
assesses
international
economic
prospects
and
provides
short‐term
forecasts
in
the
framework
of
a
consistent
set
of
national
accounts
for
Ireland. Its wide range of users includes
government
departments,
policy‐
makers,
social
partners,
international
organisations,
academics
and
the
national
and
international
financial
sectors.
Research
Bulletin
The
Research
Bulletin
provides
short
summaries
of
work
published
by
ESRI
staff
and
overviews
of
thematic
areas
covered
by
ESRI
programmes
of
research. Bulletin articles are designed to
be easily accessible to a wide readership.
A
reference
or
references
to
the
full
publication is included at the end of each
Bulletin article.
An
archive
of
bulletin
articles
will
be
found at
www.esri.ie/bulletin
Quarterly Economic
Commentary
David Duffy Joseph Durkan Eddie Casey
Summer 2012
The forecasts in this Commentary are based on data available by 11 June 2012. Draft completed 15 June 2012
Research Notes
Eddie CaseyJoseph Durkan and Niall O'Hanlon (CSO) Pete Lunn
Special Articles
David Duffy and John FitzGerald
Research Bulletin
12/2
Authors
David Duffy is a Research Officer and Editor of the Commentary, Joseph Durkan is
an Associate Research Professor and Eddie Casey is a Research Assistant at the Economic and Social Research Institute (ESRI).
The Commentary, Research Notes, Special Articles and Research Bulletins
contained within have been accepted for publication by the Institute, which is not responsible for either the content or the views expressed.
Table of Contents | i
Table of Contents
Summary Table ... ii
Summary ... iii
CHAPTERS 1. Introduction ... 1
2. Exports of Goods and Services ... 3
3. Investment ... 6
4. Household Consumption ... 8
5. Public Finances ... 11
6. Population and the Labour Market ... 13
7. Incomes and Prices... 17
8. Imports and the Balance of Payments ... 19
9. GDP and GNP... 21
10. Monetary Sector Developments ... 23
11. General Assessment of the Irish Economy ... 28
RESEARCH NOTES ... 37
Unit Labour Costs in Irish Manufacturing – Eddie Casey ... 39
The Saving Rate during the Recession – Joe Durkan and Niall O'Hanlon (CSO) ... 47
The Impact of Recession on Migration: A Preliminary Analysis of Census 2011 – Pete Lunn ... 52
SPECIAL ARTICLES ... 63
The Irish Housing Market – David Duffy and John FitzGerald ... 65
RESEARCH BULLETIN ... 89
Pharmaceuticals: Getting Better Value for Money – Paul K. Gorecki, Anne Nolan, Aoife Brick and Seán Lyons ... 91
Summary Table
2009 2010 2011 2012 2013
Output (Real Annual Growth %)
Private Consumer Expenditure -6.9 -0.8 -2.7 -2.0 -0.5 Public Net Current Expenditure -4.5 -3.8 -3.7 -2.3 -2.2
Investment -28.7 -24.9 -10.6 -2.7 4.3
Exports -4.2 6.3 4.1 3.3 3.5
Imports -9.3 2.7 -0.7 0.9 2.6
Gross Domestic Product (GDP) -7.0 -0.4 0.7 0.6 2.2 Gross National Product (GNP) -9.8 0.3 -2.5 0.0 0.5 Prices (Annual Growth %)
Consumer Price Index (CPI) -4.5 -1.0 2.6 1.7 1.5 Growth in Average Hourly Earnings 2.5 -1.5 -0.2 0.5 0.5 Labour Market
Employment Levels (ILO basis (000s)) 1,929 1,848 1,810 1,797 1,792 Unemployment Levels (ILO basis (000s)) 259 292 304 315 308 Unemployment Rate (as % of Labour Force) 11.8 13.6 14.4 14.9 14.7 Public Finance
Exchequer Balance (€bn) -24.6 -18.7 -24.9 -16.0 -14.4 General Government Balance (€bn) -22.5 -48.6 -20.5 -13.3 -12.5 General Government Balance (% of GDP) -14.0 -31.2 -13.1 -8.3 -7.5 General Government Debt, % of GDP 65 93 108 115 121 External Trade
Balance of Payments Current Account (€bn) -4.7 0.8 0.1 4.7 5.0 Current Account (% of GNP) -3.6 0.6 0.1 3.7 3.8
Summary | iii
Summary
As at the time of the last Commentary, uncertainties in the eurozone remain and,
despite progress made domestically in terms of fiscal consolidation, financial sector reforms and a reversal of competitiveness losses, the scale of the challenges facing the monetary union have the potential to suppress any significant Irish recovery further into the future. In addition, subdued growth in the UK also signals difficulties for immediate growth prospects. Recovery in Ireland in the near term remains tied to developments elsewhere. Current forecasts for the eurozone economy predict a recovery in the second half of this year and into next year.
With domestic demand still expected to act as a drag on the economy in 2012, albeit a moderating one, the external sector is again likely to be the principal factor determining growth in the Irish economy. As a result of external weaknesses and increased uncertainty relating to the international environment, growth forecasts for this year have been revised downwards modestly. GNP growth is expected to be flat and GDP is expected to rise by 0.6 per cent. Turning to 2013, increased export volumes following the predicted recovery in the eurozone and the impact on exports of new firms, and a less negative domestic environment are expected to aid growth, with GNP likely to improve slightly, increasing by 0.5 per cent, while GDP is expected to expand by 2.2 per cent.
Household consumption is expected to weaken further in 2012 and 2013 as disposable incomes continue to decline, albeit at a moderating rate. New insights
from the CSO's Household Budget Survey also indicate that private consumption
spending may not benefit from a rapid expansion as the extent of precautionary savings may well be less than previously thought.
National Accounts 2011
A: Expenditure on Gross National Product2010 2011 Change in 2011
€ bn € bn Value Price Volume Private Consumer Expenditure 82.6 81.1 -1.8 1.0 -2.7 Public Net Current Expenditure 26.2 25.1 -4.2 -0.6 -3.7 Gross Fixed Capital Formation 18.1 15.9 -11.9 -1.5 -10.6 Exports of Goods and Services 157.7 165.3 4.8 0.7 4.1 Physical Changes in Stocks -0.9 0.5
Final Demand 283.7 288.0 1.5 0.6 0.8
less:
Imports of Goods and Services (M) 127.9 131.7 3.0 3.7 -0.7 Statistical Discrepancy 0.2 0.2
GDP at Market Prices 156.0 156.5 0.3 -0.4 0.7
Net Factor Payments (F) -27.8 -32.6
GNP at Market Prices 128.2 123.9 -3.4 -0.9 -2.5
B: Gross National Product by Origin
2010 2011 Change in 2011
€ bn € bn € bn %
Agriculture 2.7 3.0 0.3 9.8
Non-Agriculture: Wages, etc. 68.8 69.0 0.2 0.3
Other 53.2 53.0 -0.1 -0.2
Adjustments: Stock Appreciation -0.3 -0.3
Statistical Discrepancy -0.2 0.2 0.4 -200.2
Net Domestic Product 124.2 124.9 0.7 0.6
Net Factor Payments -27.8 -32.6 -4.8 17.3
National Income 96.4 92.3 -4.1 -4.2
Depreciation 16.2 15.2 -1.0 -6.3
GNP at Factor Cost 112.6 107.5 -5.1 -4.5
Taxes less Subsidies 15.6 16.4 0.8 5.0
GNP at Market Prices 128.2 123.9 -4.3 -3.4
C: Balance of Payments on Current Account
2010 2011 Change in 2011
€ bn € bn € bn
X – M 29.4 33.2 4
F -27.8 -32.6 -5
Net Transfers -1.2 -0.9 0
Balance on Current Account 0.8 0.1 -1
National Accounts| v
National Accounts 2012
A: Expenditure on Gross National Product2011 2012 Change in 2012
€ bn € bn Value Price Volume Private Consumer Expenditure 81.1 80.7 -0.5 1.5 -2.0 Public Net Current Expenditure 25.1 24.8 -1.2 1.1 -2.3 Gross Fixed Capital Formation 15.9 15.5 -2.8 -0.1 -2.7 Exports of Goods and Services 165.3 175.3 6.1 2.7 3.3 Physical Changes in Stocks 0.5 -0.1
Final Demand 288.0 296.2 2.9 2.1 0.7
less:
Imports of Goods and Services (M) 131.7 136.0 3.3 2.4 0.9 Statistical Discrepancy 0.2 0.2
GDP at Market Prices 156.5 160.4 2.5 1.9 0.6
Net Factor Payments (F) -32.6 -33.5
GNP at Market Prices 123.9 126.9 2.4 2.4 0.0
B: Gross National Product by Origin
2011 2012 Change in 2012
€ bn € bn € bn %
Agriculture 3.0 3.1 0.1 3.5
Non-Agriculture: Wages, etc. 69.0 68.9 -0.1 -0.2
Other 53.0 57.3 4.2 8.0
Adjustments: Stock Appreciation -0.3 -0.3
Statistical Discrepancy -0.2 -0.2 0.0 19.6
Net Domestic Product 124.9 128.7 3.8 3.1
Net Factor Payments -32.6 -33.5 -1.0 3.0
National Income 92.3 95.2 2.9 3.1
Depreciation 15.2 15.2 0.0 0.0
GNP at Factor Cost 107.5 110.4 2.9 2.7
Taxes less Subsidies 16.4 16.5 0.1 0.6
GNP at Market Prices 123.9 126.9 2.9 2.4
C: Balance of Payments on Current Account
2011 2012 Change in 2012
€ bn € bn € bn
X – M 33.2 38.9 5.7
F -32.6 -33.5 -1.0
Net Transfers -0.9 -1.1 -0.2
Balance on Current Account 0.1 4.7 4.5
as % of GNP 0.1 3.7 3.5
National Accounts 2013
A: Expenditure on Gross National Product2012 2013 Change in 2013
€ bn € bn Value Price Volume Private Consumer Expenditure 80.7 81.6 1.1 1.6 -0.5 Public Net Current Expenditure 24.8 24.6 -0.9 1.3 -2.2 Gross Fixed Capital Formation 15.5 16.2 4.4 0.1 4.3 Exports of Goods and Services 175.3 183.7 4.8 1.3 3.5 Physical Changes in Stocks -0.1 1.0
Final Demand 296.2 307.1 3.7 1.3 2.3
less:
Imports of Goods and Services (M) 136.0 141.0 3.7 1.0 2.6 Statistical Discrepancy 0.2 0.2
GDP at Market Prices 160.4 166.3 3.7 1.5 2.2
Net Factor Payments (F) -33.5 -36.5
GNP at Market Prices 126.9 129.7 2.3 1.8 0.5
B: Gross National Product by Origin
2012 2013 Change in 2013
€ bn € bn € bn %
Agriculture 3.1 3.2 0.1 4.0
Non-Agriculture: Wages, etc. 68.9 69.0 0.1 0.2
Other 57.3 61.3 4.1 7.1
Adjustments: Stock Appreciation -0.3 -0.3
Statistical Discrepancy -0.2 -0.2 0.0 0.0
Net Domestic Product 128.7 133.0 4.3 3.4
Net Factor Payments -33.5 -36.5 -3.0 8.9
National Income 95.2 96.5 1.3 1.4
Depreciation 15.2 15.2 0.0 0.0
GNP at Factor Cost 110.4 111.7 1.3 1.2
Taxes less Subsidies 16.5 18.0 1.5 9.4
GNP at Market Prices 126.9 129.7 2.9 2.3
C: Balance of Payments on Current Account
2012 2013 Change in 2012
€ bn € bn € bn
X – M 39 42 3.4
F -34 -37 -3.0
Net Transfers -1 -1 -0.1
Balance on Current Account 4.7 5.0 0.3
Introduction | 1
1
Introduction
Ireland is a small very open economy. The structure of the sections in the
Quarterly Economic Commentary reflects the importance of the international economy to exports and investment as the main drivers of sustainable growth and potential recovery.
The International Economy1
The international economy is marked by very large differences in performance. At one level the two big emerging economies of Asia: China and India, are experiencing substantial growth as convergence and good domestic policy together have produced impressive economic growth. While Japan is now experiencing faster growth, partly due to reconstruction expenditure, the overhang of the fiscal and banking crisis of the past two decades remains a significant drag on its economy.
The US economy is in recovery, but as we have noted in earlier Commentaries,
the recovery has been muted, given the large costs of the financial sector recapitalisation. There are initial signs, notably in private investment, that the recovery may have moved beyond the fiscal stimulus and the economy may be moving towards faster growth. Much depends on maintaining the present fiscal stance, allowing the public finances to improve as the economy grows rather than eliminating special measures introduced to mitigate the worst effects of the recession. As it stands, public expenditure on goods and services, both current and capital, will fall this year, but remain relatively unchanged in 2013. Private non-residential investment grew rapidly in 2011; its growth has moderated this year but current forecasts indicate a faster increase again in 2013. Unemployment has continued to fall, albeit more moderately than had been expected, from the peak level experienced in 2010.
GDP in the UK fell in the final quarter of 2011 and again in the first quarter of this year. The UK government strategy has been to correct the fiscal imbalances in the hope that a fiscal contraction which leads to a reduction in domestic demand would result in switching from the domestic market to overseas markets, with reasonable growth expected to follow. The weakness in the international
economy, most particularly in the eurozone, has made it difficult to realise this objective. The UK government is determined to meet its fiscal target, though there is some debate about whether in the current situation it would be better to alter the pace of adjustment. Monetary policy has maintained relatively low interest rates to support the economy and open-market operations (quantitative easing) have continued to provide liquidity to financial markets and to maintain a competitive exchange rate. Current forecasts for the UK economy expect a recovery in the second half of this year - partly driven by the impact of lower inflation on real incomes and consumption, and by increased exports if the eurozone economy picks up.
Exports of Goods and Services | 3
2
Exports of Goods and Services
Preliminary data for 2011 indicate that Irish exports of goods and services increased by 4.1 per cent in volume terms. Exports of goods increased by 3.4 per cent, while exports of services increased by 4.9 per cent. Goods exports were affected by the slowdown in some major markets in the second half of the year, and as such, exports fell by 0.7 per cent, seasonally corrected, between the first and second halves of the year. Exports of services increased during the year - some part of this was due to an improvement in tourism services, but exports of other services grew reflecting continued growth in the number of firms in the sector and in employment in existing export services firms.
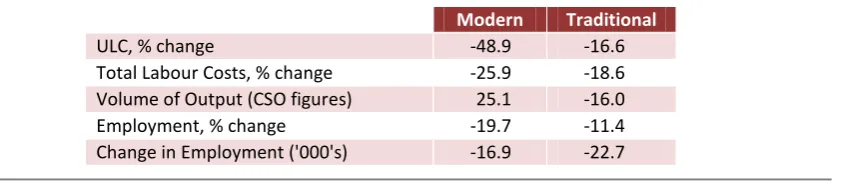
The factors affecting growth in exports are the development of the world economy, the extent of any increase in supply capacity and any change in competitiveness. The usual measure of competitive trends, unit labour costs (ULCs), is limited in that it takes no account of other non-wage factors, such as quality and delivery, which can be important, and the trend in unit labour costs itself is a summary measure of an outcome rather than a driving force itself. Nevertheless, it is useful to look at developments in unit labour costs. The accompanying research note "Unit Labour Costs in Irish Manufacturing" discusses developments in detail.
Looking now at exports this year and next, data for the first quarter 2012 for merchandise exports indicate the continued weakness in the international economy. Traditional sector exports from the food and drink sectors have remained very static, while the data on modern sector pharmaceutical exports have been affected by major products coming off patent. What is critical for the economy is the impact that a drug coming off patent has on output and employment, as the reduction in the value of exports because of a price fall will have a counterpart in a reduction in profit and in net factor outflows. There will also be a reduction in corporation tax receipts, although the extent of this also depends on how much additional "tax sheltering" firms engage in. The weakness of the euro will improve competitiveness of domestic costs, particularly vis-à-vis the US in the short run. This will have a positive effect on export volumes via the effect on decisions regarding the location of production by multinationals. In addition, if the assumed recovery in the eurozone economy does materialise there could be a recovery in exports of goods continuing into 2013. There has also been a steady increase in the number of new overseas firms and an expansion of existing firms, for example, Amazon, Sky, Google in the services sector and Intel in the manufacturing sector; both factors have the potential to contribute to increase exports.
Exports of services are not affected just by growth in the world economy. They are also influenced by location decisions on the supply side by multinationals. The increase in the numbers of firms and in employment geared to overseas services has continued throughout this recession. This will add to output and employment both this year, where we are forecasting a volume rise of 3.8 per cent in other service exports, and next year where the volume rise could be 4 per cent.
TABLE 1 Exports of Goods and Services, Volume % Change
2011 2012 2013
% % %
Merchandise 3.4 2.8 3.1
Tourism 7.4 2.8 3.5
Other Services 4.8 3.8 4.0 Exports of Goods and Services 4.1 3.3 3.5
Source: Central Statistics Office and ESRI Forecasts
Exports of Goods and Services | 5
3
Investment
On the basis of the currently available data investment contracted in 2011 for the fourth consecutive year, although the decline was more moderate than that recorded in 2009 and 2010 at about 10.6 per cent.
Investment | 7
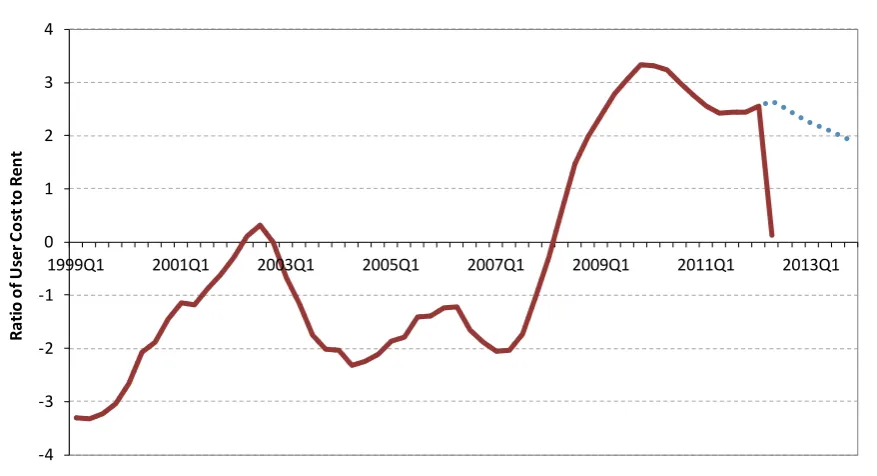
FIGURE 1 Housing Market Indicators
We also suspect that uncertainty about the international environment will result in some re-assessment of investment decisions by companies and so growth in the components of investment in machinery and equipment will be more moderate than we had previously thought. We now expect that growth in this component of investment will be 5 per cent in volume in 2012. Notwithstanding this investment is expected to continue to decline in 2012, by 2.7 per cent in volume terms. Based on the forecasts for the components of building and construction outlined above, which coupled with stronger investment in machinery and equipment, means we are now forecasting that investment will grow by 4.3 per cent in volume terms in 2013.
TABLE 2 Gross Fixed Capital Formation, % Change in Volume
2011 2012 2013
% % %
Housing -28.2 -4.6 0.0
Other Building -7.6 -10.5 3.8 Transfer costs -4.5 -10.0 -12.0 Total Building and Construction -16.0 -8.4 1.6 Machinery and Equipment -2.0 5.0 7.5
Total -10.6 -2.7 4.3
Source: Central Statistics Office and ESRI Forecasts 0
20,000 40,000 60,000 80,000 100,000 120,000
2006Q1 2007Q1 2008Q1 2009Q1 2010Q1 2011Q1
Permissions Total Completions (using commencements)
4
Household Consumption
Preliminary annual data for 2011 show a decline in the volume of private consumption spending for the fourth year in a row. The average level of spending in 2011 was marginally above that of 2005 in real terms. In an accompanying note we look in more detail at a variety of data in relation to household spending and saving. This adds to our understanding of the factors affecting saving and consumption. Previously the decline in consumption was seen as deriving from the fall in income as a result of the decline in output. This was compounded by a rise in the savings rate as households simultaneously reduced their borrowing and increased saving because of uncertainty about future employment prospects and post-tax income as the fiscal consolidation proceeded. More recently
available data from the latest Household Budget Survey (HBS) indicate that the
situation may be more complex. Over the pre-recession period and the present, nominal incomes in the economy as a whole increased very marginally. However increases in mortgage repayments more than absorbed the modest increase in incomes and consequently household expenditure on all other items, with the
exception of fuel and light, experienced declines. The HBS data also indicate a
modest increase in household savings, much less than that shown from other measures of savings, where mortgage repayments and increases in pension funds appear as savings. It also echoes the qualitative evidence from the Nationwide UK (Ireland)/ESRI Savings Index which has shown a broadly stable attitude amongst savers in recent years in relation to their own savings behaviour and their perception of the amount they save. The extent of precautionary saving may be less than previously thought and consequently a reduction in such savings, while it would certainly add to domestic demand, may offer much less hope for a return to much more rapid growth. Of course, while this is the situation for average households - clearly some are experiencing extreme difficulties and have little scope for either saving or increased consumption. Others may be in a stronger position, though still affected by uncertainty about the future course of taxation, public expenditure and employment.
Household Consumption| 9
FIGURE 2 Volume of Personal Consumption, Level, € millions
For 2012 we expect a continuation of this downward trend. Retail sales, the short-term indicator of consumer spending, were very weak in the first quarter. The volume of retail sales fell by 2.4 per cent compared with the final quarter of 2011, and was 2 per cent below the average level of 2011. The preliminary estimate for April showed a further decline. This may well reflect the bringing forward of consumer purchases in advance of the anticipated VAT increase that came into effect in January of this year. It is also likely that renewed concerns about wider economic developments, visible in the latest decline in the KBC/ESRI Consumer Confidence Index, may have dampened retail spending once again. The basic underlying problem, however, is that disposable incomes are set to fall again this year. Income from employment will increase very moderately, while transfer income from welfare payments will decline following changes in the welfare code. Overall personal income will decline, while taxes on personal income and wealth will increase. As a consequence household spending may fall by about 2 per cent in volume terms this year.
In terms of the time path, we expect the first quarter household spending to show a decline of about 2 per cent, followed by a further decline of about 1 per cent in the second quarter, followed by stability for the second half of the year. This is heavily conditional on the assumed slow recovery in the eurozone economy and increased exports from Ireland. This feeds into employment, gross earnings and disposable income.
18,500 19,000 19,500 20,000 20,500 21,000 21,500 22,000 22,500 23,000 23,500 24,000
2006Q1 2007Q1 2008Q1 2009Q1 2010Q1 2011Q1
€
(M
ill
io
ns
Public Finances | 11
5
Public Finances
The recently published Stability Programme Update (Department Of Finance,
April 2012) shows a more positive outcome to the public finances in 2011. While the headline deficit is recorded as reaching -13.1 per cent of GDP, this reflects monies used in the July 2011 recapitalisation of the banking sector. The outturn for the underlying general government deficit was -9.4 per cent of GDP. The better performance reflects a number of factors including higher than expected revenue, lower voted expenditure and a better than expected outturn for the Local Government Sector. On first viewing, this positive revenue performance has continued into this year, data for the first five months of the year shows the public finances are performing well. At the same time current expenditure is forecast to be broadly unchanged compared to the Budget forecast. Once we take account of our forecasts on the capital side, where we expect some reductions in capital expenditure, (including lower non-voted capital spending to take account of the agreement with regard to the March promissory note payment), the exchequer deficit will be lower than previously anticipated at €16 billion.
The more important measure, and the one used for the targets under the EU/IMF programme, is the General Government Balance. The General Government Balance (GGB) measures the fiscal performance of all arms of government, takes account of the impact of various funds, including extra budgetary funds, non-commercial State sponsored bodies, the Social Insurance Fund and the net borrowing of the local government sector, as well as the impact of the National Pension Reserve Fund, and accrual adjustments. Although economic activity is forecast to show only moderate growth, we expect that the fiscal targets for 2012
will be met. This is based on the view, expressed in our previous Commentary,
that the negative impact of new taxation measures on revenue would be less than anticipated at the time of the Budget. In addition, the public finances will also benefit this year from higher income from Emergency Liquidity Assistance interest, paid initially to the Central Bank in 2011 and then transferred to the Exchequer this year. Thus, the final outturn for 2012 will meet the revised target of 8.3 per cent. The referendum result means that the fiscal profile over the next
Turning to 2013, we expect that higher tax revenue from economic growth and consolidation measures combined with a moderate reduction in expenditure should result in an exchequer balance in line with current projections.
At present a consolidation package of €3.5 billion is targeted for 2013. However, the ending of the interest payment holiday will mean that the impact on the general government balance will be much lower than the total consolidation amount. Although we expect stronger economic growth next year compared with this year we have revised our forecast for growth down compared with the Spring
Commentary. These factors will make the target for 2013 more difficult to achieve.
TABLE 5 Exchequer Finances
2010 2011 2012 2013
Outcome
€bn Outcome €bn Forecast €bn Forecast €bn Net current expenditure 47.0 48.0 49.6 49.4
Net voted expenditure 40.5 41.4 41.0 40.0
Non-voted expenditure 6.5 6.6 8.6 9.4
Current Revenue 34.4 36.8 38.5 40.5
Tax revenue 31.8 34.0 35.5 37.5
Non-Tax revenue 2.7 2.8 3.0 3.0
Current Budget Balance -12.6 -11.2 -11.1 -8.9
Capital Resources 1.8 2.5 1.8 1.8
Capital Expenditure 8.0 16.2 7.0 7.6
Capital Expenditure - Voted 5.9 4.3 3.6 3.0
Capital expenditure - non voted 2.0 11.9 3.4 4.6
Capital Budget Balance -6.2 -13.7 -5.2 -5.9
Exchequer Balance -18.7 -24.9 -16.3 -14.8
as % of GDP -12.0 -15.9 -10.0 -8.7
General Government Balance -48.6 -20.5 -13.3 -12.5
as % of GDP -31.2 -13.1 -8.3 -7.5
Note: The Exchequer Balance figure for 2012 is adjusted to take account of the arrangement made for the March promissory note payment of €3 billion.
Population and the Labour Market | 13
6
Population and the Labour Market
Both the Live Register and the Quarterly National Household Survey (QNHS) show
that unemployment remains at a very high level. QNHS data for 2011 show that
the numbers at work in 2011 fell by 38,000 and the labour force fell by 26,000. At the same time the participation rate stabilised at just over 60 per cent and the numbers unemployed rose by close to 13,000 with the unemployment rate measured at 14.4 per cent in 2011.
It is clear from the data that the labour market continued to weaken in 2011, with another large fall in the numbers employed and an increase in the numbers
unemployed. The latest QNHS data for quarter 1, 2012 suggests that this
weakening has continued, with the unemployment rate rising to 14.8 per cent. With employment across most sectors continuing to weaken, albeit at a more moderate pace, an annual average level of employment in 2012 of 1,797,000 is forecast. This represents a fall of 13,000. Although aggregate employment is expected to fall, we expect that 2012 should see stabilisation in some sectors, for example, industrial employment should stabilise on the back of continued growth in industrial output and exports. With stronger economic growth in 2013 the falls in employment should be much more moderate at just 5,000 and could be seen to represent a stabilisation of the overall labour market.
TABLE 6 Employment and Unemployment
Annual Averages, 000s
2010 2011 2012 2013
Agriculture 85 83 81 81
Industry 360 342 338 339
of which: Construction 120 107 103 102
Services 1,403 1,385 1,376 1,371
Total at work 1,848 1,810 1,797 1,792
Of which: non-agri. employees 1,446 1,427 1,420 1,420
Others 317 300 295 290
Unemployed 292 304 315 308
Labour Force 2,140 2,114 2,112 2,100 Unemployment Rate, % 13.6 14.4 14.9 14.7
Source: Central Statistics Office and ESRI Forecasts
Of particular concern is the on-going rise in the numbers who are unemployed for over a year. In the first quarter of 2007 the long-term unemployment rate was 1.2 per cent, approximately 26,000 persons. By the first quarter of 2012 this had risen to 8.9 per cent, increasing to over 187,000 persons. Those who are long-term unemployed now account for nearly 61 per cent of total unemployment, see Figure 3.
FIGURE 3 Numbers Unemployed By Duration
Source: Central Statistics Office, Quarterly National Household Survey. 0
50 100 150 200 250 300 350
2007Q1 2008Q3 2010Q1 2011Q3
N
um
be
r U
ne
m
pl
oy
ed
(0
00
s)
Population and the Labour Market | 15
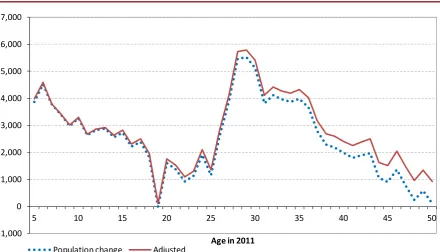
Data from the QNHS provides us with some more detail on those who are
long-term unemployed. While there have been increases in the number of those unemployed for over a year across gender and available age bands, the main increase is in those aged between 25-44 years, primarily males, see Figure 4.
FIGURE 4 Long-Term Unemployed by Age and Gender, Percentage Distribution and 000s
Source: Constructed with data from the Quarterly National Household Surveys, CSO. 0 10 20 30 40 50 60 70 80 90 100
Q1 2007 Q4 2011 Q1 2007 Q4 2011
Males Females Lo ng T er m U ne m pl oy ed ( % )
Age 15-24 Age 25-34 Age 35-44 Age 45 Plus
0 20,000 40,000 60,000 80,000 100,000 120,000 140,000
Q1 2007 Q4 2011 Q1 2007 Q4 2011
Males Females Lo ng T er m U ne m pl oy ed (0 00 s)
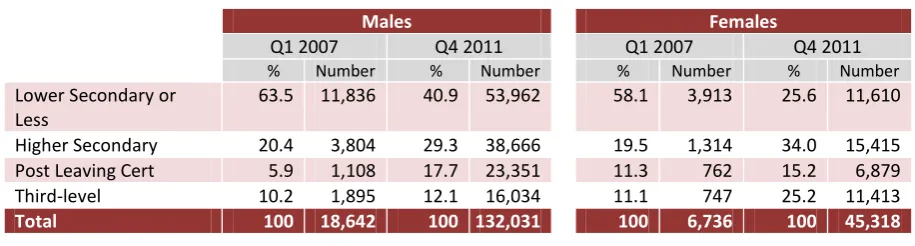
Table 7 updates analysis by Kelly et al. (2012) 2 showing the educational
attainment of those who are long-term unemployed separately by gender. Prior to the current crisis, the education profile of long-term unemployed (LTU) males and females was quite similar, with over 50 per cent of both groups having low levels of educational attainment (i.e. Junior Certificate or less). However, the education composition of the long-term unemployed has changed considerably since the commencement of the recession. Now less than half of long-term unemployed males and females have low levels of educational attainment, while there has been a rise in the percentages with higher levels of education. In relation to males, there has been a big increase in the proportions with Post-Leaving Certificate qualifications, which is most likely due to the downturn in the construction sector. Regarding females, there has been a large rise in the percentages with a Leaving Certificate and Third-level qualification. Based on the numbers (see Table 7), it would appear that in the current recession females with low levels of educational attainment are withdrawing from the labour force, while those with higher levels of education are remaining in the labour market.
TABLE 7 Educational Attainment of the Long-Term Unemployed: Q1 2007 and Q4 2011 (Per Cent)
Males Females
Q1 2007 Q4 2011 Q1 2007 Q4 2011
% Number % Number % Number % Number
Lower Secondary or
Less 63.5 11,836 40.9 53,962 58.1 3,913 25.6 11,610 Higher Secondary 20.4 3,804 29.3 38,666 19.5 1,314 34.0 15,415 Post Leaving Cert 5.9 1,108 17.7 23,351 11.3 762 15.2 6,879 Third-level 10.2 1,895 12.1 16,034 11.1 747 25.2 11,413
Total 100 18,642 100 132,031 100 6,736 100 45,318
Source: Constructed with data from the Quarterly National Household Surveys, CSO.
2 Kelly, E., S. McGuinness and P. O'Connell, (2012) "Submission to the Joint Committee on Jobs, Social Protection and
[image:26.595.70.528.382.505.2]Incomes and Prices | 17
7
Incomes and Prices
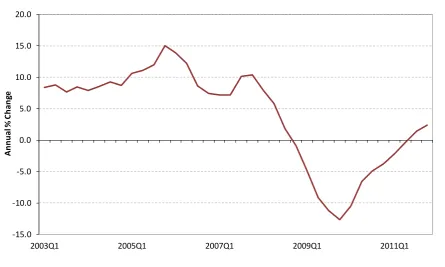
Data from the Institutional Sector Accounts on aggregate income of employees
provides information for 2011 that is consistent with the National Accounts. Figure 5 shows the annual rate of change in each quarter and illustrates the extent to which household incomes fell during the downturn. The data shows that economy wide earnings remained broadly unchanged in 2011, although the annual number masks the fact that earnings started to increase slightly in the second half of the year, the first increase since the end of 2008. Although the economy and labour market remain weak there has been a steady flow of job announcements, primarily in the modern sector. On the expectation that many of these jobs will have pay rates higher than the jobs that have been lost, hence raising average earnings in the economy as a whole, we would expect that aggregate non-agricultural wages will remain unchanged in 2012, at a time when employment continues to fall.
FIGURE 5 Annual Percentage Change in Compensation of Employees
Source: Central Statistics Office, Quarterly Institutional Sector Accounts. -15.0
-10.0 -5.0 0.0 5.0 10.0 15.0 20.0
2003Q1 2005Q1 2007Q1 2009Q1 2011Q1
Ann
ua
l %
C
ha
ng
[image:27.595.78.524.437.704.2]TABLE 8 Personal Disposable Income
2010 2011 2012 2013
€ bn € bn € bn € bn Agriculture, etc 2.7 3.0 3.1 3.2 Non-Agricultural Wages 68.8 69.0 68.9 69.0 Other Non-Agricultural Income 16.7 15.1 17.1 18.0
Total Income Received 88.2 87.1 89.1 90.2 Current Transfers 26.5 26.6 25.9 25.6
Gross Personal Income 114.7 113.7 114.9 115.9 Direct Personal Taxes 20.8 22.2 23.1 23.9
Personal Disposable Income 93.9 91.5 91.8 91.9
Consumption 82.6 81.1 80.7 81.6
Personal Savings 11.3 10.4 11.1 10.3 Savings Ratio 12.0 11.4 12.1 11.3 Average Personal Tax Rate 18.1 19.5 20.1 20.6
Source: Central Statistics Office and ESRI Forecasts
Taking account of transfers and taxes means that we estimate personal disposable income fell by 2.5 per cent in 2011. Although personal consumption is still contracting, the personal saving rate fell from about 12 per cent in 2010 to 11.4 per cent in 2011. As shown in the accompanying note on the savings rate during the recession the fall in household income, at a time when housing related expenditure has risen, has reduced the available resources for households. However, if our forecast improvement in activity occurs then we would expect to see a moderate increase in personal disposable income of approximately 0.3 per cent in 2012 and 0.1 per cent in 2013.
Consumer Prices
Imports and the Balance of Payments | 19
8
Imports and the Balance of Payments
The weakness in the domestic economy is reflected in the performance of imports of goods and services last year. Based on the preliminary National Accounts, imports of goods and services contracted by 0.7 per cent in volume terms in 2011.
Trade statistics show that visible imports rose by 5.2 per cent in value, although they declined by 3.1 per cent in volume terms. Within this, the value of imports of capital goods fell, while both consumer goods and intermediate goods increased. Given the weakness of the personal sector, the increase in consumer goods imports is somewhat surprising, although the increase in intermediate goods is in line with the performance of production and exports. Based on data from the Balance of Payments, payments of royalties and other service imports showed a modest rise in 2011.
Given our expectation of a weaker external environment with consequent slower growth in production and exports, and continuing weakness in consumer demand, we anticipate that merchandise imports will decline by approximately 1 per cent this year. The continuing contraction in personal consumption is expected to feed through into imports of consumer goods, while recovery in investment in machinery and equipment and continuing export growth will be reflected in imports of capital and intermediate goods. Tourism imports are expected to contract at broadly the same rate as in 2011, but with manufactured exports likely to grow marginally slower, a more moderate rate of growth in royalties and other services seems likely. On this basis, we expect that total imports of goods and services will return to moderate growth in 2012, increasing by 0.9 per cent in volume terms and by 3.3 per cent in value.
TABLE 9 Imports of Goods and Services, % change, Volume
2011 2012 2013
% % %
Merchandise -3.1 -0.9 2.0
Tourism -6.0 -7.0 -5.0
Other Services 1.1 2.5 3.5
Imports of goods and services -0.7 0.9 2.6
Source: Central Statistics Office and ESRI Forecasts
On the basis of the preliminary Balance of Payments, the merchandise trade surplus was unchanged in 2011 at €36.4 billion. The service trade balance remained in deficit, although more moderate than the previous year. Taking account of both these components the surplus on trade in goods and services rose by nearly 14 per cent to €33.2 billion. Once account is taken of income flows a marginal surplus of just €0.1 billion was recorded.
GDP and GNP | 21
9
GDP and GNP
Preliminary estimates from the CSO show that GDP in volume terms grew by 0.7 per cent in 2011. In contrast, GNP declined by 2.5 per cent in the year. In previous
Commentaries we have discussed the alternative measures of output available.3
While GDP measures the total value of output of goods and services produced in a country, GNP subtracts net income flows between Ireland and the rest of the world. What is striking is the gap between the two measures, with one suggesting marginal growth while the other would indicate that the economy contracted in 2011. The main factor underlying this difference is a large increase in net factor flows. The quarterly data shows that this was particularly pronounced in the final quarter of 2011, although this is compared with much lower flows in the fourth quarter of 2010, see Figure 6.
FIGURE 6 Expenditure on GDP, Net factor Flows and GNP, Quarterly Data, Constant Prices
Turning to this year and next we expect GDP to increase in 2012 at about the same rate as in 2011, at 0.6 per cent but to increase faster in 2013, at 2.2 per cent on the assumption of a better international environment. GNP is forecast to remain unchanged this year and to increase by 0.5 per cent in 2013.
3 For example, see Box 2: Measures of Output, Quarterly Economic Commentary, Spring 2011.
-10,000 -5,000 0 5,000 10,000 15,000 20,000 25,000 30,000 35,000 40,000 45,000
2009Q1 2010Q1 2011Q1
€
(M
ill
io
n)
Monetary Sector Developments | 23
10
Monetary Sector Developments
Bank Funding
Looking at evidence relating to the liabilities of the Irish banking system, the overall picture of recent Irish deposit movements that emerges is one of a stabilisation in mid-to late-2011, followed by a steady increase in private deposits held at covered banks thereafter (see Appendix 1 on Developments in Irish Private Sector Deposits). Market-based funding pressures remain elevated, however, and despite successful deleveraging progress made in 2011, Irish banks face a sizeable task in reducing their balance sheets amidst an increasingly less benign international environment.
Irish bank deleveraging required in the EU-IMF programme is effectively intended to wean Irish credit institutions off the substantial provision of Exceptional Liquidity Measures (ELM) currently availed of. Reduced borrowing from the ECB is primarily targeted for the covered (non-IBRC) banks, with further reductions likely to depend on what happens to IBRC rather than the act of deleveraging
alone.4 It is also expected that more sustainable sources of market-based funding
will become available to Irish institutions once their loan books are more closely aligned with stable sources of funding like those of customer deposits (both retail and corporate) and once the sovereign begins to return to the market. This access to funding depends on the eurozone interbank market beginning to function smoothly once again. However, as of yet, this seems far off.
Total emergency funding measures stood at close to €118 billion as of end-April 2012, roughly 65 per cent (€77 billion) of which was ECB funding with the
remainder coming from the Central Bank of Ireland.5 This represents a decline in
overall ELM provided to Irish banks of €40.5 billion from the €158.8 billion peak reached in February 2011 shortly after the EU-IMF programme was agreed. While deleveraging targets for 2011 were exceeded with terms that were better than anticipated, the environment for asset disposals is expected to worsen over the
4 The Covered Banks include AIB Group (including EBS Building Society), Bank of Ireland Group, Permanent TSB and
IBRC.
5 This includes Emergency Liquidity Assistance provided by the Central Bank of Ireland which makes up the majority of
next two years.6 As much as €2 trillion in balance sheet reduction measures
across the EU banking system are expected during 2012 and 2013, with up to three-quarters of the reduction measures expected to come from sales of
subsidiaries, securities and noncore assets.7 Such measures are likely to impact
on the capacity of Irish banks to sell assets and the sale prices achieved. They are also likely to result in more widespread negative impacts on economic activity,
particularly in terms of global credit supply.8
In addition, the latest IMF staff report noted concerns that targets for banks loan-to-deposit ratios have bid up deposit rates, thus undermining bank income, while larger than expected run-offs of banks' non-core loan portfolios are also threatening to constrain domestic credit conditions. Existing deleveraging targets may, therefore, be altered later this year in order to separate out the targets into those for core and non-core assets so as to minimise such negative side-effects. Any engagement in substantial new lending will be to the detriment of the loan-to-deposit ratio target of 122.5 per cent being achieved by end-2013.
Given the requirement for further deleveraging to the tune of some €36 billion over the remainder of 2012 and 2013, along with an increasingly less accommodating international environment for asset disposals, a danger to the Irish recovery is that of Irish banks failing to replace maturing loans with new lending as an alternative means of achieving their official balance sheet reduction targets. This could potentially stifle the economic recovery further over the next two years as the deleveraging process continues. The rationale for the policy of deleveraging is ultimately to reduce the reliance on ECB funding and to make banks more attractive to market-based forms of financing. Current EU policies appear to be failing to relieve pervasive stresses in eurozone money markets, however. On this basis, it is worth considering whether the end-2013 target for the deleveraging programme will actually yield a banking system that is more conducive to sustainable market-based financing at that time, given the current likelihood that these stresses are likely to remain in the near future.
6 See IMF staff report: Ireland: Fifth Review under the Extended Arrangement, International Monetary Fund, February
2012.
7 Global Financial Stability Report, International Monetary Fund, April 2012, pp.6,33.
8 See also the Euroframe report: 'Economic Assessment of the Euro Area: Winter 2011/2012 Report', Euroframe
Monetary Sector Developments | 25
Recent Lending Developments:
Private Sector Credit
After adjusting for non-transaction related effects, private sector lending conditions were seen to have deteriorated significantly during the first three months of 2012, with overall lending down 5.2 per cent, when compared to the
same period of 2011 (see Table 10).9 In terms of the average pace of contraction
for the first three months of the year, lending fell at its fastest annual rate in any quarter since overall lending began to fall in August 2009, down by 5.4 per cent. Within the overall fall in lending, loans to households declined at a slower pace than the experience in late 2010, yet the average pace of contraction over the past three months remained quite brisk. Mortgage lending, in particular continues to shrink rapidly, while consumer credit returned to a sharp rate of contraction after a slowdown in December 2011. The slowdown in December was largely the result of a base effect following a sharp decline in lending in the same month of 2010. However, the recent trend is still one of sustained declines.
TABLE 10 Private Sector Credit and Small and Medium Enterprise Lending, Annual % change
Private Sector Credit Small and Medium Enterprise Lending
End-
Month Total Household Credit Residential Mortgage Lending
Consumer
Credit Total excl. Financial Intermediation & Property Related Sectors Total excl. Financial Intermediation Total
2009 Mar 3.8 6.0 7.8 -0.6 - - -
Jun 0.5 2.9 4.8 -3.6 - - -
Sep -2.3 0.2 1.9 -5.4 - - -
Dec -2.6 -1.1 0.6 -7.3 - - -
2010 Mar -4.0 -2.6 -0.2 -10.6 - - -
Jun -3.7 -4.5 -0.8 -13.1 - - -
Sep -3.8 -4.5 -0.9 -14.1 - - -
Dec -4.5 -5.5 -1.4 -21.1 - - -
2011 Mar -3.9 -5.0 -2.0 -15.0 -9.2 -11.3 -8.8 Jun -4.7 -3.9 -2.2 -14.4 -10.6 -12.5 -9.1 Sep -4.6 -4.0 -2.5 -13.7 -9.0 -8.4 -5.6 Dec -5.2 -3.6 -2.5 -6.9 -6.4 -5.7 -3.3
2012 Mar -5.2 -3.9 -2.4 -11.6 - - -
Source: Central Bank of Ireland Money and Banking Statistics.
Looking at corporate lending, in particular lending to Small and Medium Enterprises (SMEs), the rate of contraction appears to have slowed somewhat
during the final quarter of 2011.10 Total SME lending declined by 3.3 per cent
9 The adjustment reflects changes in non-transaction related reporting population, revaluations, exchange rates. 10 As noted by Lawless, McCann and McIndoe-Calder (2012), Central Bank of Ireland (Quarterly Bulletin 2, April 2012),
year-on-year, yet core lending (i.e. that which excludes financial intermediation and property related sectors) continues to indicate substantial rates of decline, albeit slower than in any other period in 2011.
The latest ECB Bank Lending Survey suggests that, across all categories of enterprises, both rising credit standards and reduced demand have begun to
contribute to a modest deterioration in average lending.11 In this survey, changes
in credit standards over the past three months are examined, with respondents indicating to what extent they feel that credit standards have deteriorated or eased over the recent quarter. Commercial respondents had previously reported that credit conditions in Irish banks were broadly stable for nearly two years after a more difficult lending environment emerged around mid-2007. Generalised risk perceptions (e.g. economic, collateral-based and industry or firm specific risks) appear to have been the foremost issues reported amongst borrowers during the past two years as impacting on credit standards. Terms and conditions attached to lending are reportedly now less benign than they have been in the past year. Recent research on Irish SME lending conditions based on the ECB survey on access to finance of SMEs in the eurozone also shows that, while demand for credit is relatively similar to that in other EU member states, Irish SMEs face
significantly tighter financing conditions, by comparison.12
A recently increased sensitivity to risk, however, has also seen a corresponding fall in reported demand from businesses for credit. The latest survey indicates that financing needs, in particular those relating to investment, are now more subdued than in 2011. As such, recent uncertainties relating to wider economic developments may be dampening both the demand and supply of credit. A strong correlation between the survey's reported change in demand for loans and credit lines for Irish SMEs and the index of consumer expectations on a quarterly basis over the period (Q1 2003 to Q1 2012) lends some support to the idea that weakening economic expectations amongst Irish residents may be impacting on
demand for credit from indigenous enterprises.13
The survey also suggests that household credit has tightened further more recently, with both supply of and demand for credit reportedly deteriorating. Conditions attached to loans have been more stringent over the last three
11 The ECB's Euro Area Bank Lending Survey supplements existing quantitative data by giving some impression of the
willingness of banks to lend, reflected in changes in their credit standards and in terms and conditions attached to loans or lines of credit. It is addressed to senior lending officers in participating banks, with over 100 euro area banks participating in the survey on a voluntary basis each three month period, of which 5 are from Ireland.
12 Holton, S., M. Lawless and F. McCann (2012). 'Credit demand, supply and conditions: A tale of three crises'.Paper
presented to the Central Bank of Ireland conference, 'The Irish SME Lending Market: Descriptions, Analysis, Prescriptions'. Central Bank of Ireland, March 2012.
Monetary Sector Developments | 27
periods observed, driven by stricter mortgage lending requirements, mainly in terms of loan-to-value ratios, but also maturity lengths. Again, this is reportedly due to heightened risk perceptions related to economic activity as well as housing market prospects. The deterioration in reported demand for loans for house purchases, which had moderated gradually from late-2008 onwards and actually recorded a modest improvement in mid-2011, is again contributing negatively to new lending. However, the demand for loans, when considered in terms of a twelve month moving average, remains far closer to neutral, when compared to recent years. As Figure 7 shows, the extent to which funding conditions are tightening relative to demand conditions appears to have been more significant of late in determining new lending.
FIGURE 7 Reported Change in Funding Conditions (12 Month Moving Average)
Source: ECB Bank Lending Survey. 1.5 2.0 2.5 3.0 3.5 4.0 4.5
Ja
n Jul
Ja
n Jul
Ja
n Jul
Ja
n Jul
Ja
n Jul
Ja
n Jul
Ja
n Jul
Ja
n Jul
Ja
n Jul
Ja
n
2003 2004 2005 2006 2007 2008 2009 2010 2011 2012
Demand for Loans for House Purchase Change in Credit Standards Tied to House Purchases Easing (>3.0)
Unchanged (=3.0)
11
General Assessment of the Irish Economy
Economic Growth
The preliminary National Accounts for 2011 show much weaker growth than we
had anticipated at the start of the year. The main cause of this was the deterioration in the international environment during the second half of last year and the deterioration in the terms of trade. Concerns about the international environment heightened uncertainty. The recovery in activity in the first half of 2011 gave way to a subsequent contraction.
Since our last Quarterly Economic Commentary, forecasts for the international
environment have been revised downwards and a contraction in eurozone activity is now expected this year. In recent years most, if not all, of the growth in the Irish economy has been due to the external sector. All indications are that domestic demand will contract again this year, the fifth consecutive year of contraction. Once again the principal factor determining the performance of the Irish economy will be the export sector. On the basis of the forecasts outlined in
this Commentary we expect that the Irish economy will show only very moderate
GDP growth in 2012 in volume terms. Taking account of our estimates for net factor flows means that we expect GNP to be unchanged this year.
The current view is that there should be a recovery in economic activity levels internationally in 2013. The openness of the Irish economy coupled with the steady inflows of FDI and the gains in competitiveness in recent years means that Ireland should, as in the past, benefit from any international upturn. On the assumption that the international recovery starts in the second half of this year and is sustained into 2013 we would expect that domestic demand, including stocks, should show moderate growth next year. Combined with an upturn in export volumes we anticipate that the Irish economy will grow by 2.2 per cent in 2013, as measured by GDP, and by 0.5 per cent when measured by GNP.
General Assessment of the Irish Economy | 29
policies that are put in place to deal with the long-term unemployment issue (see
Kelly et al., 2012) 1, along with the extent of competition from new entrants to
the Irish labour market.
Confidence and Consumption
In previous Commentaries we had argued that a fall in the savings rate could help
to boost personal consumption. Within the Irish economy personal consumption levels have fallen in recent years and continue to contract. At the same time the savings rate has risen sharply, as households seek to pay down debt and build up precautionary savings in an uncertain environment. It is hoped that an increase in consumer confidence will result in households starting to spend, thereby bringing about a stabilisation in and a consequent recovery in personal consumption. However, the analysis in the accompanying Research Note, "The Savings Rate during the Recession" suggests that any sustained upturn in confidence may only bring about a moderate improvement in consumer spending. Using data from the
recent Household Budget Survey the note shows that, in addition to the falls in
income, household resources have been reduced by the rise in mortgage repayments over the period 2004/05 to 2009/10. Expenditure on other items fell as households sought to maintain mortgage repayments. Thus, our view is that the current weakness of consumer spending combines both weak confidence and reduced resources. In recent months we have seen consumer sentiment improve somewhat. A closer examination reveals that this has primarily been the result of improving expectations while consumers remain concerned about their current situation. Ultimately improvements in sentiment will feed through into consumer spending. However, the relationship is more complex and may not bring about a significant rise in consumer spending in the short term, until improvements in disposable income occur.
The Eurozone Crisis
Given the risks posed to our forecasts stemming from renewed tensions in the eurozone, it is worth reflecting on the broader developments in recent times. We have remarked before that as the current situation represents an extraordinary set of circumstances it requires an extraordinary solution. We have argued that one element of the solution involves direct recapitalisation of the eurozone banking system. This would restore confidence to the eurozone banking system and lead to the interbank market functioning again. This is an essential requirement to restore confidence in the banking system and to provide funding for credit. Two arguments against this have been produced viz. the inflation impact and the moral hazard issue. Recapitalisation may lead to an increase in
1 Kelly, E., S. McGuinness and P. O'Connell, 2012, "Submission to the Joint Committee on Jobs, Social Protection and
M1 but will not enter the broader money supply process. Even if recapitalisation was excessive and the monetary base was added to by 2-5 per cent the
inflationary impact of this over 2-3 years would be low.2 The loss of output from
the continued high level of unemployment in a single year dwarfs any potential output loss from a temporary rise in the inflation rate. The moral hazard argument must confront the reality that this crisis has seen the fall of governments, inaction may lead to further falls, but more importantly no government could wish to visit the collapse in real incomes that has afflicted so many countries. The moral hazard argument is essentially about the future and it is possible to set up structures to limit the impact caused by the consequences of moral hazard. The Fiscal Compact is an example of this. It is necessary, however, to accept that there is an actual crisis today that needs an immediate solution. The provision of funds to Spain for recapitalisation has the potential to do this but it looks like an ad hoc approach and somewhat different in the terms and conditions that applied to others in receipt of funding.
A Stimulus Package
We have also argued before that, given the circumstances in the eurozone - the level of unemployment and the stagnation in output - expansionary fiscal and monetary policies are needed. At the fiscal level this requires coordinated policies, with those governments capable of providing a stimulus doing so. This is what a single government would do. This approach, taken in conjunction with a recapitalisation of the eurozone banking system discussed above, offers the best hope for dealing with the output, unemployment and financial crises. The actual approach within the eurozone seems to rely on structural adjustment in labour and product markets as the sole means of dealing with the output and unemployment crisis, without accepting that the "internal devaluation" required by some countries involves cuts in incomes that are outside any previous ranges. Structural adjustment requires a long-term perspective to be successful so that looking to structural adjustment in the face of stagnant demand is likely to fail as a policy for the eurozone as a whole. At the present stage of the crises it seems unlikely that a coordinated set of fiscal policies will be adopted. Unfortunately, if any single government attempts a fiscal expansion alone, it would find it difficult if not impossible to finance. Thus, for a single country within the eurozone, economic growth is not a policy option. The debate "austerity or growth" is not a real debate as no government would prefer austerity to growth. Governments individually do not have the option to choose. In reality coordinated fiscal policies across the eurozone, recapitalisation of the eurozone banking system and a looser monetary policy, with some imaginative measures designed to reduce
2 For example, the recent discussion of the impact of quantitative easing policy in the UK by Joyce, M., M. Tong and R.