A real time tracking system using RFID in Mecca : a thesis presented in partial fulfilment of the requirements for the degree of Master of Engineering in Electronics and Computer Systems Engineering
98
0
0
Full text
(2) A Real-Time Tracking System using RFID in Mecca A Thesis Submitted in partial fulfilment of the requirements for the degree of. Master of Engineering In Electronics and Computer Systems Engineering By. NEZAR AMER ALNIZARI. School of Engineering and Advanced Technology, Massey University, Turitea Campus, Palmerston North, October 2011.
(3) ABSTRACT Muslims from all over the world visit the holy city of Mecca in Saudi Arabia every year to perform the Hajj, which is the largest annual pilgrimage in the world. Ministry of Hajj statistics have shown that the number of pilgrims is increasing annually. The continuous increase has made the Hajj more difficult for the pilgrims and the authorities. Many pilgrims die and get injured every year due the congestion. Therefore, new technologies have become critical to control the crowds. Recently a few projects have been conducted in Mecca. However, the need for more practical and economical solutions is still required.. The aim of this project is to track missing people and determine their current location on a map during the season of the Hajj. This project is mainly aimed at children and elderly. However, the system can also be implemented in many different places including airports, shopping malls, parks, offices and industrial fields, and it also can monitor assets as well as people.. i.
(4) “ This thesis is dedicated to all of those who have died in the Hajj and their families ”. ii.
(5) ACKOWLEDGEMENTS First and foremost, I am greatly expressing all praise to ‘Allah’ the most merciful, for helping me in putting this work together. I could never have done this without the faith I have in you.. I would like to extend deep thanks to my supervisor Professor Subhas Mukhopadhyay for his support, patience and encouragement during this project. I am lucky to have had such an active and hardworking supervisor.. My gratitude goes to the Saudi government, the Ministry of Higher Education and the Saudi Culture Mission in Australia for granting me the scholarship.. Finally, I would like to extend my everlasting love and appreciation to my parents, sisters and brother for their constant support and prayers.. iii.
(6) CONTENTS Abstract. i. ACKOWLEDGEMENTS. iii. CONTENTS. iv. LIST OF FIGURES. viii. LIST OF TABLES. x. CHAPTER 1 INTRODUCTION 1.1. Introduction .................................................................................................................. 2. 1.2. Radio frequency identification ..................................................................................... 2. 1.3. The Hajj season ............................................................................................................ 2. 1.4. Problem definition ....................................................................................................... 3. 1.5. The aim of the project .................................................................................................. 3. 1.6. Organization of the thesis ............................................................................................ 3. CHAPTER 2 LITERATURE REVIEW 2.1. Mecca and Hajj ............................................................................................................ 5. 2.1.1. Pilgrimage sites ............................................................................................................ 6. 2.1.2. Sequence of the hajj journey ........................................................................................ 7. 2.2. Existing technologies ................................................................................................... 9. 2.3. RFID technology ........................................................................................................ 10. 2.3.1. RFID tags ................................................................................................................... 11. 2.3.1.1 Passive RFID tags ...................................................................................................... 11 2.3.1.2 Active RFID tags ....................................................................................................... 11 2.3.2. RFID reader ............................................................................................................... 12. 2.3.2.1 Hand-held reader ........................................................................................................ 12 2.3.2.2 Fixed reader installed in area ..................................................................................... 13 2.3.2.3 Fixed reader installed at chokepoint .......................................................................... 13 2.3.3. RFID PC reader ......................................................................................................... 13. 2.4. Comparison of positioning systems ........................................................................... 13. iv.
(7) CHAPTER 3 SPECIFICATION AND DESIGN OF THE SYSTEM 3.1. Introduction................................................................................................................. 16. 3.2. Synapse RF engine...................................................................................................... 16. 3.3. Evaluation Kit ............................................................................................................. 18. 3.3.1. SNAPstick................................................................................................................... 18. 3.3.2. SNAP Node................................................................................................................. 18. 3.3.3. ProtoBoard ................................................................................................................. 18. 3.3.4. Portal software ............................................................................................................ 19. 3.4. System structure .......................................................................................................... 19. 3.4.1. Tag ............................................................................................................................. 20. 3.4.2. Reader ........................................................................................................................ 23. 3.4.3. Pc reader node............................................................................................................. 25. 3.4.4. Pc serial to http converter ........................................................................................... 27. 3.4.5. Display GUI ................................................................................................................ 27. 3.4.6. My SQL ..................................................................................................................... 28. 3.5. Key consideration for developing the system ............................................................. 29. CHAPTER 4 TRILATERATION METHOD 4.1. Positioning In Wireless Sensor Networks................................................................... 31. 4.1.1. Multilateration ............................................................................................................ 31. 4.1.2. Triangulation............................................................................................................... 31. 4.1.3. Fingerprinting ............................................................................................................. 31. 4.1.4. Trilateration ................................................................................................................ 32. 4.2. Received Signal Strength Indicator (RSSI) ............................................................... 32. 4.3. The mathematics of the trilateration method .............................................................. 34. 4.4. Trilateration field experiment ..................................................................................... 36. CHAPTER 5 HARDWARE AND SOFTWARE IMPLEMENTATION 5.1. Readers positioning..................................................................................................... 38. 5.1.1. Introduction................................................................................................................. 38. 5.1.2. Reader node coverage experiment .............................................................................. 39. 5.1.3. Positioning results ....................................................................................................... 41. 5.2. Mesh network test ....................................................................................................... 42. 5.3. Tag battery life test ..................................................................................................... 45. 5.4. Battery charge time calculation .................................................................................. 46. v.
(8) 5.5. System implementation............................................................................................... 48. 5.5.1. Step one: Placing the readers ...................................................................................... 48. 5.5.2. Step two: Uploading the maps .................................................................................... 49. 5.5.3. Step three: Locating the reader node on the map ........................................................ 49. 5.5.4. Step four: adding the tags ........................................................................................... 51. 5.6. Efficiency of the system in a dynamic environment experiment ................................ 52. CHAPTER 6 SIMULATION RESULTS 6.1. Introduction. .......................................................................................................... 55. 6.2. Node types .................................................................................................................. 55. 6.2.1. Coordinator ................................................................................................................. 55. 6.2.2. Router ....................................................................................................................... 55. 6.2.3. End Device.................................................................................................................. 55. 6.3. Network Topologies ................................................................................................... 56. 6.3.1. Star Topology ............................................................................................................. 56. 6.3.2. Tree Topology............................................................................................................. 56. 6.3.3. Mesh Topology ........................................................................................................... 56. 6.4. The IEEE 802.15.4 Simulation Model ........................................................................ 57. 6.4.1. Physical layer .............................................................................................................. 57. 6.4.2. MAC layer .................................................................................................................. 57. 6.4.3. Network layer ............................................................................................................. 58. 6.4.4. Application layer......................................................................................................... 58. 6.4.5. Battery model .............................................................................................................. 58. 6.5. Random Mobility ........................................................................................................ 58. 6.6. The Simulation Setup.................................................................................................. 59. 6.7. Simulations and results ............................................................................................... 61. 6.7.1. Throughput.................................................................................................................. 61. 6.7.2. Dropped packets ......................................................................................................... 62. 6.7.3. End-to-end delay ......................................................................................................... 63. 6.7.4. Radio receiver business and collision status ............................................................... 63. 6.7.5. Total traffic received ................................................................................................... 64. 6.8. Conclusion .................................................................................................................. 64. vi.
(9) CHAPTER 7 DISCUSSION, CONCLUSION AND FUTURE WORK 7.1. Conclusion And Future Work ..................................................................................... 66. CHAPTER 8 REFERENCES. FULL FORM OF ABBREVIATED TERMS IN THE THESIS ............................................. 71 Appendix A .............................................................................................................................. 72 A.1 Tag python script .............................................................................................................. 72 A.2 Reader node python script................................................................................................. 74 A.3 PC reader node python script ............................................................................................ 74 Appendix B – trilateration code ............................................................................................... 76 Appendix C .............................................................................................................................. 81 C1. SYNAPSE RF Engine ....................................................................................................... 81 C2. SYNAPSE Portal............................................................................................................... 83 C3. SYNAPSE Evaluation Kit ................................................................................................. 85. vii.
(10) LIST OF FIGURES Figure 2.1: Hajj statistics ........................................................................................................... 5 Figure 2.2: Pilgrimage sites ....................................................................................................... 6 Figure 2.3: The Tawaf ritual ...................................................................................................... 7 Figure 2.4: Safa and Marwah ..................................................................................................... 7 Figure 2.5 Ramy al-jamarat rituals (stoning of the devil) ......................................................... 8 Figure 2.6: RFID Pilgrim Identification System ........................................................................ 9 Figure 2.7: The main window of Hajj-QAES .......................................................................... 10 Figure 2.8: The crowd simulation results ................................................................................ 10 Figure 3.1: Synapse RF Engine dimensions ........................................................................... 16 Figure 3.2: Synapse RF Engine ............................................................................................... 17 Figure 3.3: SNAPstick ............................................................................................................. 18 Figure 3.4: SNAP Node ProtoBoard ........................................................................................ 18 Figure 3.5: Portal software ....................................................................................................... 19 Figure 3.6: System structure .................................................................................................... 20 Figure 3.7: Tag’s structure ....................................................................................................... 21 Figure 3.8: Prototypes of the tag .............................................................................................. 21 Figure 3.9: Tag enclosure ........................................................................................................ 21 Figure 3.10: Tag’s code ........................................................................................................... 22 Figure 3.11: Reader node’s structure ....................................................................................... 23 Figure 3.12: Prototypes of the reader node .............................................................................. 24 Figure 3.13: Reader node’s code ............................................................................................. 24 Figure 3.14: PC reader node’s structure .................................................................................. 25 Figure 3.15: The PC reader node’s code .................................................................................. 26 Figure 3.16: PC Serial to HTTP converter ............................................................................... 27 Figure 3.17: The Graphical User Interface (GUI) ................................................................... 28 Figure 3.18: My SQL database ................................................................................................ 28 Figure 4.1: (a) Triangulation (b) Trilateration (c) Multilateration ........................................... 32 Figure 4.2: Three or more reader nodes coverage ................................................................... 33 Figure 4.3: Relationship between RSSI and distance .............................................................. 33 Figure 4.4: Intersection of 3 circles ......................................................................................... 34 Figure 4.5: Trilateration field results ....................................................................................... 36 Figure 5.1: Pilgrimage sites borders ........................................................................................ 38 Figure 5.2: Experiment field .................................................................................................... 39 Figure 5.3: Distance vs. link quality ........................................................................................ 40. viii.
(11) Figure 5.4: The coverage of a single reader node .................................................................... 41 Figure 5.5: Reader nodes distribution ...................................................................................... 42 Figure 5.6: Mesh network test (stage one) .............................................................................. 43 Figure 5.7: Portal results of the mesh network test (stage one) .............................................. 43 Figure 5.8: Mesh network test (stage two) .............................................................................. 44 Figure 5.9: Portal results of the mesh network test (stage two) .............................................. 44 Figure 5.10: Tag battery life test graph .................................................................................... 46 Figure 5.11: System implementation (Readers positions) ...................................................... 48 Figure 5.12: GUI “Map” section .............................................................................................. 49 Figure 5.13: RF module address .............................................................................................. 49 Figure 5.14: Reader node (X, Y) axis ...................................................................................... 50 Figure 5.15: GUI “Reader node” section ................................................................................. 51 Figure 5.16: GUI “Tag” section ............................................................................................... 51 Figure 5.17: GUI “Live Map” section ..................................................................................... 52 Figure 5.18: Dynamic environment experiment results ........................................................... 53 Figure 6.1: Node type. ............................................................................................................ 56 Figure 6.2: Types of network topologies ................................................................................. 57 Figure 6.3: Structure of the IEEE 802.15.4 simulation model ................................................. 58 Figure 6.4: Example of the random direction mobility density ............................................... 59 Figure 6.5: Simulation scenario layout .................................................................................... 60 Figure 6.6: Total number of received and sent packets ........................................................... 62 Figure 6.7: Dropped packets .................................................................................................... 62 Figure 6.8: End-to-end delay ................................................................................................... 63 Figure 6.9: Radio receiver business and collision status ......................................................... 63 Figure 6.10: Total received traffic by coordinator nodes......................................................... 64. ix.
(12) LIST OF TABLES Table 2.1: Passive and active RFID tags ................................................................................. 12 Table 2.2: Comparison of positioning technologies ............................................................... 14 Table 3.1: Synapse RF Engine specifications ......................................................................... 17 Table 4.1: Distances between the actual and the calculated tag location ................................ 36 Table 5.1: Distance vs. link quality ......................................................................................... 40 Table 5.2: Tag battery life test results ..................................................................................... 45 Table 5.3: battery charging time with some efficiency loss .................................................... 47 Table 5.4: Dynamic environment experiment results ............................................................. 53 Table 6.1: Physical Layer Parameters ..................................................................................... 60 Table 6.2: MAC Parameters ................................................................................................... 60 Table 6.3: Traffic Module Parameters .................................................................................... 61 Table 6.4: Battery Module Parameters ................................................................................... 61. x.
(13) CHAPTER 1 INTRODUCTION. 1.
(14) 1.1. Introduction. Determining the location of an object is called a positioning system. Positioning systems can be used globally or locally. Local positioning systems do not use technology that has global coverage like the global navigation satellite systems (GPS); they use local technologies that use local coverage. Any wireless technology can be used as a local positioning system, and it can do the task with high accuracy, low cost and in real-time. The wireless technologies include WiFi, and Bluetooth and Radio frequency identification technology (RFID) is usually used in the implementation of any local positioning system [1, 2]. 1.2. Radio frequency identification. Radio-frequency identification (RFID) uses radio waves to transfer data between readers and tags that can be attached to objects or people for the purpose of identification and tracking. RFID is a technology that has been in usesince 1984 [3, 4]. In recent years, RFID has drawn more attention and it has been applied and used in many industries. The United States Department of Defense (DoD) and very wellknown market stores around the world, including Wal-Mart, Pfizer, Tesco, and Gillette’s, have used RFID technology [5, 6].Furthermore, the European Central Bank is trying to prevent counterfeiting of banknotes by using RFID tags [7, 8]. RFID can also be used in crowded public places where people often lose their family members and children [9, 10].Therefore, RFID technology will make the Hajj season in Mecca much easier for many people.. 1.3. Hajj season. The Hajj is considered as one of the largest annual gathering in the world. Muslims from all over the world visit the holy city of Mecca in Saudi Arabia every year to perform the Hajj. The latest statistics on the number of pilgrims provided from the Ministry of Hajj have shown that the number is increasing annually [11].. 2.
(15) 1.4. Problem definition. The continuous increase in the number of pilgrims has made the Hajj more difficult for the pilgrims and the authorities. One of the most difficult tasks during the Hajj season is when someone gets lost in the crowd. Young children and the elderly are the most affected in this situation. Many pilgrims die, get injured and kidnapped every year due the congestion [12, 13]. Therefore, the new technologies have become critical to help the pilgrims. Recently, a few projects have been conducted in Mecca in order to curb the Hajj problems. However, the need for more practical and economical solutions is still required.. 1.5. The aim of the project. The aim of this project is to build a real-time positioning system using an RF-based wireless sensor network to track and identify the location of the pilgrims during the Hajj season. This system will help the security division of Hajj to find the current location of a missing person. This system is mainly aimed at children aged less than 15 years because they are more likely to get lost and it is difficult for them to find their way back.. 1.6. Organization of the thesis. The rest of the thesis is organized as follows. Chapter II will provide information about the place where the system will be applied on and an overview of positioning technologies. The specification and system design will be explained in Chapter III. Chapter IV will be about the network simulation. Chapter V is an implementation of the trilateration method in the system. In Chapter VI the hardware and software implementation is considered. Chapter VII provides conclusion, discussion and future work.. 3.
(16) CHAPTER 2 LITERATURE REVIEW. 4.
(17) 2.1. Mecca and Hajj. The holy city of Mecca is located in the western part of Saudi Arabia. Mecca has the largest mosque in the world (The Grand Mosque) accommodating 1.5 million worshippers at a time. The city of Mecca is considered to be the most sacred place in Islam. Therefore, people from all over the world visit Mecca every year to pray and perform Umrah and Hajj. Umrah is a small Hajj that can be performed at any time of the year. However, Hajj comes just in the twelfth month of the Islamic calendar and it lasts for five continuous days. Hajj is the fifth pillar of Islam and it is obligatory for every muslim, sane, free, and physically and financially able to do so, according to the teachings of Islam. The total number of pilgrims reached around 2 million every year making the Hajj season one of the largest gatherings in the world. The latest statistics on the number of pilgrims provided from the Ministry of Hajj have shown that the number is increasing annually as shown in Figure 2.1. In 1996, the number of pilgrims was 1,865,234, this number had increased to 2,012,074 pilgrims in 2004 [11].. Figure 2.1: Hajj statistics [11]. The government of Saudi Arabia has made great efforts in the expansion of the ritual sites and the provision of medical and security services. Moreover, the government. 5.
(18) established a Ministry for Hajj in 1961 to take care of everything related to the Hajj season.. Despite all the efforts concerning the Hajj season there are still problems among the crowds leading to injuries, missing pilgrims and death. According to news reports, in 1998 more than 118 pilgrims died during the Hajj and 180 were wounded [14]. Around 35 pilgrims lost their lives in 2001, and another 14 people in 2003 [15, 16]. The number of deaths in 2004 had increased to 251 pilgrims and 244 people suffered injuries [17].. 2.1.1 Pilgrimage sites Hajj. is. a. series. of. ritual. acts. done. in. five. days.. During these days, pilgrims visit four different places, namely, the Grand Mosque, Mina, Mozdalifah, and Arafat. as. shown. in. Figure. 2.2.. At. each of these. places, the pilgrims perform religious acts at specific times. Mostly, Pilgrims travel between these places walking along a 22 km pedestrian path.. Figure 2.2: Pilgrimage sites [37]. 6.
(19) 2.1.2 Sequence of the hajj journey Day1: Ihram: Before entering the Holy city of Mecca, the pilgrim must wear special clothes, which are two white sheets draped across the body. Umrah: Once in Mecca, the pilgrims enter the grand Mosque and perform their first Tawaf. In the Tawaf, the pilgrims circle the Kaaba seven times Figure 2.3.. Figure 2.3: The Tawaf ritual [18]. After Tawaf, the pilgrims perform sai; running and walking seven times between the hills of Safa and Marwah, which are 450 meters apart as show in Figure 2.4. At the end of the first day, pilgrims travel to Mina, which is three miles to the east of Mecca.. Figure 2.4: Safa and Marwah [19] 7.
(20) Day2: Arafat: On the second day of Hajj, the pilgrims travel 14.4 km (9 miles) east from Mina to Mount Arafat. Pilgrims stay there from afternoon to sunset. They stand facing Mecca, in prayer and reflection. In the evening after Arafat, pilgrims leave for Mozdalifah, traveling 9 km (5.6 miles). Mozdalifah: At Mozdalifah, which is located between Arafat and Mina they spend the night in prayer and gathering stones for the next day’s ritual; the “stoning of the devil.” Before the sun has risen, the pilgrims return to Mina.. Day3: Ramy al-jamarat: On the third day, in Mina, pilgrims perform the ‘stoning of the devil’ where they throw their stone pebbles at three Jamarat pillars as shown in Figure 2.5. After the stoning, an animal is sacrificed, either by the pilgrim or through the appointment of someone else.. Figure 2.5 Ramy al-jamarat ritual (stoning of the devil) [20]. Tawaf al-Ifadah: on the same day the pilgrims return to the grand mosque for one more Tawaf, called Tawaf al-Ifadah. As a final sacrifice, the pilgrim then shaves his/her head or cuts off a portion of hair.. 8.
(21) Day4/5: The Days of Tashriq: The pilgrims then return to Mina for two days. On each of the two days, pilgrims, again, stone the Jamarat pillars, each with seven stones. The throwing of the stones is not mandatory for the physically weak or women. These two days are spent in contemplative prayer. On the fifth day, pilgrims return to Mecca where a Farewell Tawaf is performed and the Hajj is complete.. 2.2. Existing technologies. In recent years, some researchers have proposed a number of solutions for the problems faced by the pilgrims and the authorities during the Hajj season. Mohamed Mohandes has developed a portable device using RFID technology to help the authority in the identification of pilgrims [21] as shown in Figure 2.6.. Figure 2.6: RFID Pilgrim Identification System [21]. One of the problems that leads to congestion during the Hajj is the lack of information about the correct rituals. Therefore, Shahida Sulaiman and Hasimah Mohamed have developed an expert system called Hajj-QAES. The system is to assist the pilgrims in the learning process and during the hajj to know what to do quickly without asking others or making serious mistakes such as walking against the crowd [22]. Figure 2.7 shows the main window of their system.. 9.
(22) Figure 2.7: The main window of Hajj-QAES [22]. Willy Wahyn Mulyana presents a simulation of the crowd’s behaviour during the Hajj to train the pilgrims before the actual Hajj and to highlight the most crowded places to take action [23] Figure 2.8 shows simulation results.. Figure 2.8: The crowd simulation results [23] 10.
(23) However, knowing the exact location of any person among thousands of pilgrims during the Hajj is a very difficult task. It may take several days to find a missing person, especially children or the elderly, and they would be subjected to many problems. The best way to locate a person location is by using a tracking system.. 2.3. RFID technology. One of the well-known tracking systems is RFID technology, as it can provide outstanding performance with reasonable costs. RFID technology has been used by many industries and it has proven its worth, especially in tracking people or assets using RFID tags. The RFID tracking system contains 3 main components: RFID Tags, RFID reader and RFID PC reader [24].. 2.3.1 RFID tags There are two different kinds of RFID tag: passive and active tags [24, 25].. 2.3.1.1. Passive RFID tags. Passive tags do not require batteries. They, basically, convert the RF signal that comes from the RFID reader into energy to return the signal back again to the RFID reader. Passive tags are usually chosen because they are low cost and small size. However, they have shorter reading range and less memory size.. 2.3.1.2. Active RFID tags. Active tags require batteries, unlike the passive tags. The main advantages of the active tag are the long communication range and the high data transmission rates. Table 2.1 summaries the difference between passive and active RFID tags.. 11.
(24) Table 2.1: Passive and active RFID tags. 2.3.2 RFID reader The RFID reader basically receives signals from the RFID tags and forwards them to the RFID PC reader. The RFID reader can be used in three different ways [26]:. 2.3.2.1. Hand-held, reader. A handheld reader is a small device carried by the user to find the location of any tag. The location can be determined by measuring the Received Strength Signal Indicator (RSSI).. 12.
(25) 2.3.2.2. Fixed reader installed in area. A fixed reader technique has a number of readers installed at fixed known places creating a wireless network. Unlike the hand-held reader the fixed reader technique is more accurate and covers a larger area. The fixed reader technique is usually used with active RFID tags.. 2.3.2.3. Fixed reader installed at chokepoint. A fixed reader at a chokepoint is a technique that is used mainly with passive RFID tags and is the most common technique. The readers read the signals whenever the tags come within the range of the reader.. 2.3.3 RFID PC reader A PC reader or middleware connects between a network of several readers and a host computer. Through a PC reader data received from the tags can be collected from the readers to display them on the host computer. The PC reader works as a receiver and transmitter also.. 2.4. Comparison of positioning systems. RFID technology is not the only tracking system available. There are other positioning technologies, such as GPS (Global Positioning System), WiFi, Infrared, and Bluetooth. GPS is a satellite-based navigation system and it is one of the most popular technologies used for positioning. It is also commonly used in vehicles. However, GPS appears to be unsuccessful within buildings [27]. Table 2.2 shows the differences between these technologies.. 13.
(26) Table 2.2: Comparison of positioning technologies. 14.
(27) CHAPTER 3 SPECIFICATION AND DESIGN OF THE SYSTEM. 15.
(28) 3.1. Introduction. The system is based on 3 main hardware components like any location tracking system: . Tags. . Reader nodes. . PC reader node.. The sensor module that will be used is Synapse RF Engine.. The language. programming to program these sensors is python programming language. The system will be designed around the concept of trilateration method. All of these hardware and software components will be described in this chapter.. 3.2. Synapse RF engine. The main hardware component used in the system is the Synapse RF Engine, IEEE 802.15.4-based, as shown in Figures 3.1 and 3.2. These small, low-power, transceiver modules, running from sub-GHz to 2.4 GHz, have a wide range coverage and a low power consumption with a 2.5 μA low power mode. See Appendix C.1 for more details about the Synapse RF Engine. Table 3.1 shows a detailed description of this model.. Figure 3.1: Synapse RF Engine dimensions [Appendix C.1]. 16.
(29) Figure 3.2: Synapse RF Engine [Appendix C.1]. Table 3.1: Synapse RF Engine specifications [Appendix C.1]. 17.
(30) 3.3. Evaluation Kit. A Synapse evaluation kit (EK2100) will be required to upload python scripts into the tags, reader nodes and PC reader node. The Synapse evaluation kit contains: SNAPstick, ProtoBoard and Portal software. See Appendix C.3 for more details about the Synapse evaluation kit (EK2100).. 3.3.1 SNAPstick SNAPstick is a USB stick designed to work as a bridge to connect a PC to Synapse RF engine network (Figure 3.3).. Figure 3.3: SNAPstick [Appendix C.3]. 3.3.2 ProtoBoard ProtoBoard is a board that provide a full access to the RF engine (Figure 3.4).. Figure 3.4: SNAP Node ProtoBoard [Appendix C.3] 18.
(31) 3.3.3 Portal software Portal is software that can be used to upload script to the RF engines, delete scripts, monitor activities and more. See Appendix C.2 for more details about the Synapse Portal software. It gives total control to the RF engines with an easy graphical user interface as shown in Figure 3.5.. Figure 3.5: Portal software [C.2]. 3.4. System structure. This system works as follows: 1. The Tag sends a signal to the nearest reader node showing its location. 2. The Reader node sends a signal of the tag location and its ID to the PC reader node. 3. The PC reader forwards the signal received from the reader node to PC software called the PC Serial to HTTP converter. 4. The PC Serial to HTTP converter processes the data and then sends it to a server. 5. Graphical user interface software uses the data from the server to locate the tags on a map. Figure 3.6 shows a diagram of the system structure.. 19.
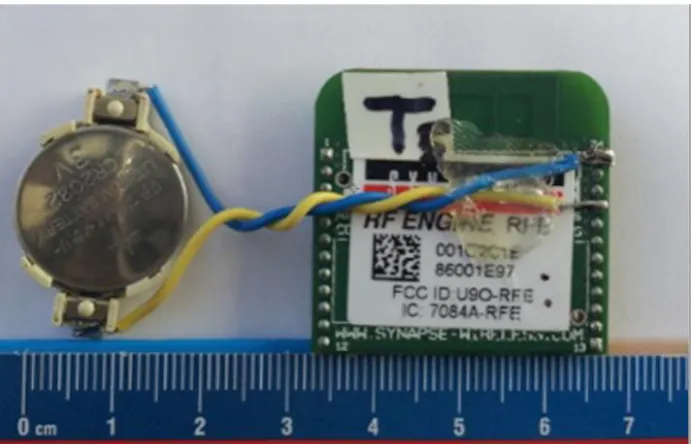
(32) Figure 3.6: System structure. 3.4.1 Tag There are two kinds of tags, passive and active tags as mentioned before. The active tags have been used in this project. Passive tags have some advantages over the active tags in terms of cost and size, but the reason for excluding the passive tags is their short reading range which is crucial in this project. The Synapse RF engine requires minimum power of 2.5V. So the tag will be powered by a Li-Ion Rechargeable Coin Cell batteries (PD3555) to keep the tag small. The battery holder will be soldered directly to the module; (-) on the battery goes to the pin 24 on the module and (+) goes to pin 21 on the module. Figure 3.7 shows the wiring for the tag and Figure 3.8 shows a prototype of the tag.. 20.
(33) Figure 3.7: Tag’s structure. Figure 3.8: Prototype of the tag. 21.
(34) A Pocket card enclosure will be used to house the tag . The enclosure dimensions are 85mm length, 54 mm width and 10mm height. These will make the tag portable and easy to be carried around as shown in Figure 3.9.. Figure 3.9: Tag enclosure. The script uploaded in the tag makes the tag send a ping and then it goes to sleep mode before the next ping and that will increase the battery life .The Python script for the tag can be seen in Appendix A.1. Figure 3.10 illustrates the process of the tag.. Figure 3.10: Tag’s code 22.
(35) 3.4.2 Reader node The RFID tracking system has three techniques: Hand-held reader, fixed reader installed in area, and fixed reader installed at chokepoint. For this project “fixed reader installed in area” will be used to cover wide areas and to get higher accuracy. The reader nodes will be installed at fixed places and will be powered by a 3 V DC 400 mA Power Adapter. Similar to the tag wiring setup, (-) on the DC plug goes to the pin 24 on the module and (+) goes to pin 21 on the module, as shown in Figure 3.11.. Figure 3.11: Reader node’s structure. The reader node will be put in an enclosure to protect the module. The dimensions of the enclosure are 50 mm length 50 mm width 20 mm height as shown in Figure 3.12.. 23.
(36) Figure 3.12: Prototypes of the reader node. Python script will be uploaded to reader node by the Synapse Evaluation Kit. The python script of the reader node can be seen in Appendix A.2. This script will make the reader node receive signals of the tag and send them back to the PC reader node along with the id of the reader itself. Figure 3.13 shows how the reader node works.. Figure 3.13: Reader node’s code 24.
(37) 3.4.3 PC reader node To connect the PC reader to the host computer, a FTDI USB to serial cable will be used. The USB end plugs into the host computer and the other end connects to the UART pins on the module. The USB port provides 5V but the module needs 3V so a LP2950ACZ-3.0 Voltage Regulator will be used to convert the power. Figure 3.14 shows the wiring for the PC reader.. Figure 3.14: PC reader node’s structure. 25.
(38) The Python Software will allow the PC reader node to receive data wirelessly from the network of the reader nodes and will forward it to the host computer. The python script of the PC reader node can be seen in Appendix A.3. Figure 3.15 shows how the PC reader node works.. Figure 3.15: The PC reader node’s code. 26.
(39) 3.4.4 PC serial to http converter Software written in c# language and running on the host computer receives the data from the PC Reader via the FTDI adapter and then forwards the data to an HTTP server via HTTP Port Figure 3.16.. Figure 3.16: PC Serial to HTTP converter. 3.4.5 Display GUI The Graphical User Interface (GUI) for this project is coded in PHP programming. So the GUI is web based and it can be accessed via any Internet browser. The GUI receives the data from the PC Serial to HTTP converter and displays the location of the tags on a map, which has been drawn for the actual location. The GUI is designed to allow the user to add, delete or modify any information including tags, reader nodes, maps and system users. Figure 3.17 shows a snapshot of the GUI.. 27.
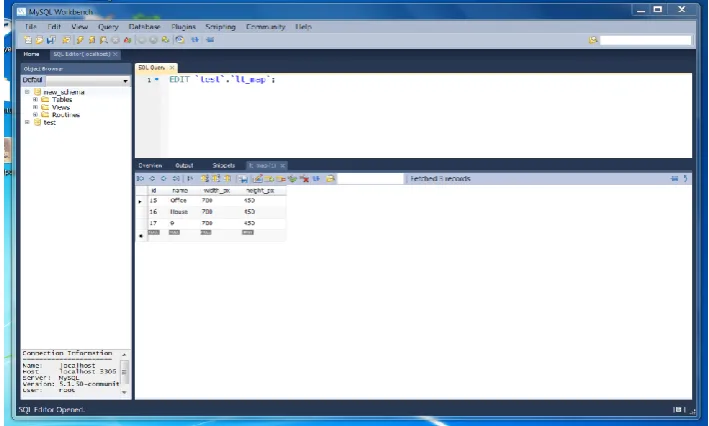
(40) Figure 3.17: The Graphical User Interface (GUI). 3.4.6 My SQL database Database ‘My SQL’ will be used to restore and recall any information including tags, reader nodes, maps and the authorized users of the system Figure 3.18.. Figure 3.18: My SQL database. 28.
(41) 3.5. Key considerations for developing the system. While developing the system, some points have been taken into consideration including the ease of use by the provider and the beneficiary, low cost and practical and work under any conditions. The main advantages of the system are summarized below: 1. The system does not require software to be installed to view the map because the GUI is web based. 2. Works on any platform where users have Internet browser including Windows, UNIX or Mac. 3. Can be accessed from anywhere worldwide. 4. The map can be viewed by multiple users at the same time.. 29.
(42) CHAPTER 4 TRILATERATION METHOD. 30.
(43) 4.1. Positioning In Wireless Sensor Networks. In Wireless Sensor Networks the location of the tags can be determined in different ways including: Triangulation, Trilateration, Fingerprinting and Multilateration [30, 31]. These methods use the radio signal properties provided by the RF module infrastructure in order to calculate the location of the tag. The radio signal properties are: Time of Arrival (ToA), Time Difference of Arrival (TDoA), Angle of Arrival (AoA) and Received Signal Strength Indicator (RSSI).. 4.1.1 Multilateration The multilateration method is based on TDoA (Time Difference of Arrival) [32]. This method requires at least three nodes to estimate the unknown location of the tag. However, multilateration method needs a high accuracy in the time synchronization of the received signals to do the calculation.. 4.1.2 Triangulation The triangulation method uses triangle geometry to calculate the unknown location of the tag [33]. AOA (Angle of Arrival) is used in this method and it requires a minimum of two reference nodes. The only disadvantage in this method is the use of the antenna direction in the calculation of the tag location.. 4.1.3 Fingerprinting The fingerprinting method uses RSSI to build a database of several tag locations. For a new calculation, new RSSI measurements will be obtained and it will try to find similar conditions using the database. This method is time consuming especially in large and dynamic networks. [34, 35].. 31.
(44) 4.1.4 Trilateration This system is designed around the principle of the trilateration method. The trilateration code used in this system can be seen in Appendix B. The trilateration method has been widely used for wireless sensor network localizations. This method requires at least three fixed nodes. Receiver Signal Strength Indication (RSSI) is used to calculate the location of the tag [36].. Figure 4.1: (a) Triangulation (b) Trilateration (c) Multilateration. 4.2. Received Signal Strength Indicator (RSSI). RSSI is mostly affected by variable factors including obstacles, multipath and node distribution and has most frequent errors in indoor environments. Mecca is an open environment with a high probability of Line of Sight (LoS) and low multipath effect. In the fixed nodes distribution, also, it is very important to have accurate results. Therefore, we take into consideration that the nodes are distributed equally so the tags are in the range of at least 3 nodes. The highlighted area in Figure 4.2 shows the coverage of 3 or more reader nodes. The relationship between the Received Signal Strength (RSSI) and the distance test is shown in Figure 4.3.. 32.
(45) Figure 4.2: Three or more reader nodes coverage [37]. Figure 4.3: Relationship between RSSI and distance. 33.
(46) 4.3. The mathematics of the trilateration method. The basic formula for a circle is shown (1). (1). If we assume there are three reference nodes at points (. ), (. The distances between these nodes and the target node are (. ) and (. ).. ) as shown in. Figure 4.4.. Figure 4.4: Intersection of 3 circles. The formulas for the three circles are as shown in equations (2), (3) and (4). (. ). (. ). (2). (. ). (. ). (3). (. ). (. ). (4). Equations (2), (3) and (4) are expanded to become equations (5), (6) and (7). (5) (6) (7) 34.
(47) The next step is using a method proposed by Dixon [8] to get radical plane for circle intersection by subtracting 2 circles. In this case, equation (7) will be subtracted from equation (6) to get equation (8) and equation (5) will be subtracted from equation (6) to get equation (9). (. ). (. ). (. ). (. ). (8) (9). Rearranging the equation (8) and (9) will generate new variables called Va in equation (10) and Vb in equation (11) (. ). (. ) (. (. ). (. ) (. ) (. ) (. ) (. ) (. ). (10) ). (11). The intersection points ‘x’ and ‘y’ of equation (10) and (11) are shown in (12) and (13). ( (. (. ). )(. ) (. (. ) )(. ). ) (. (12) (13). ). 35.
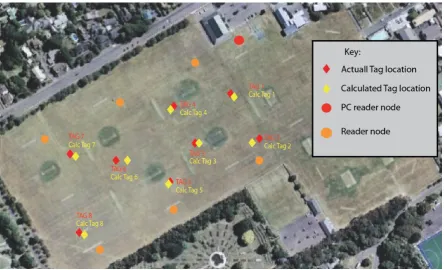
(48) 4.4. Trilateration field experiment. In this section the distance error was measured by observing the distance between the actual tag location and the tag location calculated in the GUI. A network of 6 reader nodes and the PC reader node were set up. 8 tags were placed in several different places within the range of at least three reader nodes.. Figure 4.5: Trilateration field results [38]. As shown in Figure 4.5 the distance error is relatively low. Table 4.1 shows the distance in meters between the actual tag location and the calculated location.. Table 4.1: Distances between the actual and the calculated tag location Tag. Tag1. Tag2. Tag3. Tag4. Tag5. Tag6. Tag7. Tag8. Average. Distance. 2.5. 4.0. 3.5. 2.5. 1.5. 5.0. 4.5. 3.0. 3.5. (m). 36.
(49) CHAPTER 5 HARDWARE AND SOFTWARE IMPLEMENTATION. 37.
(50) 5.1. Readers positioning. This section outlines how the actual coverage of the readers was measured, how many readers are required and where they should be located in Mecca.. 5.1.1 Introduction Before measuring the coverage of the readers, the outer borders of the pilgrimage sites. need. to. be. identified.. As. mentioned. earlier,. the. pilgrims. must visit four different sites in order to complete their Hajj; the Grand Mosque, Mina, Mozdalifah and Arafat as shown in Figure 5.1. The Grand Mosque is 100.000 m2, Mina is 8 km2, Mozdalifah is 12 km2 and Arafat is 13 km2.. Figure 5.1: Pilgrimage sites borders [37]. 38.
(51) 5.1.2 Reader node coverage experiment Five reader nodes and the PC reader node (main) were used in this experiment. The Synapse Portal program was used to measure the link quality. The experiment was done outdoors at a local park of 577.43m length and 257.13m width as shown in Figure 5.2. The signal strength between the reader node and the PC reader was measured every 20 meters.. Figure 5.2: Experiment field [38]. As shown in Table 5.1 and Figure 5.3 the coverage area for a signal reader node is about 200 meter radius.. 39.
(52) Table 5.1: Distance vs. link quality Distance. 10. 20. 40. 60. 80. 100. 120. 140. 160. 180. 200. R1. 100%. 96%. 94%. 93%. 85%. 82%. 77%. 69%. 54%. 34%. 14%. R2. 100%. 98%. 97%. 91%. 88%. 83%. 75%. 66%. 52%. 30%. 10%. R3. 100%. 97%. 96%. 94%. 89%. 82%. 74%. 67%. 55%. 33%. 13%. R4. 100%. 95%. 95%. 93%. 86%. 81%. 75%. 68%. 53%. 34%. 12%. R5. 100%. 97%. 96%. 92%. 87%. 84%. 76%. 67%. 54%. 33%. 11%. Average. 100%. 97%. 96%. 93%. 87%. 82%. 75%. 67%. 54%. 33%. 12%. (m). Figure 5.3: Distance vs. link quality. 40.
(53) Figure 5.4: The coverage of a single reader node [38]. 5.1.3 Positioning results Using the reader nodes coverage test the appropriate places for the reader nodes at the pilgrimage sites were about to be determined. 50 is the minimum number of reader nodes required to achieve the best coverage and to enable the system to precisely locate the tags using the trilateration method. While one PC reader node would be enough, we decided to use four PC reader nodes, one in each region. The reasons for that were: firstly, to reduce the load imposed on the PC reader node and, secondly, to make it easier for the viewer to track the tags in each region individually. That means we had four networks connected together and the viewer could access all of them from one place. Based on the results of the local test, the suitable places for the reader nodes in Mecca were identified so that the distance between each node did not exceed 200 meters. The node distribution can be seen in Figure 5.5.. 41.
(54) Figure 5.5: Reader nodes distribution [37]. 5.2. Mesh network test. The Synapse RF Engine provides instant-on, multi-hop, mesh network. In this case just one reader node has to be close to the PC reader node. In order to test the mesh networking capability in this system a network of 3 reader nodes (R1, R2, R3) and the PC reader node were trialled. R1 was placed within the range of the PC reader whereas R2 and R3 were not as shown in Figure 5.6.. 42.
(55) Figure 5.6: Mesh network test (stage one) [38]. The result, as shown in Synapse Portal program, proved that R1, R2 and R3 were connected the PC reader node (Figure5.7).. Figure 5.7: Portal results of the mesh network test (stage one). That means R2 and R3 were connected to the PC reader via mesh network capability. Next, we disabled R2 as shown Figure 5.8.. 43.
(56) Figure 5.8: Mesh network test (stage two) [38]. The results show that R3 was not connected to the PC reader node as can be seen in Figure 5.9. This test proves that the mesh network is working as expected.. Figure 5.9: Portal results of the mesh network test (stage two). 44.
(57) 5.3. Tag battery life test. A single tag requires 2.7-3.4 Voltage. The batteries that were used to power the tags are Li-Ion Rechargeable Coin Cell batteries (PD3555). These batteries can produce 3.7 voltages with a capacity of 500 mAh. The advantages of this battery are: rechargeable, small size, lightweight, portability, availability, easy to replace and long-time duration. The tag has been programmed to consume the lowest amount of energy possible as it sends a signal and then puts itself in sleep mode for ten minutes. The power consumption will be measured by a digital Voltmeter. The batteries will be measured before putting them into the tags. Then, when the tags are powered and start transmitting, the battery life will be measured once every day for a week (7 days) without switching the tags off.. Table 5.2: Tag battery life test results Time. Before. Day1. Day2. Day3. Day4. Day5. Day6. Day7. 3.61V. 3.53V. 3.38V. 3.29V. 3.13V. 3.03V. 2.91V. using Battery. 3.74V. life. The minimum voltage to operate the tag is 2.5V. The results show that the battery for the tag drops from 3.74V to 2.91V in the duration of 7 days as shown in Table 5.2 and Figure 5.10. According to these results, the tags will be expected to stop operating in 11 days. The Hajj season will not take longer than 5 days, so the tags will cover the Hajj season without having to recharge the batteries.. 45.
(58) Figure 5.10: Tag battery life test graph. 5.4. Battery charge time calculation. The formula below helps to know the time it takes to fully charge a battery.. BC / CRC =MTFC MTFC - Maximum time to full charge (hr) BC - Battery capacity (mAh) CRC - Charge rate current (mA). 500 / 150 = 3.33 About 3 hours is the time to charge one battery of the Li-Ion rechargeable coin cell (PD3555) type. However, efficiency loss during the charging process has to be taking into consideration. Therefore, the following formulas show the battery charging time with some efficiency loss.. 46.
(59) ((BC / CRC) * 11) / 10 = MTFC (10% Efficiency Loss) (500 / 150) * 11/10 = 3.6 hr. ((BC / CRC) * 12) / 10 = MTFC (20% Efficiency Loss) (500 / 150) * 12/10 = 4 hr. ((BC / CRC) * 13) / 10= MTFC (30% Efficiency Loss) (500 / 150) * 13/10 = 4.3 hr. ((BC / CRC) * 14) / 10= MTFC (40% Efficiency Loss) (500 / 150) * 14/10 = 4.6 hr. Table 5.3: battery charging time with some efficiency loss Efficiency Loss. Time to full charge. percentage. (hour). 0% Efficiency Loss. 3.33 hr. 10% Efficiency Loss. 3.6 hr. 20% Efficiency Loss. 4 hr. 30% Efficiency Loss. 4.3 hr. 40% Efficiency Loss. 4.3 hr. 47.
(60) 5.5. System implementation. This section describes how the system can be operated. In order to do so, four steps have to be done.. 5.5.1 Step one: placing the readers First, the reader nodes have to be placed at fixed known places taking into consideration the distance. Figure 5.11 shows the positions of the readers. The highlighted area in the figure is the area that is covered by three or more reader nodes.. Figure 5.11: System implementation (Readers positions) [38]. 48.
(61) 5.5.2 Step two: uploading the maps Uploading the map into the GUI can be done by pressing the “Add Map” button in the “Map” section. The map can be a satellite picture of the location. Moreover, more than one map can be added into the GUI as shown in Figure 5.12.. Figure 5.12: GUI “Map” section. 5.5.3 Step three: locating the reader node on the map The reader nodes can be added from the “Reader” section. The module address is required to add the reader nodes. Reader addresses can be found in the Synapse portal software or on the RF module itself as shown in Figure 5.13. After that, the map has to be chosen to put the reader nodes on.. Figure 5.13: RF module address [Appendix C.1] 49.
(62) To locate the reader nodes in the GUI to match the real readers in the experiment field, an (X, Y) axis has to be identified for each reader node. The system will ask to put a number from 100 to 400 in each axis. Figure 5.14 illustrates the process of adding an (X, Y) axis.. Figure 5.14: Reader node (X, Y) axis. The GUI also allows the user to edit and delete at any time. Figure 5.15 shows the reader node section in the GUI.. 50.
(63) Figure 5.15: GUI “Reader node” section. 5.5.4 Step four: adding the tags Finally, as with the reader node, the module address has to be provided. However, there is no need to choose a map, because the tag will appear with the reader nodes in its region. The name and the colour of each tag can be chosen. Figure 5.16 shows the “Tag” section.. Figure 5.16: GUI “Tag” section. 51.
(64) When the four steps are done, the movements of the tags can be viewed in the main section in the GUI “Live Map” as shown in Figure 5.17.. Figure 5.17: GUI “Live Map” section. 5.6. Efficiency of the system in a dynamic environment. experiment The system has proven highly efficient in finding the location of the tags. However, it is very important to test the system in a dynamic environment with a large number of people. Therefore, the system was deployed in a large local shopping mall. A person was advised to walk in the shopping mall carrying the tag. Then two people (A and B) were asked to find the person with the tag. “A” has used the system while “B” has used the traditional way to find a person. This process was repeated 10 times for both “A” and “B”. The time it takes to find the person with the tag will be obtained for both “A” and “B”. While conducting this experiment the following elements have been taken into account: . Both “A” and “B” have started from the same point.. . The experiment for both “A” and “B” is done in the same day.. . The time stops when “A” or “B” touches the person with tag.. . The person with the tag was moving randomly in the experiment field.. . Both “A” and “B” are not allowed to use any communication devices to find the target.. 52.
(65) Table 5.4: Dynamic environment experiment results Attempts. Group A. Group B. Time(mm:ss). Time(mm:ss). 1st attempt. 06:26. 06:45. 2nd attempt. 03:07. 09:54. 3ed attempt. 04:21. 06:34. 4th attempt. 02:15. 07:42. 5th attempt. 04:03. 08:22. 6th attempt. 05:22. 06:13. 7th attempt. 03:17. 09:32. 8th attempt. 04:23. 08:18. 9th attempt. 03:35. 06:04. 10th attempt. 05:27. 06:45. Average. 04:14. 07:37. The final results as shown in Table 5.4 prove that “A”, who uses the system, is 43.82% more likely to find the target. Figure 5.18 is a line graph that shows, clearly, the difference in time of finding the target between “A” and “B”.. Figure 5.18: Dynamic environment experiment results 53.
(66) CHAPTER 6 SIMULATION RESULTS. 54.
(67) 6.1. Introduction. The system contains a large number of nodes. This makes it difficult to simulate with physical tests. Therefore, OPNET Modeller simulator has been used to accurately model and predict the behaviour of the real system in order to develop and evaluate the systems. OPNET supports star, tree and mesh topologies. This chapter will describe the use of the OPNET simulation tools in this system and shows the final results of the simulation.. 6.2. Node types. The Synapse RF engine is IEEE 802.15.4 based as can be seen in Appendix C . Therefore the nodes can be categorized into three types as shown in Figure 6.1.. 6.2.1 Coordinator The coordinator is considered as the top root node in the network as it allows other nodes in the network to connect to it. In this system the PC reader node is the coordinator node.. 6.2.2 Router The Router node relays messages from one node to another and allows End Device nodes to connect to it. The reader nodes in this system work as the Router nodes.. 6.2.3 End Device The Tags in this system are End Device nodes where they sending and receiving messages without the ability to relay messages.. 55.
(68) Figure 6.1: Node types. 6.3. Network Topologies. There are three common types of network topologies: Star, Tree and Mesh topology as shown in Figure 6.2.. 6.3.1 Star Topology In the Star topology the coordinator node is connected to all other nodes in the network and the messages travel via the coordinator node.. 6.3.2 Tree Topology The Tree topology has a branch structure in which the coordinator is connected to one or more other nodes that are one level lower in the hierarchy. The message travel up and down the tree to reach its destination.. 6.3.3 Mesh Topology The Mesh topology also has a tree structure. However, the nodes in some leaves are directly connected allowing the messages to travel on the shortest paths available.. 56.
(69) Figure 6.2: Types of network topologies. Synapse RF Engine provides an instant-on, multi-hop, mesh network [Appendix C.1]. The Readers (reader nodes) can communicate with each other as long as they are in range of one another. Moreover, if one of the reader nodes stops working the rest of the radar nodes will be still connected. The Mesh Network will greatly expand the coverage area of the tracking.. 6.4. The IEEE 802.15.4 Simulation Model. The IEEE 802.15.4/ Zigbee model provided in the OPNET Modeller simulator consists of four layers: physical, MAC, network and an application layer in addition to a battery model [28]. Figure 6.3 shows the structure of the IEEE 802.15.4 simulation model.. 6.4.1 Physical layer The physical layer has a wireless radio transmitter (tx) and receiver (rx) at 2.4 GHz frequency band and 250 Kbps of bit rate.. 6.4.2 MAC layer The MAC layer implements the slotted CSMA/CA and GTS mechanisms. The MAC layer also generates beacon frames and synchronizes the network.. 57.
(70) 6.4.3 Network layer This layer basically controls the MAC layer and provides a suitable interface to the next layer which is the application layer.. 6.4.4 Application layer This layer is responsible for generating the traffic source including Traffic Source, GTS Traffic Source and Traffic Sink.. 6.4.5 Battery model The battery model is used to calculate the energy consumption and the remaining energy.. Figure 6.3: Structure of the IEEE 802.15.4 simulation model. 6.5. Random Mobility. The coordinators and the router in this system are stationary but the end devices are mobile. The mobility of the end devices is taken into consideration during the simulation. OPNET provides three kind of mobility;. random, predictable and. controllable. The random direction mobility model is chosen due its independence. 58.
(71) from the network topology, traffic flows and residual energy of nodes [29]. Figure 6.4 shows an example of the random direction mobility density.. Figure 6.4: Example of the random direction mobility density. 6.6. The Simulation Setup. The scenario contains the following devices: 4 Coordinators (PC Reader nodes) as the root of the network. 50 Routers (Reader nodes) are used to connect the coordinator and the end devices. 200 End devices (Tags) have been modified to move randomly in the simulation area. The devices are distributed in a 20km x 7km area, to match the real place (Mecca). Figure 6.5 shows the simulation scenario layout. The radio range of the devices is set to approximately 180m, according to the reader node coverage test. Destination of the traffic is set to the end devices (Tags), through the router (Reader nodes). These devices have been modelled with suitable parameters as seen in Tables 6.16.4. Finally, the simulation runtime is set to 5000 second.. 59.
(72) Figure 6.5: Simulation scenario layout. Table 6.1: Physical Layer Parameters Physical layer Data rate. 250 kbps. Receiver sensitivity. -102 dBm. Transmission band. 2.4 GHz. Transmission Power. 18 dBm. Table 6.2: MAC Parameters MAC parameters ZCK Wait Duration. 0.05. Number of Retransmission. 5. CSMA Parameters Minimum Back off Exponent. 3. Maximum Back off Exponent. 4. Channel Sense Duration. 0.1. Topology type. Mesh. Synchronization mode. Beacon-enabled. 60.
(73) Table 6.3: Traffic Module Parameters Traffic Module Parameters Traffic type. Exponential. Packet Size. 1 Byte. Table 6.4: Battery Module Parameters Battery Module Parameters. 6.7. Radio power in receiving. 66 mA. Radio power in sending. 110 mA. Radio power in idle. 15 mA. Radio power in sleeping. 2.5 μA. Simulations and results. The simulation results for the described scenario are: Throughput. Dropped packets. End-to-end delay. Radio receiver business and collision status. Total traffic received.. 6.7.1 Throughput Throughput is the average number of bits or packets successfully received or sent by the receiver or transmitter per second. Figure 6.6 shows the throughput results for this simulation.. 61.
(74) Figure 6.6: Total number of received and sent packets. This Figure shows that the traffic generation is constant. However, not all of the generated packets have reached their destination successfully.. 6.7.2 Dropped packets As shown in Figure 6.7 most of the packets have been received successfully and 5.13% of the packets have dropped.. Figure 6.7: Dropped packets. 62.
(75) 6.7.3 End-to-end delay. End-to-end delay is one of the main factors that affects throughput. The end-to-end delay is the time taken to send a packet from the transmitter to the destination node and includes all possible delays. The end-to-end delay result is shown in Figure 6.8.. Figure 6.8: End-to-end delay. 6.7.4 Radio receiver business and collision status Higher end-to-end delay means low performance caused by network congestion. Radio receiver business and collision status indicators can be used to measure network congestion as shown in Figure 6.9. The collision ratio in this simulation as seen in this figure is 0.087%.. Figure 6.9: Radio receiver business and collision status 63.
(76) 6.7.5 Total traffic received. The total traffic received by the four coordinator nodes is shown in Figure 6.10. Figure 6.10: Total received traffic by coordinator nodes. 6.8. Conclusion. This chapter provides a briefly description about the network topology for this system and the IEEE 802.15.4 standards. The focus has been on the performance evaluation of the system. The results have shown some delays and dropped packets due to network congestion. However, these errors are relatively low and will not lead to system failure.. 64.
(77) CHAPTER 7 DISCUSSION, CONCLUSION AND FUTURE WORK. 65.
(78) 7.1 Conclusion and Future Work In recent years, Mecca has seen tremendous expansions in size and infrastructure to accommodate the increasing number of pilgrims. These expansions have made the Hajj journey much easier than ever in terms of accommodation, transportation, health services and security. However, the chance of getting lost in Mecca has also increased. The security division in Mecca is using the traditional way to find a missing person and that process is long and arduous. The proposed system will operate by tracking RFID tags worn by the pilgrims during the Hajj. If a person were to go missing, the security division will be able to locate his exact location. This system is mainly aimed at children aged less than 15 years because they are more likely to get lost and it is difficult for them to find their way back.. This thesis has presented a detailed study of this system and how it should operate. Several experiments have been conducted on the system to ensure its effectiveness and to avoid any technical errors that may occur in the future. The obtained results have been very encouraging. A number of important aspects have been taken into consideration while designing the system, such as the cost of building and using the system and the ease of use by the service provider and the beneficiary.. Future work will be to develop the system to be a handheld device instated of the PC. The tag also will be improved to be more interactive so the tag holder will be able to receive messages and alert from service providers.. 66.
(79) CHAPTER 8 REFERENCES . [1]. P. Bahl and V. N. Padmanabhan, "RADAR: an in-building RF-based user location and tracking system," in INFOCOM 2000. Nineteenth Annual Joint Conference of the IEEE Computer and Communications Societies. Proceedings. IEEE, 2000, pp. 775-784 vol.2.. [2]. M. Marcu, S. Fuicu, and A. Girban, "Local Wireless Positioning System," in Applied Computational Intelligence and Informatics, 2007. SACI '07. 4th International Symposium on, 2007, pp. 171-176.. [3]. M. M. Hossain and V. R. Prybutok, "Consumer Acceptance of RFID Technology: An Exploratory Study," Engineering Management, IEEE Transactions on, vol. 55, pp. 316-328, 2008.. [4]. J. Landt, "The history of RFID," Potentials, IEEE, vol. 24, pp. 8-11, 2005.. [5]. X. Li and X. Yifan, "The comparative analysis of supply chain management in domestic and foreign supermarket chains," in Computer Science and Service System (CSSS), 2011 International Conference on, 2011, pp. 819-822.. [6]. Y. Dianmin, W. Xiaodan, and B. Junbo, "RFID Application Framework for pharmaceutical supply chain," in Service Operations and Logistics, and Informatics, 2008. IEEE/SOLI 2008. IEEE International Conference on, 2008, pp. 1125-1130.. [7]. S. Preradovic and N. C. Karmakar, "Design of fully printable chipless RFID tag on flexible substrate for secure banknote applications," in Anti-counterfeiting, Security, and Identification in Communication, 2009. ASID 2009. 3rd International Conference on, 2009, pp. 206-210.. [8]. Y. Ching-Nung, C. Jie-Ru, C. Chih-Yang, W. Gen-Chin, and W. Chih-Cheng, "Enhancing Privacy and Security in RFID-Enabled Banknotes," in Parallel and Distributed Processing with Applications, 2009 IEEE International Symposium on, 2009, pp. 439-444.. [9]. V. Chawla and H. Dong Sam, "An overview of passive RFID," Communications Magazine, IEEE, vol. 45, pp. 11-17, 2007.. [10]. A. Juels, "RFID security and privacy: a research survey," Selected Areas in Communications, IEEE Journal on, vol. 24, pp. 381-394, 2006.. 67.
(80) [11]. (2011). Hajj and Umrah Statistics. Available: http://www.hajinformation.com/main/l.htm. [12]. T. A. Madani, T. M. Ghabrah, M. A. Al-Hedaithy, M. A. Alhazmi, T. A. Alazraqi, A. M. Albarrak, and A. H. Ishaq, Causes of hospitalization of pilgrims in the Hajj season of the Islamic year 1423 (2003) vol. 26.. [13]. Q. A. Ahmed, Y. M. Arabi, and Z. A. Memish, "Health risks at the Hajj," The Lancet, vol. 367, pp. 1008-1015, 2006.. [14]. (1998). Saudis identifying nationalities of 118 dead pilgrims. Available: http://news.bbc.co.uk/2/hi/middle_east/76348.stm. [15]. (2003). Fourteen killed in Hajj stampede. Available: http://news.bbc.co.uk/2/hi/middle_east/2749231.stm. [16]. (2001). Lessons from Hajj deaths. Available: http://news.bbc.co.uk/2/hi/middle_east/1204816.stm. [17]. (2004). Hundreds killed in Hajj stampede. Available: http://news.bbc.co.uk/2/hi/middle_east/3448779.stm. [18]. (2011). Stages of Hajj al-Ifrad. Available: http://www.hajinformation.com/main/f2121.htm. [19]. (2011). Performing the Welcome Tawaf and Sa'y. Available: http://www.hajinformation.com/main/f21212.htm. [20]. (2011). Proceeding to Mina from Muzdalifah. Available: http://www.hajinformation.com/main/f21316.htm. [21]. M. Mohandes, "An RFID-based pilgrim identification system (a pilot study)," in Optimization of Electrical and Electronic Equipment, 2008. OPTIM 2008. 11th International Conference on, 2008, pp. 107-112.. [22]. S. Sulaiman, H. Mohamed, M. R. M. Arshad, N. A. A. Rashid, and U. K. Yusof, "Hajj-QAES: A Knowledge-Based Expert System to Support Hajj Pilgrims in Decision Making," in Computer Technology and Development, 2009. ICCTD '09. International Conference on, 2009, pp. 442-446.. [23]. W. W. Mulyana and T. S. Gunawan, "Hajj crowd simulation based on intelligent agent," in Computer and Communication Engineering (ICCCE), 2010 International Conference on, 2010, pp. 1-4.. 68.
(81) [24]. K. Finkenzeller, "RFID Handbook - Fundamentals and Applications in Contactless Smart Cards and Identification (2nd Edition)," ed: John Wiley & Sons.. [25]. O. Aluf, "Active RFID TAGs system analysis of energy consumption as excitable linear bifurcation system," in Microwaves, Communications, Antennas and Electronics Systems, 2009. COMCAS 2009. IEEE International Conference on, 2009, pp. 1-9.. [26]. G. G. Kim, "Locating and tracking assets using RFID," Master's thesis, A&M University, Texas, 2009.. [27]. G. Goncalo and S. Helena, "Indoor Location System Using ZigBee Technology," in Sensor Technologies and Applications, 2009. SENSORCOMM '09. Third International Conference on, 2009, pp. 152-157.. [28]. Pes, x030C, ovic, x, U., J. Mohorko, uc, and Z. ej, "Upgraded OPEN-ZB 802.15.4 simulation model," in ELMAR, 2010 PROCEEDINGS, 2010, pp. 281-284.. [29]. D. Stevanovic and N. Vlajic, "Performance of IEEE 802.15.4 in wireless sensor networks with a mobile sink implementing various mobility strategies," in Local Computer Networks, 2008. LCN 2008. 33rd IEEE Conference on, 2008, pp. 680688.. [30]. C. Xiuzhen, A. Thaeler, X. Guoliang, and C. Dechang, "TPS: a time-based positioning scheme for outdoor wireless sensor networks," in INFOCOM 2004. Twenty-third AnnualJoint Conference of the IEEE Computer and Communications Societies, 2004, pp. 2685-2696 vol.4.. [31]. Q. Q. Shi, H. Huo, T. Fang, and D. R. Li, "Using Linear Intersection for Node Location Computation in Wireless Sensor Networks," ACTA AUTOMATICA SINICA, vol. 32, pp. 907-914, 2006.. [32]. K. Kaemarungsi, "Efficient design of indoor positioning systems based on location fingerprinting," in Wireless Networks, Communications and Mobile Computing, 2005 International Conference on, 2005, pp. 181-186 vol.1.. [33]. N. S. V. Rao, X. Xiaochun, and S. Sahni, "A computational geometry method for DTOA triangulation," in Information Fusion, 2007 10th International Conference on, 2007, pp. 1-7.. 69.
(82) [34]. N. Patwari, J. N. Ash, S. Kyperountas, A. O. Hero, III, R. L. Moses, and N. S. Correal, "Locating the nodes: cooperative localization in wireless sensor networks," Signal Processing Magazine, IEEE, vol. 22, pp. 54-69, 2005.. [35]. S. Khodayari, M. Maleki, and E. Hamedi, "A RSS-based fingerprinting method for positioning based on historical data," in Performance Evaluation of Computer and Telecommunication Systems (SPECTS), 2010 International Symposium on, 2010, pp. 306-310.. [36]. A. Shareef, Y. Zhu, and M. Musavi, "Localization using neural networks in wireless sensor networks," presented at the Proceedings of the 1st international conference on MOBILe Wireless MiddleWARE, Operating Systems, and Applications, Innsbruck, Austria, 2007.. [37]. “Mecca.” 21°23’44.19” N and 39°54’43.47” E. Google Earth.. [38]. “Palmerston North” 40°22’06.72” S and 175°36’51.07” E. Google Earth.. 70.
Figure
![Figure 2.1: Hajj statistics [11]](https://thumb-us.123doks.com/thumbv2/123dok_us/8530234.355602/17.595.110.542.436.652/figure-hajj-statistics.webp)
![Figure 2.2: Pilgrimage sites [37]](https://thumb-us.123doks.com/thumbv2/123dok_us/8530234.355602/18.595.110.541.458.661/figure-pilgrimage-sites.webp)
![Figure 2.5 Ramy al-jamarat ritual (stoning of the devil) [20]](https://thumb-us.123doks.com/thumbv2/123dok_us/8530234.355602/20.595.157.469.409.618/figure-ramy-al-jamarat-ritual-stoning-the-devil.webp)
![Figure 2.6: RFID Pilgrim Identification System [21]](https://thumb-us.123doks.com/thumbv2/123dok_us/8530234.355602/21.595.177.451.377.584/figure-rfid-pilgrim-identification-system.webp)
+7
![Figure 4.2: Three or more reader nodes coverage [37]](https://thumb-us.123doks.com/thumbv2/123dok_us/8530234.355602/45.595.109.547.394.638/figure-reader-nodes-coverage.webp)
![Figure 5.1: Pilgrimage sites borders [37]](https://thumb-us.123doks.com/thumbv2/123dok_us/8530234.355602/50.595.109.536.337.593/figure-pilgrimage-sites-borders.webp)
![Figure 5.2: Experiment field [38]](https://thumb-us.123doks.com/thumbv2/123dok_us/8530234.355602/51.595.110.549.248.522/figure-experiment-field.webp)
Related documents
AIRWAYS ICPs: integrated care pathways for airway diseases; ARIA: Allergic Rhinitis and its Impact on Asthma; COPD: chronic obstructive pulmonary disease; DG: Directorate General;
It was decided that with the presence of such significant red flag signs that she should undergo advanced imaging, in this case an MRI, that revealed an underlying malignancy, which
19% serve a county. Fourteen per cent of the centers provide service for adjoining states in addition to the states in which they are located; usually these adjoining states have
The objective of this study was to develop Fourier transform infrared (FTIR) spectroscopy in combination with multivariate calibration of partial least square (PLS) and
diagnosis of heart disease in children. : The role of the pulmonary vascular. bed in congenital heart disease.. natal structural changes in intrapulmon- ary arteries and arterioles.
The degree of resistance exhibited after 1, 10 and 20 subcultures in broth in the absence of strepto- mycin was tested by comparing the number of colonies which grew from the
Assessing the Impact of Biodiversity Conservation in the Management of Maize Stalk Borer (Busseola f
Field experiments were conducted at Ebonyi State University Research Farm during 2009 and 2010 farming seasons to evaluate the effect of intercropping maize with
Al-Hazemi (2000) suggested that vocabulary is more vulnerable to attrition than grammar in advanced L2 learners who had acquired the language in a natural setting and similar
