Achieving Stable Subspace Clustering
by Post-Processing Generic Clustering Results
Duc-Son Pham
Ognjen Arandjelovi´c
Svetha Venkatesh
Department of Computing
School of Computer Science
School of Information Technology
Curtin University
University of St Andrews
Deakin University
Australia
United Kingdom
Australia
Abstract—We propose an effective subspace selection scheme as a post-processing step to improve results obtained by sparse subspace clustering (SSC). Our method starts by the computation of stable subspaces using a novel random sampling scheme. Thus constructed preliminary subspaces are used to identify the initially incorrectly clustered data points and then to reassign them to more suitable clusters based on their goodness-of-fit to the preliminary model. To improve the robustness of the algorithm, we use a dominant nearest subspace classification scheme that controls the level of sensitivity against reassignment. We demonstrate that our algorithm is convergent and superior to the direct application of a generic alternative such as principal component analysis. On several popular datasets for motion segmentation and face clustering pervasively used in the sparse subspace clustering literature the proposed method is shown to reduce greatly the incidence of clustering errors while introduc-ing negligible disturbance to the data points already correctly clustered.
I. INTRODUCTION
Subspace clustering is an important unsupervised learning research topic. By modelling the distribution of data as a union of subspaces [1], [2] multiple subspace models improve on the single subspace assumption [3], [4], [5] and more meaningfully capture the physical structure of the underlying problem. For example, texture features of different image regions are represented well by a mixture of Gaussian distributions [6] in natural image segmentation. In motion segmentation tracked points of different rigid body segments are naturally divided into subspaces whose dimensions are bounded from above by a fixed number resulting from the corresponding motion equations [7], [8]. Frontal face images have also been shown to lie in subject-specific 9-dimensional subspaces under the Lambertian reflectance model [1], [9]. Multiple subspace mod-elling is relevant to numerous data mining problems as well, such as gene expression [10].
A variety of different approaches to subspace clustering have been described in the literature; the reader is referred to [1] for a comprehensive review. However recent work has mainly centred around using the ideas of sparsity and low rank representations, which have been major algorithmic successes in compressed sensing [11], [12] and matrix completion [3], [4].The first work in this direction is sparse subspace clustering (SSC) [13] which regularizes the model-fitting term with
the `1 norm on the self-expressiveness coefficients, thereby
promoting sparsity. There are several advantages of this
ap-proach. Firstly it alleviates the need for the knowledge of the number of subspaces and their dimensions in advance, which was required by previous approaches. Secondly the convex formulation can be extended or tailored to specific needs, e.g. to handle corrupted or missing data. Finally its convex formu-lation can be solved with a practically satisfactory accuracy using a framework known as alternating directions method of multipliers (ADMM) [14]. Another related alternative is trace norm regularization [15] which seeks sparsity in the trans-form domain instead. This subspace clustering approach has attracted a large amount of theoretical analysis [16], [17], work on performance improvement with spatial constraints [18], combined low-rank and sparsity regularization [19], group sparsity regularization [20], scalability [21], thresholding ridge regression [22], multi-view input [23], mixtures of Gaussians [24], or latent structure [25].
Though many extensions of sparse subspace clustering have demonstrated promising results in different applications, and theoretical analysis has established useful results to explain its success, a number of practical challenges remain. As with any unsupervised method, selecting the right parameters to obtain an optimal performance is not a trivial task. The default values for parameters in most of publicly available code implementing SSC variants are unlikely to give optimal clustering results in terms of either accuracy or normalized mu-tual information for every dataset. Even for a specific dataset, the optimal parameter values also depend on the number of classes, because the ideal self-expressiveness coefficients have a fraction of non-zero entries inversely proportional to the number of clusters. The reported results in much of the previous on sparse subspace clustering are for optimal settings which may be difficult to obtain in practice.
In this paper we propose a novel technique to improve the performance achieved by conventional sparse subspace clustering approaches. It can be used as a post-processing step to re-assign samples to more suitable clusters. It can also be seen as analogous to cross validation in supervised learning. Our idea is to re-examine the subspace assumption: if a data sample truly belongs to the subspace induced by the points in the corresponding cluster, it must be distant from other clusters. If this requirement is not met, the data point is better re-assigned to another more suitable cluster. Our key technical contribution lies in a novel algorithm that computes regularized and stable subspaces from data points of initial clusters. To do so, we use an idea from a powerful
framework in statistics known as stability selection. Using the computed projection onto the regularized and stable subspaces,
we re-examine the `p norms of residual vectors of all data
points and re-assign them to suitable subspaces accordingly. We demonstrate the usefulness of the proposed method in improving SSC and many variants on popular face clustering and motion segmentation data sets under different scenarios. Our results and the analysis thereof suggest that the proposed method is a highly useful and non-application specific post-processing technique which can be applied following any subspace clustering algorithm.
The paper is organized as follows. In Section II, we review related works on robust subspace estimation. Section III details the proposed method. Section IV studies how the proposed method improves preliminary results obtained by popular subspace clustering algorithms. Finally, Section V concludes the paper.
II. RELATEDWORK
There are a number of different approaches to robust model fitting in the literature that are potentially useful for the problem considered in this work. One of the most frequently used methods for robust feature matching in computer vision is RANSAC (RANdom SAmple Consensus) [26]. Within this
general framework, a generative model must be specified a
priori as well as the minimum number of samples as a threshold for goodness of fit (inlier count). The algorithm iterates between obtaining a model parameter estimate based on a random subset of data points and counting the number of inliers based on the obtained model over all data points, until that count exceeds the specified threshold. The main advantages of RANSAC are its simplicity, wide applicability to many problems, and ability to cope with a large (up to 50%) portion of outliers. However, model fitting does not generally improve with iterations and the algorithm may need a substantial number of iterations to find the optimal model. In addition, it can only estimate one model at a time.
Another random sampling based approach frequently used in statistics and signal processing, which might be useful for determining the incorrectly assigned data points in a cluster, is the bootstrap. An inference about a given set of data points is produced by computing the empirical distribution of the bootstrap samples, which are generated from a model con-structed from the data itself. Thus the algorithm can determine which data points most likely deviate from a given model. In computer vision, the bootstrap is often used in building a background model in order to detect foreground objects [27]. Its variant in machine learning is bagging [28], which was originally derived for decision trees. The method most closely related to that proposed herein is bagging PCA [29]. However, it is different to the current work in two major aspects: the sampling mechanism (bagging vs. random sampling without replacement), and the consolidation of the final results (taking the union rather than average). Whilst bagging is also possible, we found that it does not provide any advantage in performance compared to our approach, and that it needs to collect many more resamples. This necessitates an increase in computational cost.
Stability selection [30] is another recent statistical method, primarily designed for variable selection in regression
prob-lems. The core idea of stability selection is to accumulate se-lection statistics over random subsets of the original data. This allows the experimenter to decide which response variables are most relevant to the regression problem. Stability selection is suitable for high-dimensional data where estimation of structure is difficult due to the dimensionality of the variables.
Another approach to extracting a robust subspace from a set of data samples in the presence of outliers is matrix completion [3], [4] which uses convex optimization to ex-tract the underlying data structure. Here, the data matrix is expressed as a sum of low-rank and corruption parts. The low-rank component models the intrinsic subspace where the data lies in, and the corruption term captures the deviation from that subspace assumption. For a suitable model of the corruption, it is possible to parameterize outliers explicitly [31]. However, this method is limited to one subspace at a time. Besides, it is hard to select an optimal parameter without prior knowledge and the method can perform poorly when the preliminary subspace clustering is not sufficiently accurate. Thus, it is generally of limited use as a technique for the post-processing of preliminary clustering results.
III. PROPOSEDMETHOD
Our method learns stable subspaces from a preliminary clustering, and then uses computed projections onto these subspaces to improve the result by reassigning some of the data points to more suitable clusters. Like in sparse subspace clustering or indeed any other alternative, extracting a stable subspace is the key to success. We approach the challenge as an anomaly detection problem [32], [33]. Inspired by subspace analysis based methods for anomaly detection [34], [35], [36], we propose to use the principal subspace of each cluster as a measure of the span of its data points. Thus, the fitness of a data point to each cluster is quantified by its projection on the residual subspace. We also use the random sampling mechanism to obtain a more stable principal subspace.
Let us denote asX= [x1, . . . ,xn]the original data matrix
where for each data point it holds that x∈Rd. Suppose that
there are K clusters, and denote as S0
k, k = 1, . . . , K the
ground-truth index sets of these clusters. The corresponding
data sub-matrix of cluster k is denoted as XS0
k which is
defined as a collection of data points xi, i ∈ Sk0. Similarly,
denote as Sk, k = 1, . . . , K the index sets from preliminary
clustering obtained by SSC; thus the data points of the k-th
cluster areXSk. The true subspace associated with clusterkis
thereforespan(XS0
k)and thek-th subspace estimated by SSC
isspan(XS0
k). Here,spandenotes the span of a set of vectors,
i.e. the subspace created by all possible linear combination of vectors in that set.
When the preliminary clustering is not perfect, it is
ex-pected thatS0
k \ S
0
k ∩ Sk6=∅. So we can write:
XS0
k = XS0k∩Sk∪XSk0\(S0k∩Sk), (1)
XSk = XS0k∩Sk∪XSk\(Sk0∩Sk). (2)
Here,S0
k∩ Sk represents the indices of the correctly clustered
data points. Our idea is that instead of estimating the full subspace, we only approximate the subspace spanned by
XS0
majority of the data points in a cluster are correctly assigned. Theoretically, at least half of the data points need to be correctly assigned to guarantee an improvement. However, our experiments suggest that for computational reasons, in practice it is desirable to have at least 80–90% of correct assignments, though the exact behaviour of the method will further depend on the actual geometry of the data distribution.
If the index setS0
k∩ Sk were known, this would give the
Oracle the knowledge of the best approximate subspace given by span(XS0
k∩Sk). A better estimate of the true subspace in
the absence of other information cannot be obtained. Therefore this estimate defines the best achievable reference, which is useful for the evaluation of the proposed method.
In this work, we do not directly estimate the subspace
spanned by S0
k ∩ Sk. Instead, we compute the approximate
projection on span(XS0
k∩Sk) through the process of random
sampling. To motivate this idea using an illustrative example, consider the following synthetic problem which demonstrates the mechanism behind the stable subspace learning method which we will explain in detail thereafter. Here, we generate a
synthetic cluster data of N = 100 samples in Rd, d = 100,
wherein 1−α fraction of the samples belong to the true
subspace of the dimension 10. The remaining α fraction
contains outliers which are uniformly distributed in Rd. We
also left-multiply the data by a random unitary matrix to ensure the final data is not trivial. The goal is to learn the true subspace in the presence of outliers. The subspace is learnt by computing its projection. We consider two methods. The first method is in the form of principal component analysis (PCA) that extracts the principal subspace on the whole cluster data
using a principal energy fraction of ρ = 1−α. This yields
the projectionPp=UpUTp whereUpis the left singular
sub-matrix corresponding to the principal components. The second
method is a variation of PCA: we randomly select a fractionρ
of the cluster data, extract the corresponding projections onto the principal subspace of that subset, and then compute the av-erage value of the projection matrices for each iteration, which
we denote as Ps. We then compare the computed projection
matrices with that obtained by the Oracle’s knowledge of the
[image:3.612.323.566.64.269.2]relevant samples within the clusters, which is denoted as Pt.
Figure 1 shows how the Frobenius norm error kPs−Ptk2F
reduces when the number of iteration increases. It also shows
the error of direct PCA, which is kPs−Ppk2F. The figure
clearly shows that the random sampling process generally yields an improved estimate of the projection matrix as the number of iterations increases, and that the stable projection matrix achieves a smaller relative error than does conventional PCA.
Formalizing the procedure from the example given above, the proposed method can be summarized by the following sequence of steps:
Step 1: Obtaining stable principal subspaces from the preliminary clusters
• For each cluster Ck repeat the following for iteration
i= 1, . . . , maxIter
◦ Randomly select a subset Xk
i of size ρNk
from Xk, where ρ is a number close to 1,
which designates the fraction of the correctly clustered samples;
0 10 20 30 40 50 60 70 80 90 100
4.35 4.4 4.45 4.5 4.55 4.6 4.65 4.7 4.75 4.8 4.85
Iterations
Projection Norm Error
Random Sampling Direct PCA
Fig. 1. An illustrative example showing the convergence behaviour of the projection matrix computed from a random sampling scheme on synthetic data, wherein the majority of the samples follow a true subspace model, except for a small fraction α. The y-axis shows the Frobenius norm of the error with respect to that obtained by the Oracle knowledge.
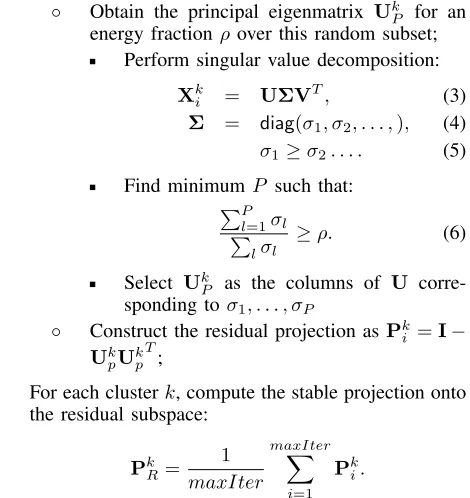
◦ Obtain the principal eigenmatrix Uk
P for an
energy fraction ρover this random subset;
Perform singular value decomposition:
Xki = UΣVT, (3)
Σ = diag(σ1, σ2, . . . ,), (4)
σ1≥σ2. . . . (5)
Find minimumP such that:
PP l=1σl
P lσl
≥ρ. (6)
Select UkP as the columns of U
corre-sponding toσ1, . . . , σP
◦ Construct the residual projection asPk
i =I−
Uk pUkp
T
;
• For each clusterk, compute the stable projection onto
the residual subspace:
PkR= 1
maxIter
maxIter X
i=1
Pki.
Step 2: Dominant nearest subspace clustering
• For each data point xn, compute the residual vector
for each subspace k:
rkn=PkRxn.
• Compute the residual score of each data point to each
subspace as the`p-norm of the corresponding residual
vector:
ekn=krknkp.
• Denote the set E ={ek
[image:3.612.338.573.351.600.2]of generality, suppose that e1
n is the residual score
for the subspace computed from the current clusters
and e2
n, e3n. . . are those for the subspaces computed
from the other clusters. In dominant nearest subspace clustering, we only consider the re-assignment of the current data point if the best residual error from other clusters is considerably less than that of the currently-assigned cluster:
min
k≥2e
k n ≤ηe
1
n,
where 0 < η < 1 is a small number that quantifies
the notion of “significantly smaller”. If this condition is satisfied, we re-assign the data point to the cluster having minimum error:
C(xn) = arg min k≥2e
k n.
a) Remarks:
• In the algorithm summarized above, maxIter is the
number of repetitions in Step 1. Alternatively, one may
also check if the projection matrix PkR converges to
some stable value so as to terminate the iteration early.
• One key parameter of the algorithm is the energy
fraction of the principal subspace ρthat controls the
complexity of the underlying predictive model. A high
value ofρlikely results in subspace over-fitting, whilst
a low value generally leads to a noisier prediction.
Our experiments suggest that ρ= 0.9 achieves good
results across many data types tested. Of course, it
is desirable to extend to the case where ρ may vary
between clusters in order to provide more comparable fitting errors between them. This task is left for future work.
• Another parameter of the algorithm is the size of
the subset. Here, we choose it to be exactly the
fraction of the samples correctly clustered i.e. ρ. In
the literature on stability selection, it is often the case that a randomly selected half of a cluster is being sampled at a time. However, numerous experiments
that we conducted suggest thatρis the optimal choice
for the size of the randomly sampled subsets. Figure 2 supports this observation.
• In the second step, the `p-norm is used to compute
the deviations of the data points from the subspaces.
Here, we suggestp= 1.5for a good balance between
dense and sparse errors, which is observed to provide an overall satisfactory performance in many cases.
• The proposed method is only useful if the preliminary
subspace clustering result is sufficiently accurate in the sense that the size of each cluster found is about the expected size so that the purity in each cluster exceeds 50%. This allows the principal subspace from each cluster to be extracted stably and reliably.
• In the proposed method, we introduced a new concept
which we termed dominant nearest subspace
cluster-ing, particularly designed as a post-processing
tech-nique. The idea is that a re-assignment of a data point to a new cluster is necessary if that data point much
better fits another stable subspace. This is critical as it guards against noise and unavoidable errors when the stable subspaces are extracted. This process is
governed by the parameter η. Clearly, the smaller
the value of η, the more conservative the scheme is.
Whenη= 1, the process reduces to the conventional
nearest subspace classification. A large value ofηmay
correct more data points, but potentially introduces disturbance to correct cluster assignments achieved in preliminary clustering. Similarly, a small value
of η may achieve less correction, but is safer as
it minimizes the aforementioned disturbance. In this
work, we usedη= 0.5.
IV. EMPIRICALEVALUATION
In this section we demonstrate experimentally how the proposed method improves preliminary clustering results by sparse subspace clustering (SSC) [1]. We use the original code provided by the authors of SSC and set the parameters using the default values in these implementations. We consider three popular subspace clustering datasets: the Johns Hopkins 155
motion segmentation dataset1, the CMU pose, illumination,
and expression (PIE) dataset2, and the extended Yale B face
dataset3. The two face datasets were originally collected
for evaluation of face recognition algorithms (for the best reported recognition performance on this data set see [37]) but have since also been widely adopted in the literature on subspace clustering. Their suitability within this context stems from the finding that under the assumption of the Lambertian reflectance model the appearance of a face in a fixed pose is constrained within the corresponding image space to a 9-dimensional subspace [38] (this observation is used extensively in numerous successful manifold based methods such as [39], [40], [41]).
To demonstrate the usefulness of the proposed method, we evaluate clustering results using classification errors (as done in the original work on SSC), normalized mutual informa-tion (which is a popular performance metric in the general clustering literature), and the number of corrections and false re-assignments of data points. This range of performance measures provides a comprehensive picture of the behaviour of the proposed method.
A. Experiment 1: Motion Segmentation
We first consider the motion segmentation problem. The Hopkins 155 dataset consists of 2- and 3-motion sequences,
each being a collection of the (x, y) coordinates of tracked
points on moving objects captured by a (possibly moving) camera. The dataset has been used as a standard subspace clustering benchmark, including in the original work on SSC.
We adopt the default setting for SSC: the regularization parameter is set to 20, and no dimensionality reduction or affine constraints are used. With this setting, we obtain the preliminary clustering result by SSC on all sequences and then use the proposed method to refine it. We show the
1http://www.vision.jhu.edu/data/hopkins155/
2http://vasc.ri.cmu.edu/idb/html/face/
0 10 20 30 40 50 60 70 80 90 100 4
4.5 5 5.5 6 6.5 7 7.5
Iterations
Projection Norm Error
Random Sampling Fraction 0.5 Random Sampling Fraction 0.6 Random Sampling Fraction 0.7 Random Sampling Fraction 0.8 Random Sampling Fraction 0.9 Random Sampling Fraction 0.95 Random Sampling Fraction 0.99 Direct PCA
0 10 20 30 40 50 60 70 80 90
4.35 4.4 4.45 4.5 4.55 4.6
Iterations
Projection Norm Error
[image:5.612.56.292.51.351.2]Random Sampling Fraction 0.5 Random Sampling Fraction 0.6 Random Sampling Fraction 0.7 Random Sampling Fraction 0.8 Random Sampling Fraction 0.9 Random Sampling Fraction 0.95 Random Sampling Fraction 0.99 Direct PCA
Fig. 2. An illustrative example on synthetic data showing the effect of varying the size of the randomly sampled subsets as a fraction of the original cluster. Here, the true fraction of samples correctly clustered isρ= 0.95. It is clear that sampling at lower sizes results in a worse steady-state error. Sampling at the correct value ofρachieves optimal performance. The bottom subplot shows a magnification of the top subplot for sampling fractions around the optimal value.
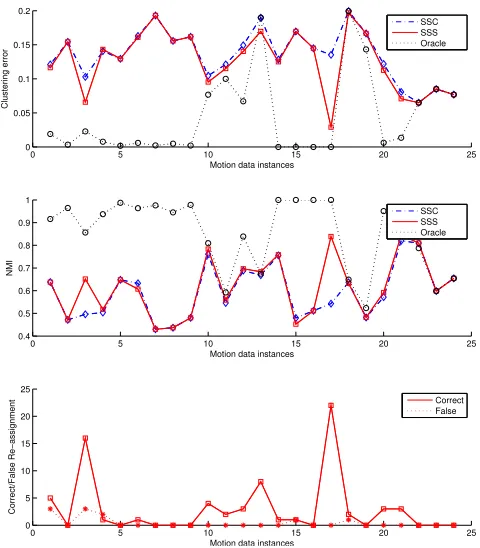
re-clustering result for sequences whose primary clustering error is between 0.05 and 0.2 in Figure 3. Here, we plot the before and after values for clustering errors in the top subplot, NMI in the middle subplot, and the number of correct versus false re-assignments in the bottom subplot. Performance improvement is achieved when the clustering error is reduced and NMI is enhanced. This is observed markedly in at least 8 sequences, where the proposed method makes significantly more corrections than introducing re-assignment errors. The best example is when the proposed method corrects 23 data samples whilst introducing no re-assignment error at all. In this case, the average clustering error reduces from more than 10% to less than 5%. For other motion sequences, the conservative strategy seems to be in effect as the proposed method makes few changes to the preliminary clustering. Figure 3 also shows the performance of the similar method but with the subspaces obtained from the Oracle’s knowledge of the true data samples within a found cluster. This establishes the maximum achiev-able performance that the proposed method can achieve. As can be seen, there are few cases when the proposed method is quite close to the bound. However, a majority of cases indicate that there is still a significant gap, which clearly motivates future work that can better estimate the subspaces.
0 5 10 15 20 25 0
0.05 0.1 0.15 0.2
Motion data instances
Clustering error
0 5 10 15 20 25 0.4
0.5 0.6 0.7 0.8 0.9 1
Motion data instances
NMI
0 5 10 15 20 25 0
5 10 15 20 25
Motion data instances
Correct/False Re−assignment
SSC SSS Oracle
SSC SSS Oracle
[image:5.612.321.561.60.334.2]Correct False
Fig. 3. Summary of our re-clustering results on the Hopkins 155 motion segmentation dataset.
B. Experiments 2 and 3: Face Clustering
We next consider the face clustering problem. Unlike the motion segmentation dataset which is limited to only 3 motions, the number of different persons in the Yale B and PIE face datasets is larger. In this work, we consider 2, 3, 5, and 8 classes for the face clustering problem. For each run, we randomly select the specified number of persons from the face datasets and obtain clustering results using SSC. The ideal clustering result is when all images of the same person fall into a cluster. The parameters for SSC are the same as in the previous experiment.
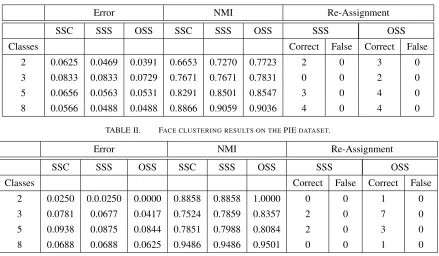
TABLE I. FACE CLUSTERING RESULTS ON THEYALEBDATASET.
Error NMI Re-Assignment
SSC SSS OSS SSC SSS OSS SSS OSS
Classes Correct False Correct False
2 0.0625 0.0469 0.0391 0.6653 0.7270 0.7723 2 0 3 0
3 0.0833 0.0833 0.0729 0.7671 0.7671 0.7831 0 0 2 0
5 0.0656 0.0563 0.0531 0.8291 0.8501 0.8547 3 0 4 0
8 0.0566 0.0488 0.0488 0.8866 0.9059 0.9036 4 0 4 0
TABLE II. FACE CLUSTERING RESULTS ON THEPIEDATASET.
Error NMI Re-Assignment
SSC SSS OSS SSC SSS OSS SSS OSS
Classes Correct False Correct False
2 0.0250 0.0.0250 0.0000 0.8858 0.8858 1.0000 0 0 1 0
3 0.0781 0.0677 0.0417 0.7524 0.7859 0.8357 2 0 7 0
5 0.0938 0.0875 0.0844 0.7851 0.7988 0.8084 2 0 3 0
8 0.0688 0.0688 0.0625 0.9486 0.9486 0.9501 0 0 1 0
the case of Yale B with 2 classes. However, with two classes and the initial clustering error of 2.5%, it does not make a further correction on PIE. Likewise, for both data sets with 8 classes at similar initial clustering errors, SSS is able to achieve maximum correction on Yale B, whilst it cannot improve any further on PIE. We note that it is possible to increase the number of correct re-assignments for SSS, by increasing the
parameterη. However, we still suggest the conservative setting
to ensure the effectiveness of this post-processing step.
V. SUMMARY AND CONCLUSIONS
We proposed a novel method for refining and improving sparse subspace clustering. The key idea underlying the pro-posed method is to learn a stable subspace from each cluster by random sampling and then re-evaluating how well each data point fits the subspaces model by computing the residual error corresponding to each of the initial subspaces. Dominant nearest subspace classification, a conservative strategy, is then used to decide whether or not a data point should be assigned to a more suitable cluster. Experiments on widely used data sets in subspace clustering show that the proposed method is indeed highly successful in improving the results obtained by traditional sparse subspace clustering. Our future work will address how to obtain a better subspace extraction to bring the performance closer to that of the Oracle.
REFERENCES
[1] E. Elhamifar and R. Vidal, “Sparse subspace clustering: algorithm, theory, and applications.”IEEE Transactions on Pattern Analysis and Machine Intelligence, vol. 35, no. 11, pp. 2765–2781, 2013.
[2] O. Arandjelovi´c and R. Cipolla, “Face set classification using maximally probable mutual modes.” In Proc. IAPR International Conference on Pattern Recognition, pp. 511–514, 2006.
[3] E. J. Cand`es, X. Li, Y. Ma, and J. Wright, “Robust principal component analysis?”Journal of the ACM, vol. 58, no. 3, pp. 1–11, 2011.
[4] E. J. Cand`es and B. Recht, “Exact matrix completion via convex optimization.”Journal of the ACM, vol. 9, no. 6, pp. 717–772, 2009. [5] O. Arandjelovi´c, “Discriminative extended canonical correlation
anal-ysis for pattern set matching.”Machine Learning, vol. 94, no. 3, pp. 353–370, 2014.
[6] A. Y. Yang, J. Wright, Y. Ma, and S. S. Sastry, “Unsupervised segmentation of natural images via lossy data compression.”Computer Vision and Image Understanding, vol. 110, no. 2, pp. 212–225, 2008. [7] J. P. Costeira and T. Kanade, “A multibody factorization method for independently moving objects.” International Journal of Computer Vision, vol. 29, no. 3, pp. 159–179, 1998.
[8] R. Vidal, R. Tron, and R. Hartley, “Multiframe motion segmentation with missing data using power factorization and GPCA,”International Journal of Computer Vision, vol. 79, no. 1, pp. 85–105, 2008. [9] K. Lee, M. Ho, J. Yang, and D. Kriegman, “Acquiring linear subspaces
for face recognition under variable lighting.” IEEE Transactions on Pattern Analysis and Machine Intelligence, vol. 27, no. 5, pp. 684–698, 2005.
[10] H.-P. Kriegel, P. Kr¨oger, and A. Zimek, “Clustering high-dimensional data: a survey on subspace clustering, pattern-based clustering, and correlation clustering.” ACM Transactions on Knowledge Discovery from Data, vol. 3, no. 1, p. 1, 2009.
[11] E. Cand`es, J. Romberg, and T. Tao, “Robust uncertainty principles: exact signal reconstruction from highly incomplete frequency informa-tion.” IEEE Transactions on Information Theory, vol. 52, no. 2, pp. 489–509, 2006.
[12] D. L. Donoho, “Compressed sensing.”IEEE Transactions on Informa-tion Theory, vol. 52, no. 4, pp. 1289–1306, 2006.
[13] E. Elhamifar and R. Vidal, “Sparse subspace clustering.”In Proc. IEEE Conference on Computer Vision and Pattern Recognition, pp. 2790– 2797, 2009.
[14] S. Boyd, N. Parikh, E. Chu, B. Peleato, and J. Eckstein, “Distributed optimization and statistical learning via the alternating direction method of multipliers.”Foundations and Trends in Machine Learning, vol. 3, no. 1, pp. 1–122, 2011.
[15] G. Liu, Z. Lin, and Y. Yu, “Robust subspace segmentation by low-rank representation.” In Proc. IMLS International Conference on Machine Learning, pp. 663–670, 2010.
[17] M. Soltanolkotabi and E. J. Candes, “A geometric analysis of subspace clustering with outliers.”The Annals of Statistics, vol. 40, no. 4, pp. 2195–2238, 2012.
[18] D.-S. Pham, S. Budhaditya, D. Phung, and S. Venkatesh, “Improved subspace clustering via exploitation of spatial constraints.” In Proc. IEEE Conference on Computer Vision and Pattern Recognition, pp. 550–557, 2012.
[19] Y.-X. Wang, H. Xu, and C. Leng, “Provable subspace clustering: when LRR meets SSC.”Advances in Neural Information Processing Systems, pp. 64–72, 2013.
[20] B. Saha, D.-S. Pham, D. Phung, and S. Venkatesh, “Sparse subspace clustering via group sparse coding.” In Proc. SIAM International Conference on Data Mining, pp. 130–138, 2013.
[21] X. Peng, L. Zhang, and Z. Yi, “Scalable sparse subspace clustering.”In Proc. IEEE Conference on Computer Vision and Pattern Recognition, pp. 430–437, 2013.
[22] X. Peng, Z. Yi, and H. Tang, “Robust subspace clustering via thresh-olding ridge regression.”In Proc. AAAI Conference on Artificial Intel-ligence, pp. 3827–3833, 2015.
[23] X. Cao, C. Zhang, H. Fu, S. Liu, and H. Zhang, “Diversity-induced multi-view subspace clustering.” In Proc. IEEE Conference on Com-puter Vision and Pattern Recognition, pp. 586–594, 2015.
[24] B. Li, Y. Zhang, Z. Lin, and H. Lu, “Subspace clustering by mixture of Gaussian regression.” In Proc. IEEE Conference on Computer Vision and Pattern Recognition, pp. 2094–2102, 2015.
[25] C.-G. Li and R. Vidal, “Structured sparse subspace clustering: a unified optimization framework.” In Proc. IEEE Conference on Computer Vision and Pattern Recognition, pp. 320–334, 2015.
[26] M. A. Fischler and R. C. Bolles, “Random sample consensus: a paradigm for model fitting with applications to image analysis and automated cartography.” IEEE Transactions on Computers, vol. 24, no. 6, pp. 381–395, 1981.
[27] K. Hughes, V. Grzeda, and M. Greenspan, “Eigenbackground boot-strapping.”In Proc. International Conference on Computer and Robot Vision, pp. 196–201, 2013.
[28] L. Breiman, “Bagging predictors.”Machine Learning, vol. 24, no. 2, pp. 123–140, 1996.
[29] C. Leng, J. Cheng, T. Yuan, X. Bai, and H. Lu, “Learning binary codes with bagging PCA.”Machine Learning and Knowledge Discovery in Databases, pp. 177–192, 2014.
[30] N. Meinshausen and P. B¨uhlmann, “Stability selection.”Journal of the Royal Statistical Society: Series B (Statistical Methodology), vol. 72, no. 4, pp. 417–473, 2010.
[31] H. Xu, C. Caramanis, and S. Sanghavi, “Robust PCA via outlier pursuit.”IEEE Transactions on Information Theory, vol. 58, no. 5, pp. 3047–3064, 2012.
[32] O. Arandjelovi´c, D. Pham, and S. Venkatesh, “Two maximum entropy based algorithms for running quantile estimation in non-stationary data streams.” IEEE Transactions on Circuits and Systems for Video Technology, vol. 25, no. 9, pp. 1469–1479, 2015.
[33] O. Arandjelovi´c, “Contextually learnt detection of unusual motion-based behaviour in crowded public spaces.”In Proc. International Symposium on Computer and Information Sciences, pp. 403–410, 2011.
[34] J. E. Jackson and G. S. Mudholkar, “Control procedures for residuals associated with principal component analysis.”Technometrics, vol. 21, no. 3, pp. 341–349, 1979.
[35] J. E. Jackson, “Quality control methods for several related variables.”
Technometrics, pp. 359–377, 1959.
[36] D.-S. Pham, S. Venkatesh, M. Lazarescu, and S. Budhaditya, “Anomaly detection in large-scale data stream networks.”Data Mining and Knowl-edge Discovery, vol. 28, no. 1, pp. 145–189, 2014.
[37] O. Arandjelovi´c, “Gradient edge map features for frontal face recog-nition under extreme illumination changes.”In Proc. British Machine Vision Conference, 2012, DOI: 10.5244/C.26.12.
[38] A. S. Georghiades, P. N. Belhumeur, and D. J. Kriegman, “From few to many: illumination cone models for face recognition under variable lighting and pose,”IEEE Transactions on Pattern Analysis and Machine Intelligence, vol. 23, no. 6, pp. 643–660, 2001.
[39] O. Arandjelovi´c, “A framework for improving the performance of verifi-cation algorithms with a low false positive rate requirement and limited training data.”In Proc. IEEE/IAPR International Joint Conference on Biometrics, 2014, DOI: 10.1109/BTAS.2014.6996275.
[40] ——, “Hallucinating optimal high-dimensional subspaces.” Pattern Recognition, vol. 47, no. 8, pp. 2662–2672, 2014.