1
Absolute Brain Size Predicts Dog Breed Differences
1
in Executive Function
2
Daniel J. Horschler1,*, Brian Hare2,3, Josep Call4,5, Juliane Kaminski6, Ádám Miklósi7,8, 3
& Evan L. MacLean1 4
1School of Anthropology, University of Arizona, Tucson, AZ, 85719, United States
2Department of Evolutionary Anthropology, Duke University, Durham, NC, 27708, United States 3Center for Cognitive Neuroscience, Duke University, Durham, NC, 27708, United States
4Department of Developmental and Comparative Psychology, Max Planck Institute for Evolutionary Anthropology, Leipzig, Germany
5School of Psychology and Neuroscience, University of St Andrews, St Andrews, United Kingdom 6Department of Psychology, University of Portsmouth, Portsmouth, United Kingdom
2
Abstract
5
Large-scale phylogenetic studies of animal cognition have revealed robust links between 6
absolute brain volume and species differences in executive function. However, past comparative 7
samples have been composed largely of primates, which are characterized by derived neural 8
scaling rules. Therefore, it is currently unknown whether positive associations between brain 9
volume and executive function reflect a broad-scale evolutionary phenomenon, or alternatively, a 10
unique consequence of primate brain evolution. Domestic dogs provide a powerful opportunity for 11
investigating this question due to their close genetic relatedness, but vast intraspecific variation. 12
Using citizen science data on more than 7,000 purebred dogs from 74 breeds, and controlling for 13
genetic relatedness between breeds, we identify strong relationships between estimated absolute 14
brain weight and breed differences in cognition. Specifically, larger-brained breeds performed 15
significantly better on measures of short-term memory and self-control. However, the relationships 16
between estimated brain weight and other cognitive measures varied widely, supporting domain-17
specific accounts of cognitive evolution. Our results suggest that evolutionary increases in brain 18
size are positively associated with taxonomic differences in executive function, even in the absence 19
of primate-like neuroanatomy. These findings also suggest that variation between dog breeds may 20
present a powerful model for investigating correlated changes in neuroanatomy and cognition 21
among closely related taxa. 22
Keywords: cognitive evolution, brain evolution, brain size, executive function, breed differences, 23
3
1. Background
25
Comparative studies suggest that variance in brain size is linked to species differences in 26
some aspects of cognition (Benson-Amram, Dantzer, Stricker, Swanson, & Holekamp, 2016; 27
Deaner, Isler, Burkart, & Van Schaik, 2007; Garamszegi & Eens, 2004; Kotrschal et al., 2013; 28
Kotrschal, Corral-Lopez, Amcoff, & Kolm, 2015; MacLean et al., 2014; Madden, 2001; 29
Overington, Morand-Ferron, Boogert, & Lefebvre, 2009; Reader & Laland, 2002; Shultz & 30
Dunbar, 2010; Sol, Bacher, Reader, & Lefebvre, 2008; Sol, Duncan, Blackburn, Cassey, & 31
Lefebvre, 2005). Studies of relative brain size have revealed interspecific links with problem 32
solving in carnivores (Benson-Amram et al., 2016) and innovativeness in birds (Overington et al., 33
2009), while intraspecific examinations have linked relative brain size to numerical learning, 34
spatial learning, and reversal learning in guppies (Buechel, Boussard, Kotrschal, van der Bijl, & 35
Kolm, 2017; Kotrschal et al., 2013, 2015). Phylogenetic studies of absolute brain size have 36
demonstrated a strong relationship between absolute brain volume and components of executive 37
function (a suite of cognitive abilities involved in behavioral control, including working memory 38
and inhibition) (Deaner et al., 2007; MacLean et al., 2014; Shultz & Dunbar, 2010). However, 39
much of the work linking absolute brain size to executive function has been conducted with 40
primates, and recent advances in comparative neuroanatomy reveal that primates are characterized 41
by unique neural scaling properties, which contrast with those of other orders (Herculano-Houzel, 42
2012, 2017; Herculano-Houzel, Collins, Wong, & Kaas, 2007). Specifically, in most mammals, as 43
brain volume increases, average neuron size tends to increase as well, and neurons become less 44
densely populated in the brain (Herculano-Houzel, 2014, 2017; Herculano-Houzel, Mota, & Lent, 45
2006). In contrast, as primate brains increase in volume, both neuron size and density remain 46
4 2007). As a result, for a given primate and non-primate mammal of equivalent brain size, the 48
primate’s brain is expected to contain more neurons and to have greater neuron density. Similarly, 49
in primates, a two-fold change in brain volume is expected to lead to a two-fold increase in the 50
number of neurons in the larger brain, whereas a two-fold change in volume leads to the addition 51
of many fewer neurons in non-primate mammals. This phenomenon has been proposed to account 52
for the uniqueness of the human brain (but see [Mortensen et al., 2014] for evidence that long-53
finned pilot whales have more neocortical neurons that humans, but lower neuron density), the 54
‘primate advantage’ of increases in brain volume, and previously observed associations between 55
brain volume and species differences in executive function (Deaner et al., 2007; Herculano-56
Houzel, 2012; MacLean et al., 2014). Consequently, it remains unknown whether the relationship 57
between brain volume and executive function reflects a broad-scale evolutionary phenomenon, or 58
alternatively, a unique consequence of primate brain evolution. 59
Therefore, an important test of the association between brain volume and executive 60
function requires analysis with a large sample of taxa that do not adhere to primate-like neural 61
scaling rules. Domesticated dogs, with their extraordinary degree of intraspecific morphological 62
variation (including variation in brain size [Kruska, 1988; Wosinski, Schleicher, & Zilles, 1996]), 63
offer a unique opportunity for such a study. New evidence shows that dogs adhere to the same 64
cortical scaling rules as other non-primate mammals, and that domestication appears to have had 65
no effect on allometric brain scaling in dogs (or other domesticated carnivores examined) (Jardim-66
Messeder et al., 2017). Additionally, previous phylogenetic studies of links between brain size and 67
cognition have been critiqued for ignoring heterogeneity resulting from variation in evolutionary 68
trajectories or different selection pressures on neuroanatomy across taxa (Logan et al., 2018). As 69
5 species (Finlay & Darlington, 1995; Gould et al., 2013; Healy & Krebs, 1992; Lucas, Brodin, de 71
Kort, & Clayton, 2004) dogs allow us to assess the cognitive correlates of changes in absolute 72
brain size while better controlling for changes in the relative sizes of specific brain regions, or 73
other factors that vary considerably across diverse taxonomic groups (Barton & Harvey, 2000; 74
Barton & Venditti, 2014; Gould et al., 2013). Although breed-level variation in neuroanatomy 75
remains largely unexplored, preliminary data suggest that the relative sizes of neural structures do 76
not vary significantly across dog breeds with large degrees of variation in brain volume and skull 77
shape (Roberts, McGreevy, & Valenzuela, 2010; Thames et al., 2009). 78
Here we report the results of analyses investigating the association between estimated brain 79
weight and breed differences in dog cognition, measured in a sample of more than 7,000 80
individuals from 74 breeds, on a battery of cognitive tests designed to probe diverse aspects of 81
cognition (broadly defined as the processes through which animals acquire, store, and act on 82
information from the environment [Shettleworth, 2009]). 83
2. Methods
84
Cognitive data were collected through Dognition.com, a citizen science website that 85
provides dog owners with instructions for completing cognitive experiments with pet dogs in their 86
homes (Bonney et al., 2009; Cooper, 2016). Analyses of these data replicate findings from similar 87
tests conducted in laboratory settings (Stewart et al., 2015), and psychometric analyses of citizen 88
science data yield underlying factors consistent with those obtained from conventional approaches 89
(MacLean, Herrmann, Suchindran, & Hare, 2017). We included data from all ten of Dognition’s 90
primary cognitive tasks in our analyses, measuring a wide range of cognitive skills including 91
components of executive function, inferential and causal reasoning, and communicative processes 92
6 breeds (Online Resource 1: Tables 1-3). Breed-average body weights were compiled from the 94
Canine Behavioral Assessment and Research Questionnaire (C-BARQ) (Hsu & Serpell, 2003; 95
McGreevy et al., 2013), and breed-average brain weights were estimated from a scaling function 96
described by Bronson (1979) and validated using C-BARQ body weights for a sample of 24 breeds 97
with known brain weights (Online Resource 1: Figure 1). To control for genetic relatedness 98
between breeds, the associations between estimated brain weight and cognitive measures were 99
tested using Efficient Mixed Modeling for Association studies (EMMA) (Kang et al., 2008; Zhou 100
& Stephens, 2012). Genetic covariance between breeds was incorporated using a breed-average 101
identity-by-state (IBS) matrix (Boyko et al., 2010), using molecular data from Hayward and 102
colleagues (2016). For analyses including individual level data across breeds, breed-level IBS 103
matrices were multiplied by an individual-level incidence matrix to generate an individual-level 104
IBS matrix. To avoid the assumption that members of the same breed were clonal, pairwise within-105
breed IBS values were set to the average IBS value between members of that breed. Tests were 106
conducted using the ‘EMMREML’ package (Akdemir & Godfrey, 2015) in the R environment 107
(v.3.3.1) (R Core Team, 2016). Associations were considered significant at an alpha level of 0.05. 108
7
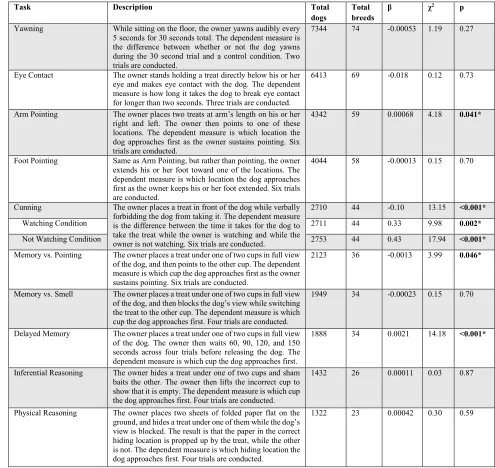
Table 1
110
Task Description Total
dogs
Total breeds
β χ2 p
Yawning While sitting on the floor, the owner yawns audibly every 5 seconds for 30 seconds total. The dependent measure is the difference between whether or not the dog yawns during the 30 second trial and a control condition. Two trials are conducted.
7344 74 -0.00053 1.19 0.27
Eye Contact The owner stands holding a treat directly below his or her eye and makes eye contact with the dog. The dependent measure is how long it takes the dog to break eye contact for longer than two seconds. Three trials are conducted.
6413 69 -0.018 0.12 0.73
Arm Pointing The owner places two treats at arm’s length on his or her right and left. The owner then points to one of these locations. The dependent measure is which location the dog approaches first as the owner sustains pointing. Six trials are conducted.
4342 59 0.00068 4.18 0.041*
Foot Pointing Same as Arm Pointing, but rather than pointing, the owner extends his or her foot toward one of the locations. The dependent measure is which location the dog approaches first as the owner keeps his or her foot extended. Six trials are conducted.
4044 58 -0.00013 0.15 0.70
Cunning The owner places a treat in front of the dog while verbally forbidding the dog from taking it. The dependent measure is the difference between the time it takes for the dog to take the treat while the owner is watching and while the owner is not watching. Six trials are conducted.
2710 44 -0.10 13.15 <0.001*
Watching Condition 2711 44 0.33 9.98 0.002*
Not Watching Condition 2753 44 0.43 17.94 <0.001*
Memory vs. Pointing The owner places a treat under one of two cups in full view of the dog, and then points to the other cup. The dependent measure is which cup the dog approaches first as the owner sustains pointing. Six trials are conducted.
2123 36 -0.0013 3.99 0.046*
Memory vs. Smell The owner places a treat under one of two cups in full view of the dog, and then blocks the dog’s view while switching the treat to the other cup. The dependent measure is which cup the dog approaches first. Four trials are conducted.
1949 34 -0.00023 0.15 0.70
Delayed Memory The owner places a treat under one of two cups in full view of the dog. The owner then waits 60, 90, 120, and 150 seconds across four trials before releasing the dog. The dependent measure is which cup the dog approaches first.
1888 34 0.0021 14.18 <0.001*
Inferential Reasoning The owner hides a treat under one of two cups and sham baits the other. The owner then lifts the incorrect cup to show that it is empty. The dependent measure is which cup the dog approaches first. Four trials are conducted.
1432 26 0.00011 0.03 0.87
Physical Reasoning The owner places two sheets of folded paper flat on the ground, and hides a treat under one of them while the dog’s view is blocked. The result is that the paper in the correct hiding location is propped up by the treat, while the other is not. The dependent measure is which hiding location the dog approaches first. Four trials are conducted.
1322 23 0.00042 0.30 0.59
Table 1. Descriptions of each cognitive task presented in the order in which they were conducted, the number of
111
individual dogs contributing data per task, the number of breeds represented in each task’s analysis, and results from
112
mixed linear models (controlling for genetic relatedness) predicting cognitive performance from estimated brain weight
113
for each task. Significant p-values are denoted in bold.
114
[image:7.612.59.554.91.559.2]8
Figure 1
116
117
Figure 1. Scores on a measure of short-term memory (Delayed Memory) as a function of estimated absolute brain
118
weight across dog breeds. The dashed lines shows the regression slopes from statistical models controlling for genetic
119
relatedness between breeds (a) across all trials, (b) across short delays of 60 and 90 seconds, and (c) across long delays
120
of 120 and 150 seconds. Each breed included in the analyses had at least 20 individuals complete this task, and is
121
represented by one diamond.
122
3. Results
123
(a) Absolute brain size predicts breed differences in executive function. Based on previous
124
studies linking absolute brain size to executive function, we hypothesized that larger-brained 125
breeds would score higher on cognitive measures related to executive function. To test this 126
hypothesis, we fit mixed-models predicting breed-average scores on two tasks indexing 127
components of working memory (short-term memory) and of inhibitory control (self-control) as a 128
function of estimated absolute brain weight. These models revealed significant associations 129
between estimated brain weight and performance on both tasks (Table 1, Figure 1, Figure 2). 130
In the Delayed Memory task, larger-brained breeds correctly remembered the location of 131
hidden food at significantly higher levels than smaller-brained breeds when examining 132
performance after all delays lengths combined (β = 0.0021, χ2(1) = 14.18, p < 0.001; Figure 1a), 133
as well as after short (60s and 90s) and long (120s and 150s) delays (Short delays: β = 0.0017, 134
9 The slope of the association between estimated brain weight and performance was greater at long 136
delays than short delays, suggesting that the gap in performance between breeds of varying brain 137
size generally widens as a function of increased cognitive demands. The effect was weakest at 60 138
seconds (β = 0.0014, χ2(1)= 2.84, p = 0.09), but became significant as delay length increased (90s: 139
β = 0.0020, χ2(1)= 6.99, p = 0.01; 120s: β = 0.0027, χ2(1)= 5.78, p = 0.02; 150s: β = 0.0020, χ2(1) 140
= 5.18, p = 0.02). 141
In the Cunning task, dogs were prohibited from eating a visible food reward, and whether 142
the experimenter watched the dog varied across conditions. Although designed as a measure of 143
sensitivity to human perception, all conditions in this task pose demands on self-control, as dogs 144
were required to inhibit a desire to consume the visible food (see Müller and colleagues [2016] for 145
a similar measure assessing self-control in dogs). In this task, larger-brained breeds were 146
significantly slower to pilfer prohibited food placed directly in front of them than smaller-brained 147
breeds in a condition where a human’s eyes were closed or back was turned (Not Watching), 148
compared to a condition where a human actively watched the subject (Watching; β = -0.10, χ2(1) 149
= 13.15, p < 0.001; Figure 2). Although greater self-control is likely required to inhibit the desire 150
to steal food when not being actively monitored, variation in perspective-taking ability may also 151
contribute to this effect, or smaller-brained breeds may simply be more likely to restrain their 152
actions while being monitored. Thus, we conducted separate analyses of the Watching and Not 153
Watching conditions for this task. In both conditions, larger-brained breeds exhibited greater self-154
control by waiting significantly longer to eat the forbidden food ([Cunning] Watching: β = 0.33, 155
χ2(1) = 9.98, p = 0.002; [Cunning] Not Watching: β = 0.43, χ2(1) = 17.94, p < 0.001). Additionally, 156
the slope of the association between estimated brain weight and time to pilfer food was greater in 157
10 control is required to resist temptation when not being actively monitored. Therefore, with 159
increased task difficulty in both the Cunning and Delayed Memory tasks, the slopes of the 160
associations between cognitive performance and brain size generally become more pronounced. 161
Figure 2 162
[image:10.612.58.527.198.356.2]163
Figure 2. Difference scores between the Watching and Not Watching conditions in the Cunning task (a) and scores
164
on measures of self-control ([b] Cunning: Watching condition; [c] Cunning: Not Watching condition) as a function of
165
estimated brain weight across dog breeds. The dashed lines show the regression slopes from statistical models
166
controlling for genetic relatedness between breeds. Each breed included in the analyses had at least 20 individuals
167
complete this task, and is represented by one diamond.
168
(b) Associations between brain size and cognition vary across cognitive domains. A
169
fundamental question in the cognitive sciences is whether skills for solving diverse problems are 170
subserved by a common set of cognitive processes that are flexibly applied across contexts 171
(domain generality), or alternatively, by specialized processes that are differentially applied in 172
specific contexts (domain specificity). Due to the practical challenges of conducting cognitive 173
experiments with large samples of species, most previous studies investigating links between brain 174
volume and cognition used a small number of cognitive tasks, precluding assessment of the 175
specificity of associations between brain size and measures of cognition. To test the predictions of 176
11 weight broadly predicts breed differences across diverse cognitive measures, or alternatively, if 178
these associations are limited to executive function. 179
Consistent with domain-specific hypotheses (Amici, Barney, Johnson, Call, & Aureli, 180
2012; MacLean et al., 2017), the relationship between estimated brain weight and breed 181
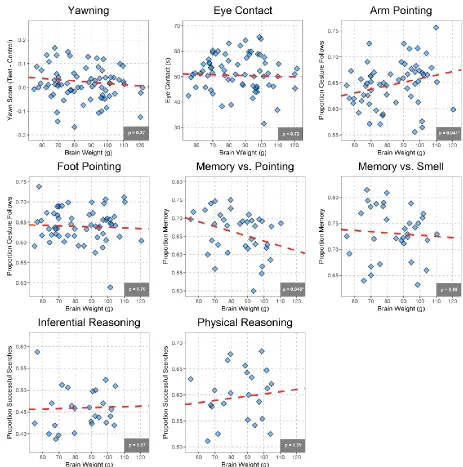
differences in cognition was highly variable across the ten cognitive measures (Table 1, Figure 3). 182
For 6 of the 10 tasks, there was no association between estimated brain weight and breed-average 183
performance ([contagious] Yawning: β = -0.00053, χ2(1) = 1.19, p = 0.27; Eye Contact: β = -0.018, 184
χ2(1) = 0.12, p = 0.73; Foot Pointing: β = -0.00013, χ2(1) = 0.15, p = 0.70; Memory vs. Smell: β = 185
-0.00023, χ2(1) = 0.15, p = 0.70; Inferential Reasoning: β = 0.00011, χ2(1) = 0.03, p = 0.87; 186
Physical Reasoning [visual causality]: β = 0.00042, χ2(1) = 0.30, p = 0.59). In addition to 187
significant associations between estimated brain weight and components of executive function, 188
larger-brained breeds were also significantly more likely to search for food in a location indicated 189
by an arm-pointing gesture (Arm Pointing: β = 0.00068, χ2(1) = 4.18, p = 0.041), and were 190
significantly more likely to rely on this pointing gesture when it was pitted against their own 191
memory of where food had been hidden (Memory vs. Pointing: β = -0.0013, χ2(1) = 3.99, p = 192
0.046). 193
To explore whether behavioral data were stable across trials within tasks significantly 194
associated with estimated brain weight, and whether any variation across time differed as a 195
function of estimated brain weight, we fit mixed-models predicting task performance from trial 196
number alone, as well as from a trial number by estimated brain weight interaction term. To 197
account for repeated measures, all models included a random intercept for breed. Trial number 198
alone was significant predictor of task performance in Cunning due to dogs pilfering forbidden 199
12 Watching condition, as well as in Memory vs. Pointing such that dogs became less likely to follow 201
the pointing gesture over time (Online Resource 1). However, in no cases were there any 202
significant trial number by estimated brain weight interactions (Online Resource 1). The lack of 203
significant interactions between trial number and brain weight demonstrates that while 204
performance varied across trials in some measures, it did not vary differentially across breeds as a 205
function of brain weight. Therefore, the significant associations identified between estimated brain 206
weight and cognitive performance in our main analyses are unlikely to be due to differential 207
13
Figure 3
209
210
Figure 3. Scores on all cognitive tasks except Delayed Memory and Cunning (see Figure 1 and Figure 2) as a function
211
of estimated brain weight across dog breeds. The dashed lines show the regression slopes from statistical models
212
controlling for genetic relatedness between breeds. Each breed included in the analyses had at least 20 individuals
213
complete a given task, and is represented by one diamond.
14
(c) Individual-level analyses. To examine how within-breed variation in cognition may influence 215
our results, we fit mixed-models predicting scores on each task as a function of breed-average 216
estimated brain weight on an individual level (Online Resource 1: Table 4). Results from these 217
individual-level analyses largely mirrored those from the main breed-level analyses: Estimated 218
brain weight was again a significant predictor of performance in each measure which primarily 219
indexed components of executive function (Delayed Memory: β = 0.0015, χ2(1) = 11.06, p < 0.001; 220
[Cunning] Watching: β = 0.27, χ2(1) = 10.25, p = 0.001; [Cunning] Not Watching: β = 0.33, χ2(1) 221
= 15.34, p < 0.001), as well as difference scores between conditions in the Cunning task (β = -222
0.080, χ2(1) = 13.40, p < 0.001) and performance in Arm Pointing (β = 0.00068, χ2(1) = 6.51, p = 223
0.01). However, unlike results from the breed-level analyses, the association between estimated 224
brain weight and performance in Memory vs. Pointing fell slightly above the significance threshold 225
(β = -0.0011, χ2(1) = 3.64, p = 0.056), while a significant association emerged between estimated 226
brain weight and performance in Physical Reasoning (β = 0.00092, χ2(1) = 4.00, p = 0.045). 227
(d) Body size. As breed-average brain weights were estimated from breed-average body weights
228
in our main analyses, we expected to find many similar associations between cognition and body 229
size. Mixed-models predicting task scores as a function of CBARQ-reported breed-average body 230
weight generally revealed the same pattern of results as those using breed-average estimated brain 231
weight as the predictor; body weight was a significant predictor of performance in Delayed 232
Memory, Cunning, and the Watching and Not Watching conditions analyzed separately, but 233
associations between body weight and Arm Pointing (p = 0.07) and Memory vs. Pointing (p = 234
0.06) fell slightly above the significance threshold (Online Resource 1). In the majority of cases, 235
linear models using estimated brain weight as the predictor had a lower AIC and explained a larger 236
15 predictor, but differences in AIC and adjusted R2 were generally small (Online Resource 1). Even 238
in studies using more direct measures of brain size rather than estimation, the challenge of 239
disentangling associations with absolute brain size and body size is evident as the two variables 240
are often very highly correlated (MacLean et al., 2014). 241
To explore whether the same associations between cognition and brain size would emerge 242
when estimating average brain weight independently from body weight, we compiled breed-243
average skull measurements from Boyko et al. (2010) for a subset of breeds (n = 27) for whom 244
data was available. To assess which skull measures best predicted brain weight, we first fit a 245
multiple regression model predicting known breed-average brain weights from Bronson (1979) 246
using breeds for which both skull measurements and brain weights were available (n = 12) as a 247
function of cranial depth, maximum cranial width, and least cranial width. As results from this 248
model showed that only cranial depth was a significant predictor of brain weight controlling for 249
the other predictors, we next fit a simple linear regression model predicting brain weight from 250
cranial depth alone. Breed-average cranial depth explained a greater proportion of the variance in 251
brain weight and had a lower model AIC (β = 0.01, F(1, 10) = 119.4, p < 0.001, adjusted R2 = 252
0.92, AIC = 82.13) than did CBARQ-reported breed-average body weight in this same subset (β 253
= 1.03, F(1, 10) = 62.83, p < 0.001, adjusted R2 = 0.85, AIC = 89.03), suggesting that cranial depth 254
was a better predictor of brain weight than body weight in this sample. We then used cranial depth 255
to predict breed-average brain weight across the 27 breeds for which cognitive data and skull 256
measurements were available. Lastly, we fit mixed-models (controlling for genetic relatedness 257
between breeds) predicting scores on each cognitive task as a function these new brain weight 258
estimates. Breed-average brain weight estimated from cranial depth significantly predicted 259
16 Memory: β = 0.0014, χ2(1) = 4.91, p = 0.03; [Cunning] Watching: β = 0.43, χ2(1) = 4.51, p = 0.03; 261
[Cunning] Not Watching: β = 0.49, χ2(1) = 6.72, p = 0.01), but did not significantly predict 262
performance in Arm Pointing (β = -0.0002, χ2(1) = 0.09, p = 0.76), Memory vs. Pointing (β = 263
0.0002, χ2(1) = 0.02, p = 0.89), or difference scores between conditions in the Cunning task (β = -264
0.06, χ2(1) = 0.69, p = 0.41). Therefore, estimates of breed-average brain weight derived 265
independently of breed-average body weight were significantly associated with measures of short-266
term memory and self-control, but not other cognitive measures. 267
The findings above reveal a range of associations between estimated brain weight and 268
breed differences in cognition. However, it remains possible that additional factors, which covary 269
with body weight and brain weight, may partially account for these associations. To address this 270
possibility, we conducted additional analyses with potentially confounding variables. 271
(e) Perceptual factors. Previous studies suggest that skull shape is associated with aspects of 272
visual perception in dogs. Specifically, brachycephalic dogs (defined by a high cephalic index 273
(CI), see Online Resource 1) are characterized by more forward-facing eyes and greater ocular 274
overlap (Gácsi, McGreevy, Kara, & Miklósi, 2009; Helton & Helton, 2010). Gácsi et al. (2009) 275
found that brachycephalic breeds were significantly better at following human pointing cues as 276
compared to dolichocephalic breeds (low CI), and suggested that this result may be partially 277
attributable to breed differences in visual perception. Our sample contained 50 breeds for which 278
CI measurements were reported in (McGreevy et al., 2013) or (Boyko et al., 2010), and in these 279
breeds, CI was significantly negatively correlated with estimated brain weight (r = -0.43, p = 280
0.002). Thus, explanations invoking breed differences in vision yield predictions opposite to what 281
we observed in measures of short-term memory, self-control, and gesture following. Indeed, in 282
17 correlated with performance in measures of short-term memory and self-control (Delayed 284
Memory: r = -0.47, p = 0.02; [Cunning] Watching: r = -0.41, p = 0.02; [Cunning] Not Watching: 285
r = -0.52, p = 0.002), and was not significantly correlated with measures of gesture following (Arm 286
Pointing: r = -0.19, p = 0.24; Memory vs. Pointing: r = -0.04, p = 0.85). Additionally, because we 287
do not find consistent relationships between estimated brain weight and cognitive performance 288
across tasks incorporating highly similar experimental set-ups and identical stimulus presentation 289
distances, it is highly unlikely that breed differences in vision play a large role in the relationships 290
we observed. 291
(f) Training history. A second important consideration relates to possible effects of training 292
history on these cognitive measures. Using questionnaire data submitted to Dognition.com, we 293
found that breeds with larger brains were more likely to have attended at least one obedience class 294
(r = 0.71, p < 0.001), and were more likely to have been extensively trained (r = 0.75, p = 0.01). 295
Although this information was not available for the majority of our subjects (precluding inclusion 296
as a covariate in the main breed-level analyses), we fit mixed-models predicting scores on each 297
task as a function of breed-average estimated brain weight and owner-reported extent of training 298
history on an individual level including dogs for which both measures were available (Table 2). 299
These analyses revealed that controlling for training history, estimated brain weight was a 300
significant predictor of performance in each measure which primarily indexed components of 301
executive function (Delayed Memory: β = 0.0015, χ2(1) = 4.22, p = 0.40; [Cunning] Watching: β 302
= 0.35, χ2(1) = 12.95, p < 0.001; [Cunning] Not Watching: β = 0.38, χ2(1) = 17.93, p < 0.001), but 303
was not a significant predictor of performance in any other measures (Yawning: β = -0.00043, 304
χ2(1) = 0.21, p = 0.64; Eye Contact: β = -0.068, χ2(1) = 1.17, p = 0.28; Arm Pointing: β = 0.00056, 305
18 χ2(1) = 0.25, p = 0.62; Memory vs. Pointing: β = -0.00095, χ2(1) = 0.91, p = 0.34; Memory vs. 307
Smell: β = -0.00021, χ2(1) = 0.078, p = 0.78; Inferential Reasoning: β = 0.00082, χ2(1) = 1.17, p = 308
0.28; Physical Reasoning: β = 0.0011, χ2(1) = 2.42, p = 0.12). Therefore, as in the breed-level 309
analyses, estimated brain weight was a significant predictor of performance on measures of short-310
term memory and self-control, even after controlling for training history on an individual level. 311
However, unlike results from the main breed-level analyses (but mirroring the pattern of results 312
obtained using cranial depth rather than body weight to estimate brain weight in a subset of our 313
sample), estimated brain weight was not a significant predictor of difference scores between 314
conditions in the Cunning task or of reliance on gesture following in Arm Pointing or Memory vs. 315
Pointing after controlling for training history. We also found that controlling for estimated brain 316
weight, training history was a significant predictor of performance in the Watching (β = 8.67, χ2(1) 317
= 31.08, p < 0.001) and Not Watching (β = 8.55, χ2(1) = 30.02, p < 0.001) conditions of the 318
Cunning task, as well as in Eye Contact (β = 3.60, χ2(1) = 15.87, p < 0.001), Arm Pointing (β = 319
0.024, χ2(1) = 8.18, p = 0.004), Memory vs. Pointing (β = -0.041, χ2(1) = 5.94, p = 0.015), and 320
Inferential Reasoning (β = 0.029, χ2(1) = 3.96, p = 0.047), but was not a significant predictor of 321
performance in the six remaining measures (Yawning: β = -0.018, χ2(1) = 0.95, p = 0.33; Foot 322
Pointing: β = 0.0097, χ2(1) = 1.11, p = 0.29; Cunning: β =0.35, χ2(1) = 0.16, p = 0.69; Memory vs. 323
Smell: β = -0.027, χ2(1) = 3.55, p = 0.059; Delayed Memory: β = 0.026, χ2(1) = 3.46, p = 0.063; 324
Physical Reasoning: β = 0.18, χ2(1) = 1.71, p = 0.19). It is important to note that in measures of 325
self-control (Watching and Not Watching conditions of Cunning), both estimated brain weight and 326
training history made independent significant contributions to task performance, the latter of which 327
is unsurprising given that owners verbally forbid subjects from taking visible food (a commonly 328
19
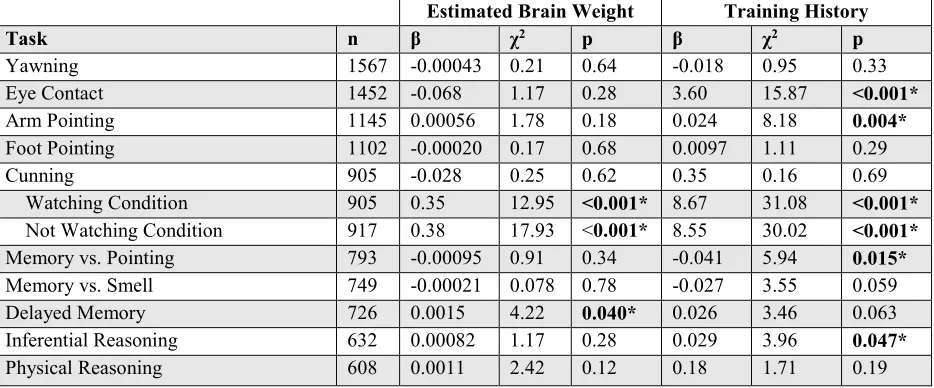
Table 2
330
Estimated Brain Weight Training History
Task n β χ2 p β χ2 p
Yawning 1567 -0.00043 0.21 0.64 -0.018 0.95 0.33
Eye Contact 1452 -0.068 1.17 0.28 3.60 15.87 <0.001*
Arm Pointing 1145 0.00056 1.78 0.18 0.024 8.18 0.004*
Foot Pointing 1102 -0.00020 0.17 0.68 0.0097 1.11 0.29
Cunning 905 -0.028 0.25 0.62 0.35 0.16 0.69
Watching Condition 905 0.35 12.95 <0.001* 8.67 31.08 <0.001*
Not Watching Condition 917 0.38 17.93 <0.001* 8.55 30.02 <0.001*
Memory vs. Pointing 793 -0.00095 0.91 0.34 -0.041 5.94 0.015*
Memory vs. Smell 749 -0.00021 0.078 0.78 -0.027 3.55 0.059
Delayed Memory 726 0.0015 4.22 0.040* 0.026 3.46 0.063
Inferential Reasoning 632 0.00082 1.17 0.28 0.029 3.96 0.047*
Physical Reasoning 608 0.0011 2.42 0.12 0.18 1.71 0.19
Table 2. Results from mixed linear models (controlling for breed-level genetic relatedness) predicting cognitive
331
performance from breed-average estimated brain weight and owner-reported training history for each task on an
332
individual level. The training history variable was derived from a questionnaire item asking owners, “How much
333
training has your dog received?” Owners responded on an ordinal scale including “None,” “Little,” “Some,” and
334
“Substantial” as response options. Significant p-values are denoted in bold.
335
(g) Functional breed group classification. A third consideration is that modern dog breeds have 336
been selected for a variety of functional roles, with some roles (e.g. hunting and herding) requiring 337
extensive cooperation with humans (Coppinger & Schneider, 1995). Previous studies suggest that 338
dogs bred for cooperative roles may be more likely to follow human gestures (Udell, Ewald, Dorey, 339
& Wynne, 2014; Wobber, Hare, Koler-Matznick, Wrangham, & Tomasello, 2009). Thus, to 340
control for potential effects of breed group, we fit models including American Kennel Club (AKC) 341
breed group designation and estimated absolute brain weight as predictors of performance. For the 342
Memory vs. Pointing task, but none of the other measures significantly associated with estimated 343
brain weight in the main analyses, a log likelihood ratio test revealed that controlling for brain 344
weight, breed group was a significant predictor of performance (χ2(6) = 1.35, p = 0.03) but not 345
vice-versa (χ2(1) = 0.04, p = 0.15). AKC-classified “Sporting” and “Working” breeds were the 346
20 Working: mean = 0.63, SEM = 0.02), while breeds in the “Terrier” and “Herding” groups were the 348
least likely (Terrier: mean = 0.70, SEM = 0.01; Herding: mean = 0.69, SEM = 0.01). While 349
increased tendencies to follow an arm-pointing gesture over memory in the Memory vs. Pointing 350
task may be better explained by differences in AKC breed group than by differences in brain size, 351
we find only mixed support for the idea that selection for cooperative roles is primarily responsible 352
for this result, as breeds belonging to the Herding group were among the least likely to follow 353
gestures in this task. 354
4. Discussion
355
Our findings support the hypothesis that increases in absolute brain size are associated with 356
aspects of executive function, even in the absence of primate-like neuroanatomy. This result raises 357
new questions about the cognitive consequences of evolutionary changes in brain size, and 358
suggests that even within a species, brain size is associated with some aspects of cognition. By 359
investigating intraspecific variance in a species characterized by high levels of morphological 360
diversity, this study circumvents some challenges inherent to previous interspecific comparisons. 361
Specifically, across species, differences in absolute brain volume can be confounded with changes 362
in the relative proportions of specific brain regions. This phenomenon can arise both due to 363
specialization of specific brain structures (mosaic brain evolution [Barton & Harvey, 2000; Barton 364
& Venditti, 2014; Gould et al., 2013]) resulting from heterogeneity in selection pressures on 365
neuroanatomical variation across taxa (Logan et al., 2018), or due to conserved developmental 366
processes involving the timing of neurogenesis, which yield disproportionate enlargement of late 367
developing structures (e.g. the neocortex) in larger-brained taxa (Finlay & Darlington, 1995; Kaas, 368
2000). Regarding the latter possibility, there are currently few data on the development of brain 369
21 subject to these conserved developmental constraints which induce allometry (deviation from 1:1 371
scaling) between total brain volume and specific regions of the brain. Specifically, in contrast to 372
comparative mammalian samples, imaging studies have shown that there are no significant 373
differences in the proportional sizes of the cerebellum, forebrain, or brainstem across dog breeds 374
with widely varying total brain volumes (Thames et al., 2009), or in absolute size of the olfactory 375
lobe across breeds with widely varying skull shapes (Roberts et al., 2010). This finding is 376
consistent with the notion that allometric relationships which apply across species often do not 377
hold within species (Armstrong, 1990), leading researchers to suggest that the extraordinary 378
morphological variation of dogs makes this species an ideal candidate for investigating 379
intraspecific brain scaling and the cognitive implications thereof (Jardim-Messeder et al., 2017). 380
Importantly, even with a lack of isometric (i.e. 1:1) scaling between brain volume and the 381
number of neurons in the brain, larger dog brains are still expected to contain more neurons than 382
smaller dog brains. In the only comparison of dog neuron counts to date, Jardim-Messeder and 383
colleagues found that the cortex of a golden retriever with a body weight of 32kg contained 627 384
million neurons, while the cortex of an unknown breed with a body weight of 7.45kg contained 385
429 million neurons (Jardim-Messeder et al., 2017). Thus, if the number of neurons in the brain is 386
expected to predict taxonomic differences in executive function (Herculano-Houzel, 2017), our 387
findings are consistent with this hypothesis. However, because increases in volume are expected 388
to result in the addition of many fewer neurons in dog brains than primate brains, we would 389
theoretically expect differences in the slope of the relationship between brain volume and measures 390
of executive function between these taxonomic groups given adequate control of extraneous 391
22 A second major finding from this study is that the relationship between estimated brain 393
weight and breed differences in cognition varied widely across cognitive tasks. For example, we 394
found only limited evidence for an association between estimated brain weight and reasoning about 395
causal properties of the world, and no evidence for an association between estimated brain weight 396
and inferential reasoning, use of a novel communicative gesture (foot pointing), or measures of 397
eye contact with a human. After controlling for training history at an individual level, we also 398
found no evidence for an association between estimated brain weight and reliance on following 399
communicative pointing cues to locate food. This result supports domain-specific accounts of 400
cognition, and is consistent with previous comparative studies which have revealed links between 401
brain volume and executive function, but no association between brain volume and other domains 402
of cognition (MacLean et al., 2013). As suggested by domain specificity, absolute brain size is 403
therefore unlikely to be an informative predictor of all cognitive abilities. However, absolute brain 404
size may be particularly important for executive function, because these processes exert high-level 405
‘supervisory’ control over a variety of more specialized cognitive functions. Additionally, these 406
results suggest that the significant associations between estimated brain weight and measures of 407
executive function are unlikely to be artifacts of breed differences in motivation or perception, in 408
which case we would have expected similar associations for all tasks involving a search for food, 409
or requiring attention to visual stimuli in the frontal field. 410
One limitation of this study stems from the lack of individual-level brain weight data from 411
the dogs in our sample. While the scaling function used to estimate breed-average brain weights 412
described by Bronson (1979) explained an overwhelming proportion of the variance in brain 413
weight (93%) in Bronson’s sample (26 breeds ranging from 3.6kg to 55.0kg in body weight), and 414
23 we cannot rule out the possibility that brain-to-body size scaling in breeds absent from Bronson’s 416
sample deviate from the scaling relationship used in our estimates. However, while estimates of 417
brain weight based on body weight are subject to prediction error, the effects of this error are 418
minimized in comparisons of taxa characterized by large differences in body size. Given the over 419
17-fold variation in body weight across breeds in our sample (range: 3.35kg – 59.75kg), and 420
confirmation of a strong link between body and brain weight in dogs (Bronson, 1979), it is highly 421
unlikely that prediction error substantially influenced our results. As expected given the strong 422
association between body and brain weight, the observed associations between cognition and 423
estimated absolute brain size are generally the same as those that exist between cognition and body 424
weight in our sample. However, we found the same links between absolute brain size and executive 425
function in a subset of our sample using brain weight estimated from skull measurements, rather 426
than body weight. Relatedly, the exact intraspecific neural scaling rules of dog brains remain 427
unknown, but it is of note that the two individuals examined in (Jardim-Messeder et al., 2017) fit 428
the interspecific neural scaling rules that apply across non-primate mammals. Future work can 429
address these limitations by examining how differences in cognition relate to variation in brain 430
size and neuron count on an individual level both within and across dog breeds. Similarly, without 431
independent measures of brain and body mass, we were unable to explore possible associations 432
between relative brain size and performance on the cognitive tasks. 433
In conclusion, our findings suggest that evolutionary relationships between executive 434
function and absolute brain size do not require primate-like neural scaling rules, that these 435
relationships may be independent of changes in the relative sizes of specific areas of the brain, and 436
that associations between brain size and cognition vary across cognitive domains. These findings 437
24 and suggest that dog breeds provide a powerful and highly tractable model for assessing the 439
25
Acknowledgments
441
We thank Laurie Santos, Richard Wrangham, David Ivy, Eliot Cohen, Kip Frey, and all 442
other members of the Dognition.com team for their help in the creation of Dognition.com; Adam 443
Boyko, Martin Schmidt, and James Serpell for sharing data used in this project; and especially all 444
of the dog owners who participated in Dognition.com experiments as citizen scientists. 445
Competing Interests
446
BH is a founder of Dognition.com and a member of its Scientific Advisory Board. JC, JK, 447
and ÁM are also members of the Dognition.com Scientific Advisory Board. 448
Author Contributions
449
BH, JC, JK, ÁM, and ELM conceived and designed the experiments. DJH and ELM 450
analyzed the data. DJH, BH, JC, JK, ÁM, and ELM wrote the paper. 451
Data Accessibility
452
Data are available as electronic supplementary material. 453
Funding
454
DJH was supported by an Emil W. Haury Fellowship from the School of Anthropology at 455
the University of Arizona, and a Graduate Access Fellowship from the Graduate College at the 456
University of Arizona. 457
Compliance with Ethical Standards
458
All animals included in this study were pet dogs tested by citizen scientists in their own 459
homes. The use of third party data from Dognition.com was approved by Duke University 460
IACUC protocol A138-11-06 and data were collected in accordance with relevant guidelines and 461
26
References
463
Akdemir, D., & Godfrey, O. U. (2015). EMMREML: Fitting Mixed Models with Known 464
Covariance Structures. 465
Amici, F., Barney, B., Johnson, V. E., Call, J., & Aureli, F. (2012). A Modular Mind? A Test 466
Using Individual Data from Seven Primate Species. PLoS ONE, 7(12). 467
http://doi.org/10.1371/journal.pone.0051918 468
Armstrong, E. (1990). Brains, bodies and metabolism. Brain, Behavior and Evolution, 36, 166– 469
176. http://doi.org/10.1159/000115305 470
Barton, R. A., & Harvey, P. H. (2000). Mosaic evolution of brain structures in mammals. Nature, 471
405(1997), 1055–1058. 472
Barton, R. A., & Venditti, C. (2014). Rapid evolution of the cerebellum in humans and other 473
great apes. Current Biology, 24(20), 2440–2444. http://doi.org/10.1016/j.cub.2014.08.056 474
Benson-Amram, S., Dantzer, B., Stricker, G., Swanson, E. M., & Holekamp, K. E. (2016). Brain 475
size predicts problem-solving ability in mammalian carnivores. Proceedings of the National
476
Academy of Sciences, 113(9), 2532–2537. http://doi.org/10.1073/pnas.1505913113 477
Bonney, R., Cooper, C. B., Dickinson, J., Kelling, S., Phillips, T., Rosenberg, K. V, & Shirk, J. 478
(2009). Citizen Science: A Developing Tool for Expanding Science Knowledge and 479
Scientific Literacy. BioScience, 59(11), 977–984. http://doi.org/10.1525/bio.2009.59.11.9 480
Boyko, A. R., Quignon, P., Li, L., Schoenebeck, J. J., Degenhardt, J. D., Lohmueller, K. E., … 481
Ostrander, E. A. (2010). A simple genetic architecture underlies morphological variation in 482
dogs. PLoS Biology, 8(8), 49–50. http://doi.org/10.1371/journal.pbio.1000451 483
Bray, E. E., MacLean, E. L., & Hare, B. A. (2015). Increasing arousal enhances inhibitory 484
27 http://doi.org/10.1016/S2215-0366(16)30284-X.Epidemiology
486
Bronson, R. T. (1979). Brain weight-body weight scaling in breeds of dogs and cats. Brain,
487
Behavior, and Evolution, 16, 227–236. 488
Buechel, S. D., Boussard, A., Kotrschal, A., van der Bijl, W., & Kolm, N. (2017). Brain size 489
affects performance in a reversal-learning test. Proceedings of the Royal Society of London
490
Series B-Biological Sciences, in press(January). http://doi.org/10.1098/rspb.2017.2031 491
Cooper, C. (2016). Citizen science: How ordinary people are changing the face of discovery. 492
The Overlook Press. 493
Coppinger, R., & Schneider, R. (1995). Evolution of working dogs. In The domestic dog: its
494
evolution, behaviour and interactions with people (pp. 21–47). Cambridge University Press. 495
Deaner, R. O., Isler, K., Burkart, J., & Van Schaik, C. (2007). Overall brain size, and not 496
encephalization quotient, best predicts cognitive ability across non-human primates. Brain,
497
Behavior and Evolution, 70(2), 115–124. http://doi.org/10.1159/000102973 498
Finlay, B., & Darlington, R. (1995). Linked regularities in the development and evolution of 499
mammalian brains. Science, 268(5217), 1578–1584. http://doi.org/10.1126/science.7777856 500
Gácsi, M., McGreevy, P. D., Kara, E., & Miklósi, Á. (2009). Effects of selection for cooperation 501
and attention in dogs. Behavioral and Brain Functions : BBF, 5, 31. 502
http://doi.org/10.1186/1744-9081-5-31 503
Garamszegi, L. Z., & Eens, M. (2004). The evolution of hippocampus volume and brain size in 504
relation to food hoarding in birds. Ecology Letters, 7(12), 1216–1224. 505
http://doi.org/10.1111/j.1461-0248.2004.00685.x 506
Gould, K. L., Gilbertson, K. E., Seyfer, A. L., Brantner, R. M., Hrvol, A. J., Kamil, A. C., & 507
28 hippocampus neurons among five corvid species. Brain, Behavior and Evolution, 81(1), 56– 509
70. http://doi.org/10.1146/annurev-immunol-032713-120240.Microglia 510
Hayward, J. J., Castelhano, M. G., Oliveira, K. C., Corey, E., Balkman, C., Baxter, T. L., … 511
Boyko, A. R. (2016). Complex disease and phenotype mapping in the domestic dog. Nature
512
Communications, 7(10460), 1–11. http://doi.org/10.1038/ncomms10460 513
Healy, S. D., & Krebs, J. R. (1992). Foord storing and the hippocampus in corvids: amount and 514
volume are correlated. Proceeding of the Royal Society of London, 248(May 2013), 241– 515
245. http://doi.org/10.1098/rspb.1992.0068 516
Helton, W. S., & Helton, N. D. (2010). Physical size matters in the domestic dog’s (Canis lupus 517
familiaris) ability to use human pointing cues. Behavioural Processes, 85(1), 77–79. 518
http://doi.org/10.1016/j.beproc.2010.05.008 519
Herculano-Houzel, S. (2012). Neuronal scaling rules for primate brains: The primate advantage. 520
In Progress in Brain Research (1st ed., Vol. 195, pp. 325–340). Elsevier B.V. 521
http://doi.org/10.1016/B978-0-444-53860-4.00015-5 522
Herculano-Houzel, S. (2014). The glia/neuron ratio: How it varies uniformly across brain 523
structures and species and what that means for brain physiology and evolution. Glia, 62(9), 524
1377–1391. http://doi.org/10.1002/glia.22683 525
Herculano-Houzel, S. (2017). Numbers of neurons as biological correlates of cognitive 526
capability. Current Opinion in Behavioral Sciences, 16, 1–7. 527
http://doi.org/10.1016/j.cobeha.2017.02.004 528
Herculano-Houzel, S., Collins, C. E., Wong, P., & Kaas, J. H. (2007). Cellular scaling rules for 529
primate brains. Proceedings of the National Academy of Sciences of the United States of
530
29 [pii]\r10.1073/pnas.0611396104
532
Herculano-Houzel, S., Mota, B., & Lent, R. (2006). Cellular scaling rules for rodent brains. 533
Proceedings of the National Academy of Sciences, 103(32), 12138–12143. 534
http://doi.org/10.1016/B0-12-370878-8/00345-1 535
Hsu, Y., & Serpell, J. A. (2003). Development and validation of a questionnaire for measuring 536
behavior and temperament traits in pet dogs. Journal of the American Veterinary Medical
537
Association, 223(9), 1293–1300. 538
Jardim-Messeder, D., Lambert, K., Noctor, S., Pestana, F. M., de Castro Leal, M. E., Bertelsen, 539
M. F., … Herculano-Houzel, S. (2017). Dogs Have the Most Neurons, Though Not the 540
Largest Brain: Trade-Off between Body Mass and Number of Neurons in the Cerebral 541
Cortex of Large Carnivoran Species. Frontiers in Neuroanatomy, 11(December), 1–18. 542
http://doi.org/10.3389/fnana.2017.00118 543
Kaas, J. H. (2000). Why is brain size so important: Design problems and solutions as neocortex 544
gets bigger or smaller. Brain and Mind, 1(1), 7–23. 545
http://doi.org/10.1023/A:1010028405318 546
Kang, H. M., Zaitlen, N. A., Wade, C. M., Kirby, A., Heckerman, D., Daly, M. J., & Eskin, E. 547
(2008). Efficient control of population structure in model organism association mapping. 548
Genetics, 178, 1709–1723. http://doi.org/10.1534/genetics.107.080101 549
Kotrschal, A., Corral-Lopez, A., Amcoff, M., & Kolm, N. (2015). A larger brain confers a 550
benefit in a spatial mate search learning task in male guppies. Behavioral Ecology, 26(2), 551
527–532. http://doi.org/10.1093/beheco/aru227 552
Kotrschal, A., Rogell, B., Bundsen, A., Svensson, B., Zajitschek, S., Brannstrom, I., … Kolm, N. 553
30 evolving a larger brain. Current Biology, 23, 168–171.
555
Kruska, D. (1988). Effects of domestication on brain structure and behavior in mammals. Human
556
Evolution, 3(6), 473–485. http://doi.org/10.1007/BF02436333 557
Logan, C. J., Avin, S., Boogert, N., Buskell, A., Cross, F. R., Currie, A., … Montgomery, S. H. 558
(2018). Beyond brain size: Uncovering the neural correlates of behavioral and cognitive 559
specialization. Comparative Cognition & Behavior Reviews, 13, 55–89. 560
http://doi.org/10.3819/CCBR.2018.130008 561
Lucas, J. R., Brodin, A., de Kort, S. R., & Clayton, N. S. (2004). Does hippocampal size 562
correlate with the degree of caching specialization? Proceedings of the Royal Society B:
563
Biological Sciences, 271(1556), 2423–2429. http://doi.org/10.1098/rspb.2004.2912 564
MacLean, E. L., Hare, B., Nunn, C. L., Addessi, E., Amici, F., Anderson, R. C., … Zhao, Y. 565
(2014). The evolution of self-control. Proceedings of the National Academy of Sciences, 566
111(20), E2140–E2148. http://doi.org/10.1073/pnas.1323533111 567
MacLean, E. L., Herrmann, E., Suchindran, S., & Hare, B. (2017). Individual differences in 568
cooperative communicative skills are more similar between dogs and humans than 569
chimpanzees. Animal Behaviour, 126, 41–51. http://doi.org/10.1016/j.anbehav.2017.01.005 570
MacLean, E. L., Sandel, A. A., Bray, J., Oldenkamp, R. E., Reddy, R. B., & Hare, B. (2013). 571
Group Size Predicts Social but Not Nonsocial Cognition in Lemurs. PLoS ONE, 8(6), 1–9. 572
http://doi.org/10.1371/journal.pone.0066359 573
Madden, J. (2001). Sex, bowers and brains. Proceedings:Biological Sciences, 268(1469), 833–8. 574
http://doi.org/10.1098/rspb.2000.1425 575
McGreevy, P. D., Georgevsky, D., Carrasco, J., Valenzuela, M., Duffy, D. L., & Serpell, J. A. 576
31 http://doi.org/10.1371/journal.pone.0080529
578
Mortensen, H. S., Pakkenberg, B., Dam, M., Dietz, R., Sonne, C., Mikkelsen, B., & Eriksen, N. 579
(2014). Quantitative relationships in delphinid neocortex. Frontiers in Neuroanatomy, 580
8(November), 1–10. http://doi.org/10.3389/fnana.2014.00132 581
Müller, C. A., Riemer, S., Virányi, Z., Huber, L., & Range, F. (2016). Inhibitory control, but not 582
prolonged object-related experience appears to affect physical problem-solving performance 583
of pet dogs. PLoS ONE, 11(2), 1–19. http://doi.org/10.1371/journal.pone.0147753 584
Overington, S. E., Morand-Ferron, J., Boogert, N. J., & Lefebvre, L. (2009). Technical 585
innovations drive the relationship between innovativeness and residual brain size in birds. 586
Animal Behaviour, 78(4), 1001–1010. http://doi.org/10.1016/j.anbehav.2009.06.033 587
R Core Team. (2016). A Language and Environment for Statistical Computing. Vienna, Austria:
588
R Foundation for Statistical Computing. http://doi.org/citeulike-article-id:2400517 589
Reader, S. M., & Laland, K. N. (2002). Social intelligence, innovation, and enhanced brain size 590
in primates. Proceedings of the National Academy of Sciences, 99(7), 4436–4441. 591
http://doi.org/10.1073/pnas.062041299 592
Roberts, T., McGreevy, P., & Valenzuela, M. (2010). Human induced rotation and 593
reorganization of the brain of domestic dogs. PLoS ONE, 5(7). 594
http://doi.org/10.1371/journal.pone.0011946 595
Shettleworth, S. J. (2009). Cognition, Evolution, and Behavior (2nd ed.). Oxford University 596
Press. 597
Shultz, S., & Dunbar, R. I. M. (2010). Species differences in executive function correlate with 598
hippocampus volume and neocortex ratio across nonhuman primates. Journal of
599
32 Sol, D., Bacher, S., Reader, S. M., & Lefebvre, L. (2008). Brain size predicts the success of 601
mammal species introduced into novel environments. The American Naturalist, 172
602
Suppl(July), S63-71. http://doi.org/10.1086/588304 603
Sol, D., Duncan, R. P., Blackburn, T. M., Cassey, P., & Lefebvre, L. (2005). Big brains, 604
enhanced cognition, and response of birds to novel environments. Proceedings of the
605
National Academy of Sciences of the United States of America, 102(15), 5460–5465. 606
http://doi.org/10.1073/pnas.0408145102 607
Stewart, L., MacLean, E. L., Ivy, D., Woods, V., Cohen, E., Rodriguez, K., … Hare, B. (2015). 608
Citizen science as a new tool in dog cognition research. PLoS ONE, 10(9), 1–16. 609
http://doi.org/10.1371/journal.pone.0135176 610
Thames, R. A., Robertson, I. D., Flegel, T., Henke, D., O’Brien, D. P., Coates, J. R., & Olby, N. 611
J. (2009). Development of a morphometric magnetic resonance paramater suitable for 612
distinguishing between normal dogs and dogs with cerebellar atrophy. Canine Brain
613
Morphometry, 51(3), 246–253. http://doi.org/10.1111/j.1740-8261.2009.01655.x 614
Udell, M. A. R., Ewald, M., Dorey, N. R., & Wynne, C. D. L. (2014). Exploring breed 615
differences in dogs (Canis familiaris): Does exaggeration or inhibition of predatory 616
response predict performance on human-guided tasks? Animal Behaviour, 89, 99–105. 617
http://doi.org/10.1016/j.anbehav.2013.12.012 618
Wobber, V., Hare, B., Koler-Matznick, J., Wrangham, R., & Tomasello, M. (2009). Breed
619
differences in domestic dogs’ (Canis familiaris) comprehension of human communicative
620
signals. Interaction Studies (Vol. 10). http://doi.org/10.1075/is.10.2.06wob 621
Wosinski, M., Schleicher, A., & Zilles, K. (1996). Quantitative analysis of gyrification of 622
33 Zhou, X., & Stephens, M. (2012). Genome-wide efficient mixed model analysis for association 624
![Figure 2. Difference scores between the Watching and Not Watching conditions in the Cunning task (a) and scores on measures of self-control ([b] Cunning: Watching condition; [c] Cunning: Not Watching condition) as a function of estimated brain weight acros](https://thumb-us.123doks.com/thumbv2/123dok_us/8549574.362362/10.612.58.527.198.356/difference-watching-watching-conditions-watching-watching-condition-estimated.webp)