This is a repository copy of Pre-failure instability of sand under dilatancy rate controlled conditions.
White Rose Research Online URL for this paper: http://eprints.whiterose.ac.uk/109390/
Version: Accepted Version
Article:
Chu, J, Wanatowski, D, Loke, WL et al. (1 more author) (2015) Pre-failure instability of sand under dilatancy rate controlled conditions. Soils and Foundations, 55 (2). pp. 414-424. ISSN 0038-0806
https://doi.org/10.1016/j.sandf.2015.02.015
For example: © 2015. This manuscript version is made available under the CC-BY-NC-ND 4.0 license http://creativecommons.org/licenses/by-nc-nd/4.0/
[email protected] https://eprints.whiterose.ac.uk/ Reuse
Unless indicated otherwise, fulltext items are protected by copyright with all rights reserved. The copyright exception in section 29 of the Copyright, Designs and Patents Act 1988 allows the making of a single copy solely for the purpose of non-commercial research or private study within the limits of fair dealing. The publisher or other rights-holder may allow further reproduction and re-use of this version - refer to the White Rose Research Online record for this item. Where records identify the publisher as the copyright holder, users can verify any specific terms of use on the publisher’s website.
Takedown
If you consider content in White Rose Research Online to be in breach of UK law, please notify us by
Pre-failure instability of sand under dilatancy rate controlled
conditions
J. Chu
1, D. Wanatowski
2*, W.L. Loke
3and W.K. Leong
41
Professor, Iowa State University, Department of Civil, Construction & Environmental Engineering, 328 Town Engineering Building, Ames, IA 50011, US.
Email: [email protected]
2*
Associate Professor, Department of Civil Engineering, Faculty of Science and Engineering, The University of Nottingham, Ningbo, China.
Email: [email protected] (Corresponding author).
3
Project Manager/Offshore Engineer, Braemar Technical Services (Offshore) Pte Ltd, Singapore
Email: Ashley.loke@braemar
4
Senior Geotechnical Engineer, Houston, Texas, US.
Abstract: Experimental results are presented in this paper to show that a runaway type of
pre-failure instability can occur for sand under dilatancy rate controlled conditions when an appropriate
strain increment ratio, dev/de1, is imposed. This type of instability is similar to the runaway type of
instability observed for very loose sand under undrained conditions. Whether a soil element will
undergo pre-failure instability depends on the difference between the strain increment ratio of the
soil obtained from drained test, under a specified effective confining pressure, (dev/de1)s, and the
strain increment ratio imposed during the test, (dev/de1)i, rather than the absolute magnitude of
(dev/de1)s. Based on the experimental data obtained in this study it was found that an instability line
can be determined from a series of strain path tests conducted at different effective confining
pressures but with the same dev/de1 by joining the peak points of the effective stress paths to the
origin in the q-pÕ stress space. This line is similar to the instability line obtained from undrained
tests on loose sand. The instability tests under dilatancy rate controlled conditions indicate that the
stress ratio at the onset of instability obtained in the instability tests coincide with the peak stress
ratio line. This suggests that the peak stress line can be used to predict the onset of instability under
dilatancy rate controlled conditions in the same way as the use of instability line to predict the onset
of instability under undrained conditions.
INTRODUCTION
Failure of geotechnical structures can be initiated by instability of soil. The term instability
used in this paper refers to a behaviour in which large plastic strains are generated rapidly due to the
inability of a soil element to sustain a given load or stress. Instability normally takes place when the
stress state of a soil element satisfies a failure criterion, as in the conventional stability analysis.
However, instability may also occur prior to attaining the failure stress state. A typical example is
static liquefaction which occurs before the effective stress path reaches the failure line (which is
also the steady state line for loose sand). So far, this so called pre-failure instability has been
observed mainly for saturated loose sand under undrained conditions (e.g. Lade & Pradel 1990;
Lade 1993; Leong et al. 2000, Yang 2002, Wanatowski & Chu 2007, 2012, Andrade 2009).
However, the undrained condition may not be necessary. There are failure cases that occurred under
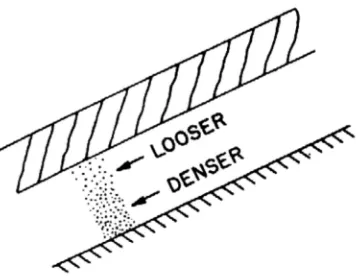
drained or other than undrained conditions (e.g. Torrey & Weaver, 1984; Eckersley, 1990; Olson et
al., 2000; Kokusho 2003; Sento et al., 2004). Failure mechanisms related to the re-distribution of
void ratio within a globally undrained sand layer (Fig. 1a) or spreading of excess pore water
pressure with global volume changes along a slope (Fig. 1b) have been suggested by the U.S.
National Research Council (NRC 1985). Adalier & Elgamal (2002) also observed from a series of
centrifuge tests that there is a potential strength loss in dense sand as a result of pore water
migration into the dense zone from the adjacent loose zone in the ground. This further indicates that
flow slides can take place under other than undrained conditions. These, other than undrained or the
so-called non-undrained conditions (Chu et al. 1992), have been simulated in the laboratory by the
use of a strain path testing method (Chu & Lo 1991), in which the strain increment ratio, dev/de1,
imposed to a specimen, is controlled. When dεv/dε1 > 0, the soil specimen compresses and when
dεv/dε1 < 0, the specimen dilates. An undrained test is only a special case when dεv/dε1 = 0. The
strain path method also provides a better simulation of the field situations, where a soil element will
method to study soil behaviour is uncommon (Topolnicki et al. 1990; Chu et al. 1992, 1993; Vaid &
Eliadorani 1998, Lancelot et al. 2004; Sivathayalan & Logeswaran 2007; Wanatowski et al. 2008,
Wanatowski and Chu 2011).
The possibility of dilating behaviour of soil masses prior to slope collapse has also been
reported in several case studies. For example, Been et al. (1987) argued that the Nerlerk berm
failure case might have occurred for dilatant sand which state lies below the steady state line.
Several other cases of flowslide in dilatant sand have been presented by Been et al. (1988). Fleming
et al. (1989) also reported that the Salmon Creek landslide in Marin Country, California, exhibited
dominantly dilative transformation from solid landslide to liquid debris flow. Although some
explanations to the causes of this and other failures have been proposed (Schofield 1980, Been et al.
1988; Hadala & Torrey 1989), the instability mechanisms of dilative sand have not been well
established. Furthermore, a method to predict such failures has not been proposed yet.
The objective of this paper is to study the pre-failure instability of sand in strain path testing
under dilatancy rate controlled conditions. The results of the strain path tests conducted on medium
loose to medium dense sand are presented. Factors affecting the occurrence of pre-failure instability
under dilatancy rate controlled conditions are analysed. The practical implications of the study are
also discussed.
MATERIAL TESTED AND TESTING PROCEDURES
A marine-dredged sand was used for this experimental study. The basic properties of the
sand are given in Table 1. All the specimens were prepared by pluviating sand into water. For
saturation, all the specimens were flushed with de-aired water from the bottom to the top for 60
minutes under a water head of about 0.5 m. After that a back pressure of 400 kPa was applied. The
SkemptonÕs pore water pressure parameter (B-value) greater than 0.96 was obtained for all the
specimens. A liquid rubber technique (Lo et al. 1989) was adopted to reduce the bedding and
All the specimens were isotropically consolidated. Shearing in all the tests was carried out
using a strain path method with dev/de1 = const (Chu & Lo 1991). In the strain path method, when
dεv/dε1 > 0, the soil element is in compression and water flows out of the specimen. When dεv/dε1 <
0, the soil element is in dilation and water flows into the specimen. An undrained test, with dεv/dε1
= 0, is only a special case of the dev/de1 = const test. Since in a strain path test the volumetric
change of the specimen is controlled, a change in pore water pressure occurs. This change in pore
water pressure leads to a change in effective confining stress.
In this study a dev/de1 = const strain path was imposed on a soil specimen by controlling the
volume change of the specimen via the Digital Pressure/Volume Controller (DPVC) in accordance
with the measured axial deformation. The DPVC was used to control the volume of water flowing
out (for contractive strain paths) or flowing into the specimen (for dilative strain paths) at a desired
volume change rate. The applied volume change could be controlled with accuracy of 0.1%
measured value with ±20mm3 backlash.
All the tests were computer controlled. The control loop consisted of the following steps:
(1) compute the axial strain from the deformation measured by the pair of internal LVDTs,
(2) compute ev and hence the volume change to be imposed by the DPVC according to the
required dev/de1,
(3) send signal to DPVC to target the required volume change,
(4) read all transducers, plot the strain path followed and the effective stress state, record
stress-strain parameters and return to step 1.
The continuous plotting of the actual strain path and the effective stress state followed at
step (4) enabled the detection of any out of control. Satisfactory control was achieved for all the
tests.
Two types of strain path tests were carried out in this study. The first type, a
deformation-controlled (DC) strain path test was carried out with either negative or positive strain increment
strain path test (so-called strain path instability test) was carried out with a negative strain increment
ratio and with the deviator (vertical) load kept constant. In both types of tests the vertical load and
deformation could be successfully controlled via a digital hydraulic force actuator mounted at the
bottom of a loading frame to apply axial load. The actuator was controlled by a computer via a
digital load/displacement control box. The control box adjusted the movement of the base pedestal
to achieve a desired rate of load or rate of displacement so that the triaxial apparatus could be used
under either deformation-controlled or load-controlled loading mode.
TESTING ARRANGEMENT
The experiments were carried out using a fully automated triaxial testing system. A digital
pressure volume controller (DPVC) with a remote feedback module was used to control the axial
load via a hydraulic actuator. Another DPVC was used to control the confining stress. A third
DPVC was used to control the back pressure via the base of the specimen and measure the volume
change at the same time. Two submersible linear variable differential transformers (LVDTs) were
attached onto the specimen for the measurement of axial strain up to approximately 4%. An external
LVDT of 50 mm travel was mounted directly on top of the triaxial chamber for the purpose of
measuring large strains. To minimise the bedding errors and achieve as uniform strain distribution
as possible during the test, free-ends with enlarged platens were used (Rowe & Barden 1964). The
pore water pressure at the top of the specimen was measured by a pressure transducer. For details of
the testing arrangement see Chu & Leong (2001).
UNDRAINED BEHAVIOUR OF LOOSE AND DENSE SAND
The stress-strain behaviour of sand under undrained conditions is void ratio dependent and
may vary from strain softening to strain hardening type. The type of behaviour obtained from an
undrained triaxial test depends on the relation between the initial void ratio of the sand tested, e0,
and strain softening behaviour of the sand under the given mean effective stress. Sometimes only a
slight change in density can convert the behaviour of soil from strain hardening to strain softening.
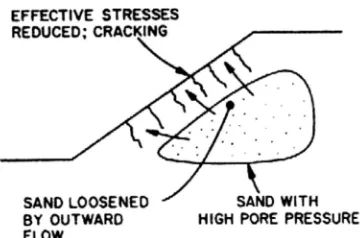
The typical stress-strain behaviour of sand in an undrained triaxial test is presented in Fig.
2(a). It can be seen that for loose sand with e0 > ecr (i.e. looser than critical void ratio) deviatoric
stress reaches its peak and then decreases to an ultimate value with increasing axial strain. This type
of behaviour is termed as the strain softening. When e0 = ecr, the deviatoric stress remains constant
after the peak is attained, as shown in Fig. 2(a). Once the void ratio of the soil, e0, is smaller than,
the critical void ratio, ecr, the strain hardening behaviour is observed. Furthermore, the smaller the
void ratio (i.e. the higher density), the stiffer stress-strain response is obtained, as shown in Fig.
2(a).
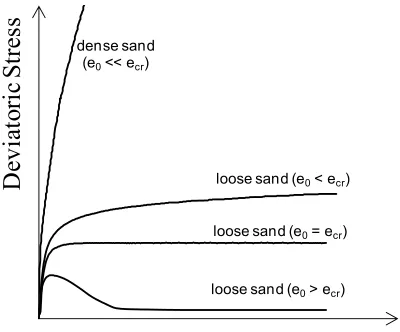
The corresponding effective stress paths of the stress-strain curves shown in Fig. 2(a) are
plotted in Fig. 2(b) together with the critical state line (CSL) and the failure line (FL) obtained from
drained triaxial tests on loose and dense sand, respectively. As shown in Fig. 2(b), in the undrained
test on loose sand with e0 > ecr the effective stress path increases gradually towards the peak state
and then traces down towards the CSL showing flow or strain softening behaviour. The effective
stress path of loose sand with e0 = ecr also increases towards the peak state but then remains
constant at the critical state line. For loose sand with e0 < ecr, the effective stress path of an
undrained test increases towards the peak and then follows the CSL.
The effective stress path obtained from an undrained test on dense sand with e0 much greater
than ecr is also shown in Fig. 2(b). It can be seen that for dense (i.e. dilative) sand, the effective
stress path of a CIU test will increase monotonically and approach a constant stress ratio line
(CSRL). In this case, the peak and the critical state cannot be determined because the specimen
exhibits strain hardening behaviour and the deviatoric stress increases with axial strain throughout
the entire undrained shearing. Such stress hardening behaviour under undrained conditions is often
INSTABILITY LINE FOR LOOSE SAND UNDER UNDRAINED
CONDITIONS
It needs to be emphasised that if an undrained test is conducted on loose sand with e0 > ecr
under a load controlled loading condition the specimen will become unstable at the peak state. This
behaviour has often been referred to as static liquefaction. However, if an undrained test is
conducted on loose sand under a deformation controlled loading condition, static liquefaction or
instability in the form of a sudden increase in axial strain rate will not occur, e.g., test on loose sand
with e0 > ecr in Fig. 2. In this case, strain softening in the form of a reduction in the deviatoric stress
occurs instead (Chu & Leong 2001; Chu & Wanatowski 2009).
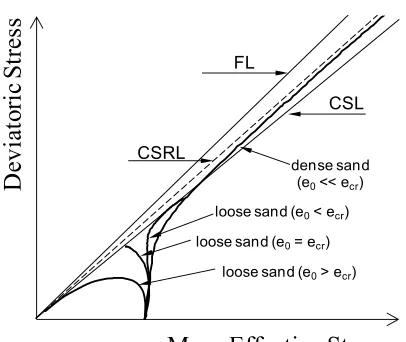
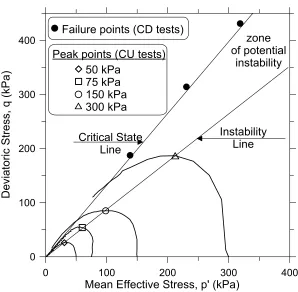
It has been established by Lade (1992) that instability occurs when the stress ratio at the
onset of instability is above the instability line, which is defined as the line connecting the top of the
effective stress paths of loose sand sheared under an undrained condition, as shown in Fig. 3. The
zone between the instability line and the critical state line is called the zone of potential instability
which specifies the instability condition for loose sand under undrained conditions (Lade 1992,
1993). Therefore, the instability line separates potentially unstable stress states from stable stress
states. Lade (1992) explained that the stress state at which instability would occur corresponds to
the top of the current yield surface which is slightly before, but very close to, the top of the
undrained effective stress path. Therefore, the instability line can be determined experimentally by a
line connecting the peak of a series of effective stress paths obtained from undrained tests. Other
definitions similar to the instability line have also been given to specify the instability condition,
such as the collapse surface by Sladen et al. (1985), the state boundary surface by Sasitharan et al.
(1993), and or the flow liquefaction line by Yang (2002). However, the differences among the
different definitions are small, as pointed out by Lade (1993) and Chu et al. (2003). The physical
meanings behind the different interpretations are also essentially the same, i.e., to specify a yielding
BEHAVIOUR OF DENSE SAND UNDER DILATANCY RATE
CONTROLLED CONDITIONS
As shown in Fig. 2 strain softening does not usually occur for dense sand under undrained
conditions. However, strain softening may occur if a dense sand specimen is sheared along a strain
path with dev/de1 < 0 (Chu et al. 1992, Chu & Leong 2001, Wanatowski et al. 2008).
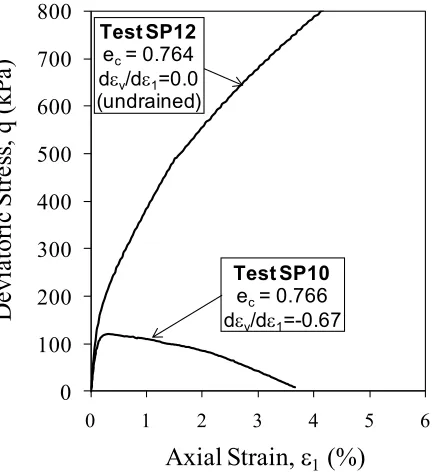
Typical behaviour of dense Changi sand under dilative strain path is presented in Fig. 4
where results of two tests SP10 and SP12 carried out with dev/de1 = -0.67 and dev/de1 = 0 (i.e
undrained test) respectively, are compared. The specimens were isotropically consolidated to the
mean effective stress pcÕ = 150 kPa. The void ratios of the specimens in Tests SP10 and SP12 were
0.766 and 0.764, respectively, which corresponds to a medium dense state.
The stress-strain curves of the two tests are shown in Fig. 4(a). It can be seen that strain
hardening behaviour was observed in undrained test SP12. However, strain softening behaviour,
similar to that of loose sand under an undrained condition, was obtained from Test SP10 with
dilative strain increment ratio dev/de1 = -0.67 imposed to the specimen.
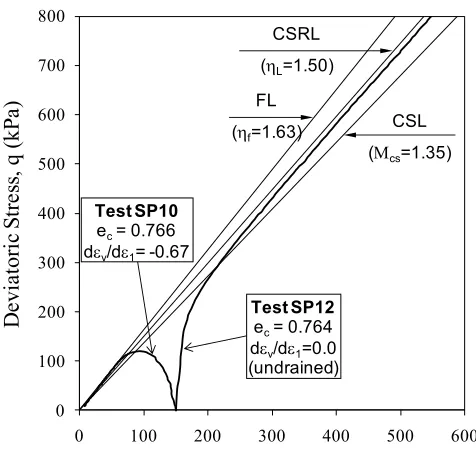
The effective stress paths obtained from the two tests are shown in Fig. 4(b). The critical
state line (CSL) and the failure line (FL) obtained from drained triaxial tests on loose and medium
dense sand, respectively together with the constant stress ratio line (CSRL) obtained from undrained
triaxial tests on medium dense sand (Chu et al. 2003) are also plotted in Fig. 4(b). It can be seen
from Fig. 4(b) that the effective stress path of Test SP10 increases until the peak state and then
reduces gradually along the failure line (FL) reaching the origin of the stress plane at the end of test.
This behaviour resembles flow behaviour of loose sand under an undrained condition. The effective
stress path of the undrained test SP12, on the other hand, increases monotonically and approach a
constant stress ratio line (CSRL). In other words, strain hardening behaviour is observed. It is
interesting to note that in the case of undrained test on medium dense sand, a peak state, the critical
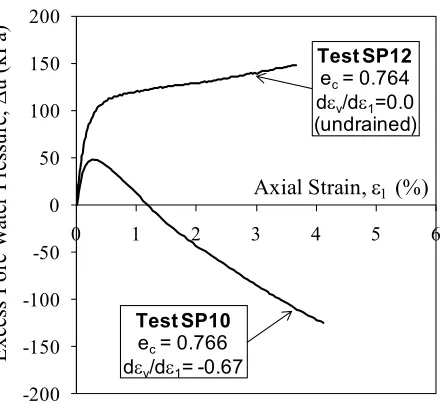
The excess pore water pressures developed in the two tests are compared in Fig. 4(c). It can
be seen that the pore water pressure in Test SP10 with dev/de1 = -0.67 imposed increased during the
entire shearing stage. However, the pore water pressure in the undrained test SP12 with dev/de1 = 0
imposed, increased initially to the peak (i.e. Dumax) and then reduced gradually until the end of the
test. As a result strain hardening was observed in Test SP12, as shown in Figs. 4(a) and (b).
It can also be noted from Fig. 4(c) that the excess pore water pressure developed in an
undrained test is not the largest, as often assumed. The pore water generation for the undrained path
is lower than that for a negative (dilative) strain path.
The tests results shown in Fig. 4 clearly demonstrate that stress-strain behaviour of granular
soil sheared from the same initial conditions (i.e. void ratio and mean effective stress) can vary from
strain softening to strain hardening. As established by Chu et al. (1992), whether a soil element will
undergo strain hardening or softening depends on the relative magnitude of the strain increment
ratio of the soil obtained from conventional drained test, (dev/de1)s and the strain increment ratio,
(dev/de1)i imposed during the test. This means that a soil specimen undergoing contractive
volumetric change can experience strain softening behaviour if the strain increment ratio imposed
during the strain path test, (dev/de1)i is smaller (i.e. less compressive) than the strain increment ratio
of the soil obtained from a conventional drained test, (dev/de1)s. The conditions for the occurrence
of strain-softening and strain-hardening as established by Chu et al. (1992) are presented in
Inequalities (1a), (1b) and (1c) below:
(dev/de1)i Ð (dev/de1)s > 0 --- hardening (1a)
(dev/de1)i Ð (dev/de1)s = 0 --- perfectly plastic (1b)
(dev/de1)i Ð (dev/de1)s < 0 --- softening (1c)
where (dev/de1)s = the strain increment ratio of the soil obtained from a conventional drained test
and (dev/de1)i = the strain increment ratio imposed during a strain path test. For more details, see
INSTABILITY LINE FOR DENSE SAND UNDER DILATANCY RATE
CONTROLLED CONDITIONS
As discussed earlier, the instability line for undrained conditions can be determined by
joining the peak points of the effective undrained stress paths of loose sand. It was also shown in
Fig. 4(b) that the effective stress path obtained from a dilative strain path test on medium dense
sand is very similar to that of undrained test on loose sand. Therefore, a similar method to that
under undrained conditions may also be used to determine a line by connecting the peak points of
the effective stress paths. In this paper, such a line determined for dense sand under
dilatancy-controlled conditions will be referred to as Ôpeak stress lineÕ.
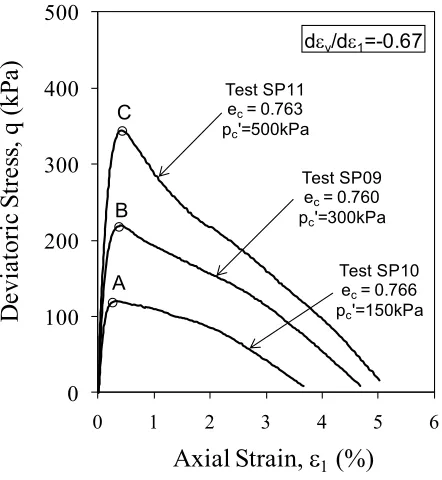
Figure 5 shows the results of three strain path tests (SP09, SP10 and SP11) of dev/de1 =
-0.67. The specimens were isotropically consolidated to mean effective stresses of 150 kPa, 300 kPa,
and 500 kPa. The void ratios, ec measured in tests SP09, SP10 and SP11 were 0.760, 0.766 and
0.763, respectively.
The stress-strain curves measured in the three tests are plotted in Fig. 5(a). It can be seen
that strain softening behaviour was obtained for all three specimens. All the stress-strain curves
reached the peak states (points A, B and C) at low level of the axial strain and then reduced
gradually to very low deviatoric stresses.
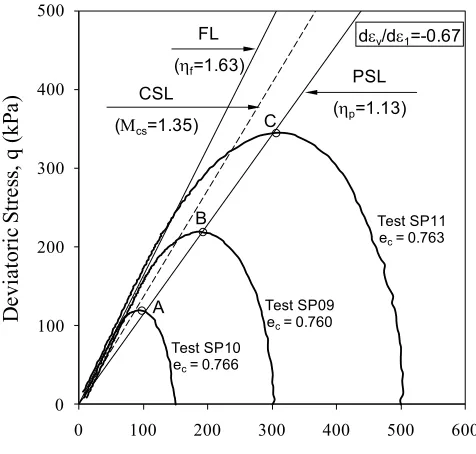
The effective stress paths of the three tests are shown in Fig. 5(b). All the paths show similar
strain softening behaviour, in which the peak stresses (A, B, and C) are initially reached and a
unique failure envelope determined by drained tests is approached. As shown in Fig. 5(b), by
joining the peak stresses A, B and C with the origin of the q-pÕ plane, a peak stress line with a slope
of hp = 1.13, can be established. From the stress-strain curves presented in Fig. 5(a), it can be seen
clearly that strain softening and large plastic yielding occurred at points A, B and C for all the three
tests. Therefore, points A, B and C define the yielding points for Tests SP09, SP10 and SP11,
The excess pore water pressures developed in the three tests are shown in Fig. 5(c). It can be
noted that pore water pressures increase gradually in all the tests, which again is similar to the
undrained behaviour of loose sand. It can also be seen from Fig. 5(c) that the excess pore water
pressure increases with the initial confining stress.
Based on the experimental data shown in Fig. 5 it can be concluded that pre-failure strain
softening can occur in a dilative strain path test in a way similar to that for loose sand under
undrained conditions. From the study of instability behaviour of granular soils under undrained
conditions, we know that the instability line is determined by joining the peak points of the
undrained stress paths, which are very close to the top of the yield surface. Thus, the peak stress line
obtained in Fig. 5(b) that specifies the yielding for tests conducted under dilatancy rate controlled
conditions could also be defined as the instability line for pre-failure instability occurring under
dilatancy-controlled conditions. The zone bounded by the peak stress line and the failure line could
then define the zone of potential instability for medium dense sand under dilatancy rate controlled
conditions.
From the experimental results presented above, it can be seen that the strain increment ratio
affects the instability behaviour of sand. This is consistent with other experimental observations
reported in the literature (Chu et al. 1993; Chu & Leong 2001; Vaid and Eliadorani 1998; Lancelot
et al. 2004; Sivathayalan and Logeswaran 2007; Wanatowski & Chu 2011). It was shown that the
more dilative the dev/de1 imposed to the specimen, the higher the tendency for instability to occur.
This is because when a dev/de1 larger than the dilatancy ratio of the soil is imposed, the pore water
pressure will increase. This in turn leads to a decrease in effective confining stress and causes
instability when the instability line is crossed. This means the location of instability line depends on
dilatancy rate imposed to the specimen and the instability zone must therefore be determined based
on the peak stress line and the failure line defined for specific dilatancy rate and void ratio. Once
on the ec versus (dev/de1)i plane can be determined (Wanatowski et al. 2008; Wanatowski and Chu
2011).
PRE-FAILURE INSTABILITY OF SAND UNDER DILATANCY RATE
CONTROLLED CONDITIONS
Several load-controlled strain path tests were carried out in this study to verify whether the
peak state line determined from dilative strain path tests under deformation-controlled loading
conditions can be used to predict the occurrence of pre-failure instability under load-controlled
loading conditions.
Firstly, an instability test IST01 was conducted on medium dense sand to verify whether
pre-failure instability can occur under load-controlled loading mode. The effective stress path
obtained from Test IST01 is plotted in Fig. 6(a). The critical state line (CSL) and the failure line
(FL) obtained from drained triaxial tests on loose and dense Changi sand are also shown in Fig.
6(a). The slopes of the CSL and the FL are Mcs = 1.35 and hf = 1.63, respectively (Chu et al. 2003;
Wanatowski and Chu 2007).
As shown in Fig. 6(a), the specimen in Test IST01 was first sheared along a drained path
from pcÕ = 150 kPa to a stress ratio of q/p' = 1.13. After that the external loads, i.e., the axial load
and the cell pressure, were maintained constant to conduct an instability check along a strain path of
dev/de1 = -0.67. Under these conditions, instability occurred at point B and the axial strain and the
pore-water pressure increased suddenly, as shown in Fig. 6(b). After occurrence of such instability,
it was no longer possible to maintain the axial load constant, and thus the deviatoric stress dropped
significantly, as can be seen in Fig. 6(a). Physically, it was observed that the specimen collapsed
suddenly, i.e., pre-failure instability had occurred. This behaviour resembles the instability that
occurs in loose sand under undrained conditions. This observation shows that dense sand, despite
exhibiting strain hardening behaviour under an undrained condition, can become as vulnerable as
It needs to be pointed out that the instability shown in Fig. 6 was not only due to the control
of a negative strain increment ratio but also due to the stress state upon the instability check, as
reported by Chu et al. (1993) and Chu & Leong (2001). Also, the observed instability was not due
to strain localization or rate/time effect, as explained by Chu et al. (1993). This type of pre-failure
instability can only occur when appropriate conditions are met (i.e. adequate strain increment ratio
and stress state).
Another instability test IST02 was carried out to further investigate the behaviour of medium
dense sand under dilatancy rate controlled conditions as well as the effect of effective stress ratio, h
= q/pÕ, on the pre-failure instability of sand. The effective stress path of Test IST02 is shown in Fig.
7(a). The effective stress path of Test IST01 (see Fig. 6a) is also replotted in Fig. 7(a) as a dashed
line. Test IST02 was conducted in a similar way to Test IST01 (see Fig. 6) except that the constant
load test with dev/de1 = -0.67 was initiated at h = 1.04 (point AÕ) in Test IST02 and h = 1.13 (point
A) in Test IST01, as shown in Fig. 7(a).
From the axial strain and pore water pressure versus time curves of Test IST02 presented in
Fig. 7(b), it can be seen that the axial strain and pore water pressure started to accelerate when the
stress state moved from point AÕ to point BÕ. Thus, instability occurred at point BÕ in Test IST02.
As can be seen from the effective stress path plotted in Fig. 7(a), the deviatoric stress in Test IST02
started to reduce significantly at point BÕ, where the instability occurred, reaching the FL at the end
of test. This decrease was accompanied by an acceleration in the axial strain of the specimen (Fig.
7b), which means large plastic strains developed at point BÕ. Thus, using the two points, B and BÕ,
at which instability occurred, the instability line for dev/de1 = -0.67 can be determined as shown in
Fig. 7(a). The slope of the instability line obtained from Tests IST01 and IST02, hIL = 1.13, is the
same as the slope of the peak stress line determined from deformation-controlled strain path tests
SP09, SP10 and SP11 with dev/de1 = -0.67, as shown in Fig. 5(b). Thus, the peak stress line
tests are equivalent and the occurrence of pre-failure instability in load-controlled strain path tests
can be predicted with the peak stress line obtained from the deformation-controlled strain path tests.
It should also be mentioned that, similar to Test IST01, after the onset of instability, the
specimen in Test IST02 has collapsed. Therefore, the instability observed in Test IST02 is a
runaway type similar to undrained instability of loose sand under undrained conditions. Once
runaway instability is initiated, the pore water pressure and the axial strain rates increase
dramatically and the soil specimen collapses almost instantly. In other words the runaway instability
cannot be ceased (Chu et al. 2003; Wanatowski & Chu 2012).
The volumetric strain and void ratio changes measured in Test IST02 are shown in Fig. 7(c).
It can be seen from the volumetric strain curve that very small dilative volumetric changes were
measured in the specimen before point BÕ. As a result, the void ratio of the specimen increased very
little during this stage of Test IST02, as shown in Fig. 7(c). Once instability occurred, significantly
more volumetric dilation was measured. This means that pre-failure instability in Test IST02 did
not occur due to change of relative density.
The comparison of the effective stress paths obtained from Tests IST01 and IST02, plotted
in Fig. 7(a) also shows that the eventual occurrence of instability was not influenced by the change
in effective stress ratio. However, an increase in the effective stress ratio reduces the time taken for
instability to occur, as the initial stress state at which constant load test was initiated moves closer to
the instability line. It should be pointed out, however, that the effective stress ratio, q/p', has to be
sufficiently high to induce instability, as discussed in detail in following section.
DISCUSSION
Although pre-failure instability does not occur for dense sand under undrained conditions,
simultaneously. This condition can be modelled experimentally by strain paths with the strain
increment ratio (dev/de1) controlled. When dev/de1 > 0 is imposed on dense sand, the pore water
pressure will decrease and instability will not occur. However, when an adequate dilative dev/de1 is
imposed, the pore water pressure will increase and instability becomes a possibility.
It needs to be pointed out that when sand of different void ratios is sheared under a drained
condition, the volumetric strain behaviour will be different. If the sand is loose, the volumetric
strain will be contractive. On the other hand, if the sand is dense, it will dilate. A drained test
defines the volumetric strain response of sand to a zero pore water pressure change condition. In
other words, in order to maintain the pore water pressure to be constant, the volume of the sand will
have to change in the way as measured in a drained test. In a drained test, loose sand needs to
contract, that is to discharge water, to maintain the pore water pressure to be constant. On the other
hand, when volume change, i.e., water discharge, is not allowed in an undrained test, the pore water
pressure will increase. As a consequence, the effective confining stress will decrease and the shear
resistance will decrease accordingly. Static liquefaction or runaway instability will occur. Similarly,
in a drained test, a dense sand needs to dilate, i.e., to absorb water, to maintain the pore water
pressure to be constant. Under an undrained condition, water is not allowed to flow into the
specimen and hence the pore water pressure inside the specimen will reduce. This is what is
observed in an undrained test on dense sand. However, if a dilatancy rate controlled condition is
imposed to force the specimen to dilate more than the sand would under a drained condition, extra
water will have to flow into the specimen to generate the required dilation. As a result, positive pore
water pressure will develop. The specimen will become unstable in a similar way as in an undrained
test on loose sand.
The occurrence of runaway instability is affected by factors such as, the drainage conditions
which can be simulated by the strain increment ratio imposed, (dev/de1)i the void ratio of soil, and
imposed during a strain path test, (dev/de1)i, and the strain increment ratio of the soil, (dev/de1)s,
measured in a drained test. Instability occurs when:
0 1 1 £ ÷÷ ø ö çç è æ -÷÷ ø ö çç è æ s v i v d d d d e e e e (2)
The strain increment ratio of the soil, (dev/de1)s, is the maximum dev/de1 ratio determined from the
ev-e1 curve of a drained test conducted under the same initial effective confining stress. For very
loose sand, (dev/de1)s is greater than or equal to zero. Instability tends to occur when (dev/de1)i = 0,
i.e., under an undrained condition. For medium loose to dense sand, (dev/de1)s is negative.
Instability is only possible when (dev/de1)i is even more negative than (dev/de1)s.
Constitutive equations can be used to predict the value of (dev/de1)s in Inequality (2). If the
modified RoweÕs stress-dilatancy theory (Rowe 1962, Wan & Guo 1998) is used for a drained test,
(dev/de1)s can be calculated as:
f s v K d d ÷÷ ø ö çç è æ -= ÷÷ ø ö çç è æ ' ' 1 1 3 1 1 s s e e (3)
where (s1'/s3')f = failure stress ratio achieved in a drained test, and K is expressed as:
* * sin 1 sin 1 f f -+ =
K with f e ecr fcr
a sin ) / ( sin *
= (4)
where f* is the friction angle mobilized along a certain macroscopic plane which evolves during
deformation history, fcr and ecr are the friction angle and void ratio at critical state, and a is a
parameter to be determined from laboratory tests (Wan & Guo 1998).
Combining Eq. (3) with Inequality (2) leads to:
f i v K d d ÷÷ ø ö çç è æ -£ ÷÷ ø ö çç è æ ' ' 1 1 3 1 1 s s e e (5)
Since (s1'/s3')f depends on the initial void ratio and to a certain extent on the effective confining
pre-As discussed earlier, the effect of stress ratio on the instability behaviour of loose sand under
undrained conditions is specified by the instability line shown in Fig. 3. Similarly, the effect of void
ratio on the instability behaviour of dense sand under dilatancy rate controlled conditions is
specified by the peak stress line, as shown in Fig. 5(b). In both cases, the stress ratio, h, has to be
sufficiently high to induce instability (Chu & Leong 2001). This can be explained by plasticity
theory. For plastic flow to develop, the yield surface has to expand, which requires the stress
increment to point outside the yield surface. A typical yield surface for sand is shown in Fig. 8. The
effective stress path involved in an instability test is characterized by dq £0 and dp'<0. In
instability tests the deviator stress q decreases because the cross-section of the specimen increases
while the deviator load is maintained constant. The effective mean stress pÕ decreases due to the
increase in pore pressure. As shown in Fig. 8, such a stress path only points outside the yield
surface when it is within the hatched zone. In terms of stress state, this hatched zone has a stress
ratio higher than the stress ratio at the peak point of the yield surface. If the stress ratio where an
instability test starts is lower than the stress ratio at the peak point, such a stress path will point
inside the yield surface, as shown in Fig. 8, and result in an elastic response. The hatched area is
characterized by a negative normal direction. Mathematically, this can be expressed as:
0 ' < 
p f
(6)
where f is the yield surface.
Inequality (6) defines the stress conditions under which instability may occur. These
conditions are approximately defined by the instability line shown in Fig. 3 and the peak stress line
shown in Fig. 5(b). Therefore, these lines are associated with the yield surface and define the
conditions in which large plastic yielding can take place (Lade 1992; Chu et al. 1993; Imam et al.
2002; Chu et al. 2003). As such, the zone of instability can be defined for specific drainage
pre-failure instability can occur under various drainage conditions as long as the stress path leads the
stress state into the zone of potential instability.
It should be pointed out that pre-failure instability investigated in this paper is defined as
behaviour in which large plastic strains are generated rapidly. For large plastic strain to develop, the
soil must be in a yielding state. Therefore, yielding is the necessary condition for instability. This
has been explained by Lade (1992) for the instability occurring for loose sand under undrained
conditions and Chu et al (2003), Wanatowski et al. (2010), and Chu et al. (2012) for the instability
occurring for both loose and dense sand under drained conditions. The Instability Line, in fact, is
defined based on the yielding conditions (Lade 1992; Chu et al. 1993, 2003). This explains why
instability can occur under undrained, drained and dilatancy controlled conditions as long as the
stress path leads the stress state into the zone of instability.
It is also important to note that although the condition given by Inequality (6) involves the
yield surface, the conditions for the occurrence of pre-failure instability can be determined without
establishing the exact yield function. When soil is sheared along a constant deviator stress path,
yielding is not precisely defined by the Instability Line obtained by the line linking the peak points
of the yield surfaces (Lade 1992, 1993; Chu et al. 2003). Nevertheless, the Instability Line defines
the lower bound of all the possible unstable conditions for undrained and drained shearing.
Similarly, the peak stress line can be used to determine all the possible unstable conditions under
generalised drainage conditions simulated in the laboratory by controlling dilatancy rate. This is
verified by the experimental data presented in this paper.
CONCLUSIONS
Several triaxial tests were carried out to study pre-failure instability of sand under dilatancy
rate controlled conditions. The following conclusions can be derived from this study:
1. Pre-failure instability does not need to occur under undrained conditions. The testing data
controlled condition, that is when the soil is dilating. Whether a soil element will undergo
instability depends on the difference between the strain increment ratio of the soil obtained
from a drained test, (dev/de1)s, and the strain increment ratio imposed during the strain path
test, (dev/de1)i, rather than the absolute magnitude of (dev/de1)s.
2. From a series of dilative strain path tests conducted at different effective confining pressures
with the same dev/de1 a peak stress line can be determined by joining the peak points of the
effective stress paths to the origin in the q-pÕ stress space. This is similar to define the
instability line from undrained tests.
3. The instability tests under dilatancy rate controlled conditions indicate that the stress ratio at
the onset of instability hIL obtained in the instability tests coincides with that of the peak
stress line hp. This means that the peak stress line can be used to predict the onset of
instability of medium loose to dense sand under dilatancy rate controlled conditions in a way
similar to the use of instability line for loose sand under undrained conditions.
4. The conditions for the occurrence of pre-failure instability are defined based on the yielding
conditions. Thus, the zone of instability can be determined regardless of the drainage
conditions. However, the occurrence of pre-failure instability can be predicted without
establishing the yield function if the method described in this paper is used.
REFERENCES
Adalier, K. & Elgamal, A.-W. (2002). Seismic response of adjacent dense and loose saturated sand
columns. Soil Dyn. Earth. Engng 22, 115-127.
Andrade, J. E. (2009). A predictive framework for liquefaction instability. GŽotechnique 59, No. 8,
Been, K., Conlin, B. H., Crooks, J. H. A., Fitzpatrick, S. W., Jefferies, M. G., Rogers, B. T. &
Shinde, S. (1987). Back analysis of the Nerlerk berm liquefaction slides: discussion. Can.
Geotech. J. 24, 170-179.
Been, K., Crooks, J. H. A., Conlin, B. H. & Horsfield, D. (1988). Liquefaction of hydraulically
placed sand fills. In Hydraulic Fill Structures, ASCE Geotechnical Special Publication 21,
(eds D. J. A. Van Zyl and S. G. Vick), pp. 573-591.
Casagrande, A. (1936). Characteristics of cohesionless soils affecting the stability of earth fills. In
Contributions to Soil Mechanics: 1925-1940. Boston Society of Civil Engineers, pp.
257-276.
Chu, J. & Leong, W. K. (2001). Pre-failure strain softening and pre-failure instability of sand: a
comparative study. GŽotechnique 51, No. 4, 311-321.
Chu, J. & Lo, S.-C. R. (1991). On the implementation of strain path testing. In Proc. 10th Eur.
Conf. Soil Mech., Florence, pp. 53-56.
Chu, J. & Wanatowski, D. (2009). Effect of loading mode on strain softening and instability
behavior of sand in plane-strain tests. J. Geotech. Geoenviron. Engng ASCE 135, No. 1,
108-120.
Chu, J., Lo, S.-C. R. & Lee, I. K. (1992). Strain-softening behaviour of a granular soil in strain-path
testing. J. Geotech. Engng ASCE 118, No. 2, 191-208
Chu, J., Lo, S.-C. R. & Lee, I. K. (1993). Instability of granular soils under strain path testing. J.
Geotech. Engng ASCE 119, No. 5, 874-892.
Chu, J., Leroueil, S. & Leong, W. K. (2003). Unstable behaviour of sand and its implication for
slope stability. Can. Geotech. J. 40, 873-885.
Chu, J., Leong, W.K., Loke, W.L. & Wanatowski, D. (2012), Instability of loose sand under drained
conditions, J. Geotech. Geoenviron. Engng ASCE 138, No. 2, 207-216.
Fleming, R. W., Ellen, S. D. & Algus, M. A. (1989). Transformation of dilative and contractive
landslide debris into debris flows - An example from Marin County, California. Engng Geol.
27, 201-223.
Hadala, P. F. & Torrey, V. H. (1989). Mississippi riverbank flowslides. In The Art and Science of
Geotechnical Engineering, Prentice-Hall Inc., Englewood Cliffs., N.J., pp. 13-30.
Imam, S. M. R., Morgenstern, N. R., Robertson, P. K. & Chan, D. H. (2002). Yielding and flow
liquefaction of loose sand. Soils Found. 42, No. 3, 19-31.
Kokusho, T. (2003). Current state of research on flow failure considering void redistribution in
liquefied deposits. Soil Dyn. Earth. Engng 23, 585-603.
Lade, P. V. (1992). Static instability and liquefaction of lose fine sandy slopes. J. Geotech. Engng
ASCE 118, No. 1, 51-72.
Lade, P. V. (1993). Initiation of static instability in the submarine Nerlerk berm. Can. Geotech. J.
30, 895-904.
Lade, P. V. & Pradel, D. (1990). Instability and plastic flow of soils. I: Experimental observations.
J. Engng Mech. 116, No. 11, 2532-2550.
Lancelot, L., Shahrour, I. & Al Mahmoud, M. (2004). Instability and static liquefaction on
proportional strain paths for sand at low stresses. J. Engng Mech. 130, No. 11, 1365-1372.
Leong, W. K., Chu, J. & Teh, C. I. (2000). Liquefaction and instability of a granular fill material.
Geotech. Test. J. ASTM 23, No. 2, 178-192.
Lo, S.-C. R., Chu, J. & Lee, I. K. (1989). A technique for reducing membrane penetration and
bedding errors. Geotech. Test. J. ASTM 12, No.4, 311-316.
National Research Council (1985). Liquefaction of soils during earthquakes. Washington, DC:
National Academy Press.
Olson, S. M., Stark, T. D., Walton, W. H. & Castro, G. (2000). 1907 static liquefaction flow failure
of the north dike of Wachusett dam. J. Geotech. Geoenviron. Engng ASCE 126, No. 12,
Rowe, P. W. (1962). The stress dilatancy relationship for static equilibrium of an assembly of
particles in contact. Proc. Royal Society A269, 500-527
Rowe, P. W. & Barden, L. (1964). Importance of free ends in triaxial testing. J. Soil Mech. Found.
Div. ASCE 90, No. 1, 1-15.
Sasitharan, S., Robertson, P. K., Sego, D. C. & Morgenstern, N. R. (1993). Collapse behavior of
sand. Can. Geotech. J. 30, No. 4, 569-577.
Schofield, A. N. (1980). Cambridge geotechnical centrifuge operations. GŽotechnique 30, No. 3,
227-268.
Sento, N., Kazama, M., Uzuoka, R., Ohmura, H. & Ishimaru, M. (2004). Possibility of
postliquefaction flow failure due to seepage. J. Geotech. Geoenviron. Engng ASCE 129, No.
8, 727-737.
Sivathayalan, S. & Logeswaran, P. (2007). Behaviour of sands under generalized drainage
conditions, Can. Geotech. J. 44, 138-150.
Sladen, J. A., DÕHollander, R. D. & Krahn, J. (1985). The liquefaction of sands, a collapse surface
approach. Can. Geotech. J. 22, 564-578.
Topolnicki, M., Gudehus, G. & Mazurkiewicz, B. K. (1990), Observed stress-strain behaviour of
remoulded saturated clay under plane-strain conditions. GŽotechnique 42, No. 2, 155-187.
Torrey, V. H. & Weaver, F. J. (1984). Flow failures in Mississippi riverbanks. In Proc. 3rd Int.
Symposium on Landslides, Toronto, 2, 335-360.
Vaid, Y. P. & Eliadorani, A. (1998): Instability and liquefaction of granular soils under undrained
and partially drained states. Can. Geotech. J. 35, 1053-1062.
Wan, R. G. & Guo, P. J. (1998). A simple constitutive model for granular soils: modified
stress-dilatancy approach. Comp. Geotech. 22, 109-133.
Wanatowski, D. & Chu, J. (2007). Static liquefaction of sand in plane-strain. Can. Geotech. J. 44,
Wanatowski, D., Chu, J., & Lo, R. S.-C. (2008), Strain softening behaviour of sand in strain path
testing under plane-strain conditions, Acta Geotech. 3, No. 2, 99-114.
Wanatowski, D., Chu, J., and Loke, W. L. (2010), Drained instability of sand in plane-strain, Can.
Geotech. J. 47, No. 4, 400-412.
Wanatowski, D., & Chu, J. (2011), Pre-failure instability behavior of sand in strain path testing
under plane-strain conditions, Soils and Foundations 51, No. 3, 423-435.
Wanatowski, D. & Chu, J. (2012). Factors affecting pre-failure instability of sand under plane-strain
conditions, GŽotechnique 62, No.2, 121-135
Yang, J. (2002). Non-uniqueness of flow liquefaction line for loose sand. GŽotechnique 52, No.10,
List of figures
Fig. 1. Failure mechanisms identified by the U.S. National Research Council: (a) Mechanism B
for the situation where void redistributes within a globally undrained sand layer; (b)
Mechanism C for the situation where failure is induced by spreading of excess pore
pressure with global volume changes.
Fig. 2. Typical behaviour of loose and dense sand under undrained conditions: (a) stress-strain
curves; (b) effective stress paths.
Fig. 3. The critical state line, the instability line and the zone of potential instability defined by
drained and undrained triaxial tests conducted on loose sand.
Fig. 4. Comparison of dilative and undrained strain paths of medium dense sand: (a) stress-strain
behaviour; (b) effective stress paths; (c) excess pore water pressure curves.
Fig. 5. Results of dev/de1 = -0.67 strain path tests: (a) stress-strain curves; (b) effective stress
paths; (c) excess pore water pressure curves.
Fig. 6. Results of Test IST01: (a) effective stress path; (b) axial strain and excess pore water
pressure versus time curves.
Fig. 7. Results of Test IST02: (a) effective stress paths; (b) axial strain and pore water pressure
versus time curves (c) volumetric strain and void ratio versus time curves.
D
e
v
ia
to
ri
c
S
tre
s
s
Axial Strain
loose sand (e0> ecr)
loose sand (e0= ecr)
loose sand (e0< ecr)
dense sand
(e0<< ecr)
[image:29.595.197.397.82.248.2]D
e
v
ia
to
ri
c
S
tre
s
s
Mean Effective Stress
CSL
CSRL
loose sand (e0< ecr)
loose sand (e0> ecr) loose sand (e0= ecr)
dense sand (e0<< ecr) FL
[image:30.595.197.400.79.250.2]0 100 200 300 400
Mean Effective Stress, p' (kPa)
0 100 200 300 400
D
e
v
ia
to
ri
c
S
tr
e
s
s
,
q
(
k
P
a
)
Instability Line Critical State
Line
zone of potential
instability Failure points (CD tests)
Peak points (CU tests) 50 kPa
[image:31.595.163.461.91.383.2]75 kPa 150 kPa 300 kPa
0 100 200 300 400 500 600 700 800
0 1 2 3 4 5 6
D
e
vi
a
tori
c
S
tre
ss
, q (kP
a
)
Axial Strain, e
1(%) Test SP10
ec= 0.766 dev/de1=-0.67 Test SP12
ec= 0.764 dev/de1=0.0
(undrained)
[image:32.595.187.404.85.321.2]0 100 200 300 400 500 600 700 800
0 100 200 300 400 500 600
D
e
vi
a
tori
c
S
tre
ss
, q (kP
a
)
Mean Effective Stress, p' (kPa)
FL
(hf=1.63)
Test SP10
ec= 0.766
dev/de1= -0.67
Test SP12
ec= 0.764 dev/de1=0.0
(undrained) CSRL
(hL=1.50)
CSL
(Mcs=1.35)
[image:33.595.174.412.77.308.2]-200 -150 -100 -50 0 50 100 150 200
0 1 2 3 4 5 6
E
x
ce
ss
P
o
re
W
at
er
P
re
ss
u
re
,
D
u
(k
P
a)
Axial Strain, e
1(%) Test SP12
ec= 0.764 dev/de1=0.0
(undrained)
Test SP10
ec= 0.766 dev/de1= -0.67
[image:34.595.189.409.87.296.2]0 100 200 300 400 500
0 1 2 3 4 5 6
D
e
vi
a
tori
c
S
tre
ss
, q (kP
a
)
Axial Strain, e
1(%)
Test SP10 ec= 0.766 pc'=150kPa dev/de1=-0.67
A B C
Test SP09 ec= 0.760 pc'=300kPa Test SP11
ec= 0.763 pc'=500kPa
[image:35.595.185.406.88.328.2]0 100 200 300 400 500
0 100 200 300 400 500 600
D
e
vi
a
tori
c
S
tre
ss
, q (kP
a
)
Mean Effective Stress, p' (kPa) FL
(hf=1.63)
PSL
(hp=1.13)
CSL
(Mcs=1.35)
A B
C
Test SP11 ec= 0.763
Test SP09 ec= 0.760
Test SP10 ec= 0.766
dev/de1=-0.67
[image:36.595.174.412.85.312.2]0 100 200 300 400 500 600
0 1 2 3 4 5 6
E x ce ss P o re W at er P re ss u re , D u (k P a)
Axial Strain, e
1(%) Test SP11
ec= 0.763
pc'=500kPa
Test SP09 ec= 0.760
pc'=300kPa
Test SP10 ec= 0.766
pc'=150kPa dev/de1=-0.67
A B
C
[image:37.595.182.413.83.319.2]0 100 200 300
0 100 200 300
D
ev
ia
to
ri
c
S
tre
ss
,
q
(k
P
a)
Mean Effective Stress, p' (kPa)
CSL
Mcs=1.35
A, B
q/p'=1.13 IST01(ec= 0.759)
A: Start of instability test
(dev/de1= -0.67)
B: Onset of instability
FL
hf=1.63
[image:38.595.177.412.69.290.2]-100 0 100 200 0 2 4 6
0 20 40
P o re w at er p re ss u re (k P a) A x ia l S tra in , e1 (% ) Time (min) axial strain
pore water pressure
IST01(ec= 0.759) A: Start of instability test
(dev/de
1= -0.67) B: onset of instability
A B
A
B
0 100 200 300 400
0 100 200 300
D
ev
ia
to
ri
c
S
tre
ss
,
q
(k
P
a)
Mean Effective Stress, p' (kPa)
IST01 (0.759) IST02 (0.761)
CSL (Mcs=1.35)
h=1.13
IL (hIL=1.13)
FL (hf=1.63)
A=B
A' (h=1.04)
B'
[image:40.595.175.410.69.292.2]-100 -50 0 50 100 150 200 250 300 350 0 1 2 3 4 5 6
0 5 10 15 20 25 30
P o re w at er p re ss u re (k P a) A x ia l S tra in , e1 (% ) Time (min) axial strain pore water pressure
IST02(ec= 0.761) A': Start of instability test
(dev/de
1= -0.67)
B': onset of instability
A' B' A'
B'
[image:41.595.170.412.93.312.2]0.72 0.73 0.74 0.75 0.76 0.77 0.78 0.79 0.80 0.81 0.82 -1.0 0.0 1.0 2.0 3.0 4.0
0 5 10 15 20 25 30
V o id Ra ti o V o lu m et ri c S tra in, e! (%) Time (min) volumetric strain void ratio
IST02(ec= 0.761) A': Start of instability test
(de
v/de1= -0.67)
B': onset of instability
A' B' A'
B'
[image:42.595.170.413.83.278.2]Yield surface Stress increment direction
pÕ = (s1Õ + 2s3Õ) / 3
q
=
s1
[image:43.595.135.463.80.221.2]
-s3
Table 1. Basic properties of the tested sand.
Mean grain size (mm)
Uniformity coefficient
Specific gravity
Max. void ratio
Min. void ratio
Shell content (%)