binary CSS 41177
.
White Rose Research Online URL for this paper:
http://eprints.whiterose.ac.uk/108495/
Version: Accepted Version
Article:
Bours, M.C.P., Marsh, T.R., Parsons, S.G. et al. (6 more authors) (2014) Precise
parameters for both white dwarfs in the eclipsing binary CSS 41177. Monthly Notices of
the Royal Astronomical Society, 438 (4). pp. 3399-3408. ISSN 0035-8711
https://doi.org/10.1093/mnras/stt2453
This is a pre-copyedited, author-produced PDF of an article accepted for publication in
Monthly Notices of the Royal Astronomical Society following peer review. The version of
record MNRAS (March 11, 2014) 438 (4): 3399-3408 is available online at:
https://doi.org/10.1093/mnras/stt2453.
[email protected]
https://eprints.whiterose.ac.uk/
Reuse
Unless indicated otherwise, fulltext items are protected by copyright with all rights reserved. The copyright
exception in section 29 of the Copyright, Designs and Patents Act 1988 allows the making of a single copy
solely for the purpose of non-commercial research or private study within the limits of fair dealing. The
publisher or other rights-holder may allow further reproduction and re-use of this version - refer to the White
Rose Research Online record for this item. Where records identify the publisher as the copyright holder,
users can verify any specific terms of use on the publisher’s website.
Takedown
If you consider content in White Rose Research Online to be in breach of UK law, please notify us by
arXiv:1401.1503v1 [astro-ph.SR] 7 Jan 2014
Precise parameters for both white dwarfs in the eclipsing
binary CSS 41177
M.C.P. Bours
1⋆, T.R. Marsh
1, S.G. Parsons
2, C.M. Copperwheat
3, V.S. Dhillon
4,
S.P. Littlefair
4, B.T. Gänsicke
1, A. Gianninas
5, P.-E. Tremblay
6.
1Department of Physics, Gibbit Hill Road, University of Warwick, Coventry CV4 7AL, UK
2Departmento de Físico y Astronomía, Universidad de Valparaíso, Avenida Gran Bretana 1111, Valparaíso, Chile 3Astrophysics Research Institute, Liverpool John Moores University, Twelve Quays House, Birkenhead, CH41 1LD, UK 4Department of Physics and Astronomy, University of Sheffield, Sheffield, S3 7RH, UK
5Homer L. Dodge Department of Physics and Astronomy, University of Oklahoma, 440 W. Brooks St., Norman, OK 73019, USA 6Space Telescope Science Institute, 700 San Martin Drive, Baltimore, MD, 21218, USA
Accepted XX XXXX – Received XX XXXX
ABSTRACT
We present ULTRACAM photometry and X-Shooter spectroscopy of the eclipsing double white dwarf binary CSS 41177, the only such system that is also a double-lined spectroscopic binary. Combined modelling of the light curves and radial velocities yield masses and radii for both white dwarfs without the need to assume mass-radius
relations. We find that the primary white dwarf has a mass of M1 = 0.38 ± 0.02
M⊙ and a radius ofR1= 0.0222±0.0004 R⊙. The secondary white dwarf’s mass and
radius areM2= 0.32±0.01 M⊙ andR2= 0.0207±0.0004 R⊙, and its temperature
and surface gravity (T2 = 11678±313 K, log(g2) = 7.32±0.02) put it close to the white dwarf instability strip. However, we find no evidence for pulsations to roughly 0.5% relative amplitude. Both masses and radii are consistent with helium white dwarf models with thin hydrogen envelopes of610−4 M
∗. The two stars will merge in 1.14
±0.07 Gyr due to angular momentum loss via gravitational wave emission.
Key words: stars: individual: SDSS J100559.10+224932.3 – white dwarfs – binaries: eclipsing – techniques: radial velocities – methods: statistical
1 INTRODUCTION
More than 95% of all stars end their lives as white dwarfs. These most common remnants of stellar evolution trace the initial stellar distribution and contain a history of the evo-lution of their progenitor stars, through the strong corre-lation between the progenitor star’s initial mass and the white dwarf’s final mass (Weidemann 2000). As even the oldest white dwarfs have not had enough time to cool below detectability, they provide useful and independent age estimates when found in, for example, the Galactic disc (Wood 1992), as well as providing distance estimates to globular clusters (Renzini et al. 1996). White dwarfs also feature as the most likely candidates for supernova Type Ia progenitors (Nomoto 1982; Iben & Tutukov 1984; Whelan & Iben 1973), in accreting binaries such as cata-clysmic variables, and are potential progenitors of single hot sdB/sdO stars and extreme helium stars (Webbink 1984), AM CVn binaries (Breedt et al. 2012) and supernovae Type .Ia (Bildsten et al. 2007).
Despite the abundance and importance of white dwarfs, it has proved difficult to measure fundamental parameters such as mass and radius directly, without the use of theo-retical mass-radius relations. This leaves the empirical ba-sis for this relation relatively uncertain (Schmidt 1996). For single white dwarfs, spectral fitting can be used to obtain the temperature and surface gravity, after which both mass and radius can be inferred, but only when combined with a mass-radius relation (see for example Provencal et al. 2002). White dwarfs in visual binaries, common proper motion pairs, or in open clusters allow one to determine parameters without the use of this relation, therefore providing a direct test of it. These methods rely on accurate parallax measure-ments, spectral fitting and/or radial velocity measurements (Holberg et al. 2012; Provencal et al. 2002; Casewell et al. 2009). The number of stars to which these methods can be applied is limited, and with the exception of Sirius B
(Barstow et al. 2005), they cluster around a mass of MWD∼
0.6 M⊙, making it difficult to test the full range of the mass-radius relation.
types of binaries also include white dwarfs across a wide range of masses (Pyrzas et al. 2012; O’Brien et al. 2001; Parsons et al. 2012c, this paper). For these systems, masses can be determined from orbital velocities and radii from light curve analysis (Parsons et al. 2012a,b). Due to their eclipsing nature, the inclination of the system is strongly constrained, allowing for direct mass determinations as op-posed to lower limits.
The number of known short-period, eclipsing, white dwarf binaries has grown substantially within the last decade, mainly due to large all-sky surveys such as the Sloan Digital Sky Survey (SDSS, York et al. 2000) and the Catalina Sky Survey (CSS, Drake et al. 2009). The latter and other survey work also led to the discovery of the first five eclipsing binaries in which both stars are white dwarfs: NLTT 11748 (Steinfadt et al. 2010), CSS 41177 (Parsons et al. 2011), GALEX J171708.5+675712 (Vennes et al. 2011), SDSS J065133.33+284423.37 (Brown et al. 2011) and SDSS J075141.18-014120.9 (Kilic et al. 2013).
These binaries provide us with an opportunity for pre-cise and independent mass and radius measurements for two white dwarfs from one system. The double white dwarf bi-nary that is the subject of this paper, CSS 41177 (SDSS J100559.10+224932.2), is the only one of the five that is also a double-lined spectroscopic binary, allowing direct measure-ment of the stars’ orbital velocities (Parsons et al. 2011) and therefore their masses without needing to assume a mass-radius relation.
CSS 41177 was initially discovered to be an eclipsing binary by Drake et al. (2010), who constrained it to be a white dwarf with a small M-dwarf companion, although they noted that a small faint object could produce a signal sim-ilar to what they observed. Parsons et al. (2011) obtained Liverpool Telescope + RISE fast photometry and Gemini + GMOS spectroscopy, which allowed them to determine that there were in fact two white dwarfs and to carry out an initial parameter study. In this paper we present higher signal-to-noise data in order to determine the system parameters more precisely and independent of any mass-radius relationships.
2 DATA
2.1 Photometry: ULTRACAM
The photometric data were taken with ULTRACAM (Dhillon et al. 2007), a visitor instrument that was mounted on the 4.2m William Herschel Telescope (WHT) on the is-land of La Palma, Spain and on the 3.5m New Technology Telescope (NTT) at the La Silla Observatory, Chile. UL-TRACAM is a high-speed camera that images ultraviolet, visual and red wavelengths simultaneously with three
frame-transfer CCDs with∼25 ms dead time between exposures.
Filters identical to the SDSS u′, g′ and r′ filters were used
and we windowed the CCD which allowed us to reach ex-posure times as short as 1.5 seconds in the slow readout speed. We observed eleven primary eclipses of CSS 41177 and nine secondary eclipses in January 2012 with ULTRACAM mounted on the WHT, including one observation spanning a complete orbit (1.1 cycles). We also observed one primary eclipse in May 2011 with ULTRACAM on the NTT. We
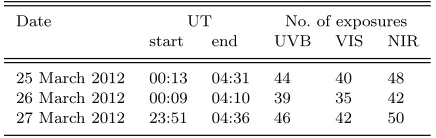
re-Table 1.Log of the X-shooter observations. On all three nights
the conditions were clear, with seeing between 0.5′′and 1.0′′.
Date UT No. of exposures start end UVB VIS NIR
25 March 2012 00:13 04:31 44 40 48 26 March 2012 00:09 04:10 39 35 42 27 March 2012 23:51 04:36 46 42 50
fer to a primary eclipse when the hotter, more massive white dwarf is being eclipsed.
The ULTRACAM pipeline (Dhillon et al. 2007) was used to debias and flatfield the data. The source flux was de-termined with relative aperture photometry, using a nearby star as a comparison. We used a variable aperture, where the radius of the aperture was scaled according to the full width at half maximum of the stellar profile. The profiles were fit with Moffat profiles (Moffat 1969).
The ULTRACAM data has absolute timestamps bet-ter than 0.001 seconds. We converted all times onto a TDB timescale, thereby correcting for the Earth’s motion around the Solar System barycentre. A code based on SLALIB was used for these corrections, which has been found to be ac-curate at a level of 50 microseconds compared to TEMPO2 (a pulsar timing package, see Hobbs et al. 2006). Compared to the statistical uncertainties of our observations, this is insignificant.
2.2 Spectroscopy: X-Shooter
We obtained spectra with the X-Shooter spectrograph (Vernet et al. 2011) on the Very Large Telescope (VLT) UT2 (Kueyen) on the nights of the 25th, 26th and 27th of March 2012, obtaining a total of 117 spectra covering 1.5, 1.4 and 1.7 orbital cycles in the three nights. A log of the observa-tions is given in Table 1.
The X-shooter spectrograph consists of three indepen-dent arms (UVB, VIS and NIR), giving a simultaneous wave-length coverage from 3000 to 24800Å. We obtained a series of spectra 310, 334 and 300 seconds in length for the UVB, VIS and NIR arms respectively. Spectra were obtained consecu-tively with occasional short breaks of a few minutes in order to check the position of the target on the slit. We binned by a factor of two both spatially and in the dispersion
direc-tion in the UVB and VIS arms, and used slit widths of 0.8′′,
0.9′′
and 0.9′′
for the UVB, VIS and NIR arms respectively.
The NIR arm slit includes aK-band blocking filter which
reduces the thermal background in theJ- andH-bands.
[image:3.612.316.534.119.188.2]2.3 Photometry: RISE on the LT
In order to monitor any long-term orbital period vari-ations we also regularly observed primary eclipses of CSS 41177 with the fully-robotic 2.0m Liverpool Telescope (LT; Steele et al. 2004) and RISE camera. RISE contains a frame transfer CCD, with a single ‘V+R’ filter. We ob-served a total of 10 primary eclipses from February 2011 until March 2013.
The data were flatfielded and debiased in the automatic pipeline, in which a scaled dark-frame was removed as well. Aperture photometry was performed using the ULTRACAM pipeline in the same manner as outlined in Sect. 2.1. We con-verted the resulting mid-eclipse times to the TDB timescale. LT/RISE has absolute timestamps better than 0.1 second (D. Pollacco, private communication).
3 DATA ANALYSIS & RESULTS
3.1 Radial velocity amplitudes
We analysed the reduced spectroscopic data using the
MOLLY software1, and used observations of the standard
star to normalise the continuum and reduce telluric absorp-tion features present in the CSS 41177 science spectra as far as possible.
To measure the radial velocity amplitudesK1 and K2
we fitted the Hαline with multiple Gaussian profiles
com-bined with a straight line fit to the local continuum using Marquardt’s method of minimisation. Each Gaussian pro-file was represented by two free parameters, the full width
at half maximum and the height. The radial velocityvr was
calculated using
vr=γ+K1,2sin(2πφ), (1)
whereγ accounts for a systemic radial velocity,K1 andK2
are the radial velocity amplitudes of the two white dwarfs
andφis the orbital phase. Our best fit gaveK1=−176.1±
1.1km s−1 andK
2 = 210.4±6.1 km s−1 for the primary
and secondary white dwarfs, and γ = 130.5±0.7 km s−1
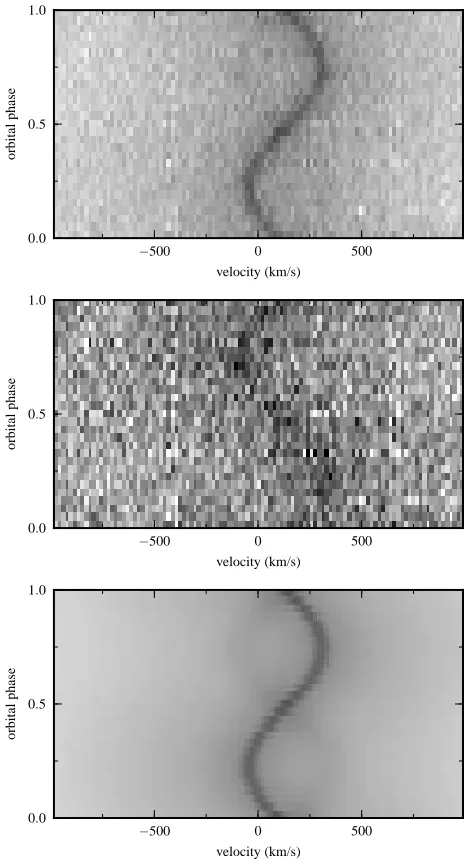
for the offset. The phase-folded trail of the Hαline is shown
in the top panel in Fig. 1. From this best model we set the Gaussian profiles corresponding to the secondary star’s line to zero, leaving a model of only the primary star’s line. We then subtracted the model from the original spectra to bring out the secondary’s contribution, shown in the middle panel of Fig. 1. The systemic radial velocity is clearly visible in both of these figures as the offset from zero. The bottom
panel shows both the primary and secondary model Hαline.
Both radial velocity amplitudes are in agreement with the measurements in Parsons et al. (2011), but have uncer-tainties reduced by a factor of 3 and 2 respectively.
3.2 Light curve analysis
In order to determine the eclipse times of all primary eclipses we created a model that reproduced the shape of the eclipses and then varied the mid-eclipse time and an overall scaling
1 MOLLY was written by T. R. Marsh and is available from
http://www.warwick.ac.uk/go/trmarsh/software.
−500 0 500
velocity (km/s) 0.0
0.5 1.0
o
rb
it
al
p
h
as
e
−500 0 500
velocity (km/s) 0.0
0.5 1.0
o
rb
it
al
p
h
as
e
−500 0 500
velocity (km/s) 0.0
0.5 1.0
o
rb
it
al
p
h
as
[image:4.612.314.547.88.519.2]e
Figure 1.X-Shooter spectroscopy of CSS 41177. Top: spectra of the Hα absorption line at 6562.76Å, folded with the orbital period. The scale is such that black equals 20% of the continuum and white 100%.Middle: phase-folded spectra after subtraction of the primary white dwarf’s Hα absorption line, showing the contribution of the secondary white dwarf. Here black equals -18% of the continuum and white 5%.Bottom:phase-folded model. Black equals 20% of the continuum and white 100%.
factor to minimise the value of χ2. All our primary
mid-eclipse times are listed in Table 3.
We modelled the white dwarfs as spheres using a pro-gram that subdivides the visible face of each into 200 con-centric annuli. Each annulus contributes an amount to the total stellar flux, which depends upon the limb darkening. The next section gives more details on how we included limb darkening. We accounted for Doppler beaming from the white dwarfs by following Bloemen et al. (2011), and modified the flux by a factor
1−B vr
Table 2.Properties of CSS 41177. The J2000 coordinates and the
magnitudes are taken from SDSS III DR9, where the magnitudes are the photometric PSF magnitudes.
property value
R.A. 10:05:59.1 Dec. +22:49:32.26 mu 17.32±0.02
mg 17.29±0.02
mr 17.62±0.02
withB the spectrum-dependent beaming factor andvr the
radial velocity of the star. To calculate the beaming fac-tors, we used white dwarf model spectra (Koester 2010) with
log(g) = 7.25 for both white dwarfs, and T = 24000K and T
= 12000K for the primary and secondary respectively. These values were chosen after an initial fit as described in this section. With these models, and following Bloemen et al.
(2011), the bandpass-integrated beaming factors for the (u′,
g′, r′) filters are (1.9, 2.2, 1.3) for the primary white dwarf
and (3.4, 3.5, 1.8) for the secondary white dwarf. We did not include gravitational lensing in our models. Due to the sim-ilarity of the white dwarfs’ masses and radii, and their rela-tively small separation, the lensing amplification factor near
both primary and secondary eclipses is∼1.00003, making
this effect negligible (for the relevant equations, see Marsh 2001).
We then normalised each observed light curve individ-ually to reduce any night-to-night variations and used the SDSS magnitudes for CSS 41177 (see Table 2) to determine the binary’s overall out-of-eclipse flux level. We allowed for
an additional shiftδ, of the secondary eclipse, on top of the
0.5 phase difference with respect to the primary eclipse, by
adjusting the phaseφaccording to
φ=φ+ δ
2P(cos(2πφ)−1), (3)
whereP is the orbital period. This shift near the secondary
eclipse allows for possible Rømer delays2 (Kaplan 2010)
and/or a small eccentricity of the orbit.
Our program fits all individual eclipses simultaneously using a Markov chain Monte Carlo (MCMC) method to explore the ten-dimensional parameter space, favouring
re-gions with small χ2 values of the model with respect to
the data. The free parameters in the model were the two
radii scaled by the binary separation,R1/a andR2/a, the
white dwarf temperatures, T1 and T2, the radial velocity
amplitudes,K1andK2, the inclination of the binaryi, the
time delayδ, the orbital periodP and the zero point of the
ephemeris,T0, which was chosen to minimise the correlation
with the orbital period.
Because we have accurate measurements for the radial velocity amplitudes from the analysis of the spectroscopic data we used a prior to constrain them while modelling the
2 Named after the Danish astronomer O. Rømer, who was the
first to realise that the speed of light is finite by observing devia-tions from strict periodicity for eclipses of Io, a satellite of Jupiter (Sterken 2005).
−0.01 0.00 0.01
0.0
0.2
0.4
0.6
0.8
1.0
1.2
1.4
n
o
rm
al
is
ed
fl
u
x
le
v
el
+
o
ff
se
t
primary eclipse primary eclipse primary eclipse
0.49 0.50 0.51
0.0
0.2
0.4
0.6
0.8
1.0
1.2
1.4
secondary eclipse secondary eclipse secondary eclipse
orbital phase u’ band
g’ band
[image:5.612.109.213.128.209.2]r’ band
Figure 2. ULTRACAM u′ (top), g′ (middle) and r′ (bottom)
data, folded with the binary’s orbital period, normalised and binned using a binwidth of 0.0002. The u′ and r′ data are
off-set by +0.3 and -0.3 respectively, and the g′ data are not offset.
The black lines show the best model.Left hand side: a total of twelve observed eclipses of the primary, hotter white dwarf.Right hand side:nine eclipses of the secondary, cooler white dwarf.
photometric data. Given the ten free parameters and com-bining them with
K1+K2=
2πa
P sin(i), (4)
and Kepler’s equation given by
G(M1+M2)
a3 =
4π2
P2, (5)
the binary’s orbital separation a and the white dwarf
masses M1 and M2 could also be calculated. Note that
q = K1/K2 = M2/M1 and that the surface gravities
follow fromg1,2 = GM1,2/R21,2.
As a reference our best model is shown in Fig. 2, on top of the phase-folded and binned data. This model has the lowest squared value, corresponding to a reduced
chi-squared of χ2
ν = 1.03 (43351 data points, 10 free
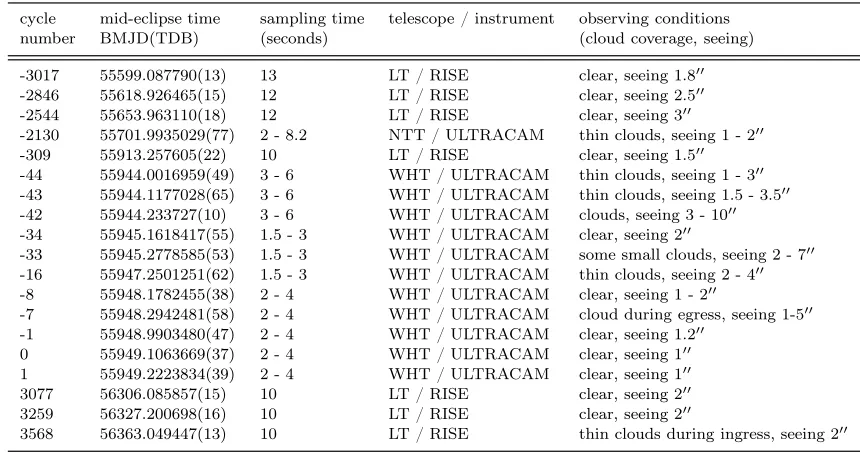
Table 3.Mid-eclipse times for the primary eclipses of CSS 41177. All ULTRACAM times shown are the weighted averages of the u′,
g′ and r′ mid-eclipse times.
cycle mid-eclipse time sampling time telescope / instrument observing conditions number BMJD(TDB) (seconds) (cloud coverage, seeing)
-3017 55599.087790(13) 13 LT / RISE clear, seeing 1.8′′
-2846 55618.926465(15) 12 LT / RISE clear, seeing 2.5′′
-2544 55653.963110(18) 12 LT / RISE clear, seeing 3′′
-2130 55701.9935029(77) 2 - 8.2 NTT / ULTRACAM thin clouds, seeing 1 - 2′′
-309 55913.257605(22) 10 LT / RISE clear, seeing 1.5′′
-44 55944.0016959(49) 3 - 6 WHT / ULTRACAM thin clouds, seeing 1 - 3′′
-43 55944.1177028(65) 3 - 6 WHT / ULTRACAM thin clouds, seeing 1.5 - 3.5′′
-42 55944.233727(10) 3 - 6 WHT / ULTRACAM clouds, seeing 3 - 10′′
-34 55945.1618417(55) 1.5 - 3 WHT / ULTRACAM clear, seeing 2′′
-33 55945.2778585(53) 1.5 - 3 WHT / ULTRACAM some small clouds, seeing 2 - 7′′
-16 55947.2501251(62) 1.5 - 3 WHT / ULTRACAM thin clouds, seeing 2 - 4′′
-8 55948.1782455(38) 2 - 4 WHT / ULTRACAM clear, seeing 1 - 2′′
-7 55948.2942481(58) 2 - 4 WHT / ULTRACAM cloud during egress, seeing 1-5′′
-1 55948.9903480(47) 2 - 4 WHT / ULTRACAM clear, seeing 1.2′′
0 55949.1063669(37) 2 - 4 WHT / ULTRACAM clear, seeing 1′′
1 55949.2223834(39) 2 - 4 WHT / ULTRACAM clear, seeing 1′′
3077 56306.085857(15) 10 LT / RISE clear, seeing 2′′
3259 56327.200698(16) 10 LT / RISE clear, seeing 2′′
3568 56363.049447(13) 10 LT / RISE thin clouds during ingress, seeing 2′′
Our final ephemeris is given by
BMJD(TDB) = 55936.3446719(6) + 0.1160154352(15)E,(6)
withE the cycle number. The parameters are summarised
in Table 4 (columns 2 and 3), which lists both the mean and rms for each parameter.
3.3 Limb darkening
To account for limb darkening of the white dwarfs we used the limb darkening law as first described by Claret (2000), in which the specific intensity across the stellar disc can be calculated using
I(µ)
I(1) = 1−c1(1−µ
1/2
)−c2(1−µ)−c3(1−µ3/2)−c4(1−µ2),(7)
where c1 -c4 are the limb darkening coefficients, and µ is
the cosine of the angle between the line of sight and the
surface normal of the white dwarf, so thatI(1)is the specific
intensity at the centre of the white dwarf’s disc.
The limb darkening coefficients were recently calcu-lated for a wide range of white dwarf temperatures and
surface gravities, for both the Johnson-Kron-Cousins
UB-VRI system and theugrizy filters to be used by the LSST
(Gianninas et al. 2013). The filter profiles of the
ULTRA-CAM u′, g′ and r′ filters are similar to those of the LSST
and therefore we used the coefficients calculated for these LSST filters. We also computed the central specific intensi-ties for these three filters.
For a given temperature and surface gravity we used a bilinear interpolation between the closest values to calculate all four coefficients and the central specific intensity. These then allowed us to determine the total specific intensity of the white dwarfs, depending on where they are in their orbit and on the fraction of each annulus visible. The total specific
intensity3 is related to the binary’s flux4 by a constant,α,
which we calculated during the MCMC by minimising the difference between the flux defined by the SDSS magnitudes for CSS 41177 and the product of the total specific intensity
withα. The constant is related to the solid angle the binary
subtends as
α=a2/D2, (8)
whereais the binary’s orbital separation andD is the
dis-tance to the binary, allowing us to effectively measure the distance from our light curves. For our three filters the
re-sulting distances areDu= 481±37pc,Dg = 473±35pc, and
Dr = 464±34pc. These give an inverse variance weighted
value ofD= 473±35pc, with the quoted error similar to
those for the individual distances. We believe these errors to be dominated by the uncertainties in the SDSS magni-tudes, which is why a weighted error would overestimate the precision with which we can determine the distance. These values are significantly higher than the distance quoted in Parsons et al. (2011), a natural result due to the fact that we also obtained higher temperatures for both white dwarfs. The calculations in Gianninas et al. (2013) are based on 1D white dwarf models. Tremblay et al. (2013) have re-cently shown that the standard 1D mixing-length theory overpredicts surface gravities and, to a lesser extent, tem-peratures, especially near the values we found for the cooler white dwarf. To assess the effect of using 1D models we com-pared a 1D and an averaged 3D intensity profile, using a temperature and surface gravity representative of the cooler white dwarf. Full 3D and averaged 3D spectral synthesis pro-duce very similar results at all wavelengths (Tremblay et al. 2011), and so the averaged 3D approximation, where the
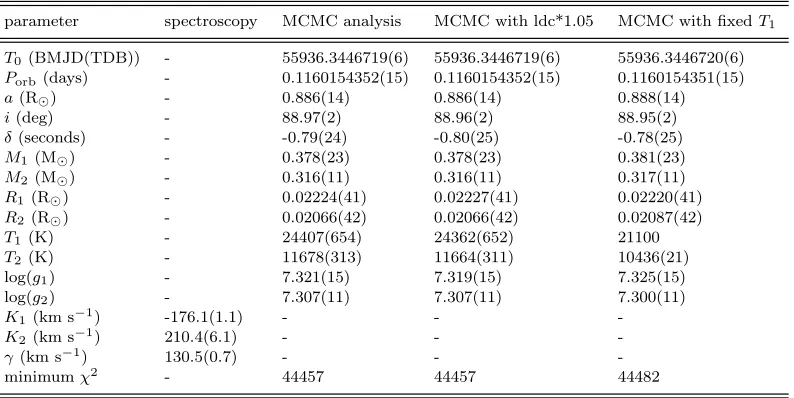
Table 4.Parameters of the binary and both white dwarfs, where the numbers in parentheses indicate the uncertainty in the last digit(s).
The second and third column list the results from the analysis of the spectroscopic and photometric data (see Sect. 3). The last two columns shows the results from two more MCMC analyses, where the limb darkening coefficients (ldc) have been multiplied by 1.05 (fourth column) and whereT1has been fixed (fifth column).
parameter spectroscopy MCMC analysis MCMC with ldc*1.05 MCMC with fixedT1
T0 (BMJD(TDB)) - 55936.3446719(6) 55936.3446719(6) 55936.3446720(6)
Porb(days) - 0.1160154352(15) 0.1160154352(15) 0.1160154351(15)
a(R⊙) - 0.886(14) 0.886(14) 0.888(14)
i(deg) - 88.97(2) 88.96(2) 88.95(2)
δ(seconds) - -0.79(24) -0.80(25) -0.78(25) M1 (M⊙) - 0.378(23) 0.378(23) 0.381(23)
M2 (M⊙) - 0.316(11) 0.316(11) 0.317(11)
R1(R⊙) - 0.02224(41) 0.02227(41) 0.02220(41)
R2(R⊙) - 0.02066(42) 0.02066(42) 0.02087(42)
T1 (K) - 24407(654) 24362(652) 21100
T2 (K) - 11678(313) 11664(311) 10436(21)
log(g1) - 7.321(15) 7.319(15) 7.325(15)
log(g2) - 7.307(11) 7.307(11) 7.300(11)
K1(km s−1) -176.1(1.1) - -
-K2(km s−1) 210.4(6.1) - -
-γ(km s−1) 130.5(0.7) - -
-minimumχ2 - 44457 44457 44482
average is performed over constant Rosseland optical depth, is likely to be appropriate for the present study. We found the difference between the two profiles is a factor of 1.05 in the limb darkening coefficients. Running a separate MCMC analysis in which we multiplied each limb darkening coeffi-cient by 1.05, showed that the effect on our values for the parameters is much less than the statistical uncertainty in the parameters (Table 4, column 4).
4 DISCUSSION
4.1 Details of the binary orbit
For an eclipsing binary on a circular orbit it is often assumed that the primary and secondary eclipses occur exactly half an orbital cycle after one another. However, this is not the case if the two binary components are of unequal mass. The changing distance to the stars at times of eclipses and the fi-nite speed of light cause a shift in the phase of the secondary eclipse. While modelling our light curve we allowed for such a time shift, and found an indication of a small displacement
ofδ= -0.79±0.24 seconds. For CSS 41177 we theoretically
expect the Rømer delay to beδR=P(K2−K1)/πc= 0.36
±0.08 seconds (Kaplan 2010), so that the secondary eclipse
occurs slightly after phase 0.5. The fact that we measure a delay with the opposite sign to that expected, and that our
measurement is 4.6σ away from the theoretical prediction
indicates that there may be another process at work. The measured time delay could be the result of a small eccentricity of the binary’s orbit, in which case we can use the measured time delay to constrain the eccentricity. With
δe = 2P ecos(ω)/π (Kaplan 2010; Winn 2010), where ω is
the argument of pericenter, we obtain an eccentricity of
ecos(ω) = −(1.24±0.38)×10−4, which is a lower limit
on the eccentricity. Although not extremely significant, it is certainly possible that the binary did not emerge from the
last common envelope phase on a completely circular or-bit, or that small perturbations have been induced into the binary’s orbit by a third body.
We tried to confirm the measurement of a small eccen-tricity by fitting the primary white dwarf’s radial velocity curve. The result is consistent with an eccentricity of zero,
with a 3σupper limit at 0.034. However, this limit is weak
compared to the value ofecos(ω), which is more than 100x
smaller.
The only other precise eccentricity measurement in an eclipsing double white dwarf binary (NLTT 11748) is con-sistent with a circular orbit, and the measured Rømer delay for this system agrees with the expected value (Kaplan et al. 2013).
If the CSS 41177 binary orbit is indeed eccentric, apsidal precession will occur. Tidal deformation and rotational dis-tortions of both stars and relativistic processes all contribute to the apsidal precession (Sterne 1939; Valsecchi et al. 2012). The relativistic apsidal precession amounts to 5.6 deg/yr, compared to which the precession rates due to tides and rotation are negligible.
Due to gravitational wave emission the white dwarfs will eventually merge. We calculate the merger time to be
τm= 1.14±0.07 Gyr (Marsh et al. 1995, Sect. 4.3).
4.2 Masses, radii, and hydrogen envelopes
0.4 0.6 0.8 1.0 white dwarf mass (M⊙)
0.000 0.005 0.010 0.015 0.020 0.025 0.030
w
h
it
e
d
w
ar
f
ra
d
iu
s
(R
⊙
)
1
[image:8.612.66.525.92.323.2]2
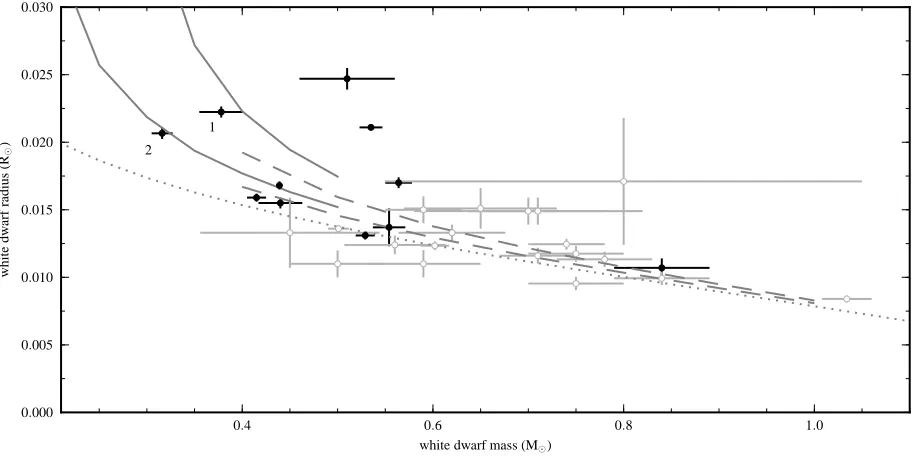
Figure 4. Mass-radius diagram showing all white dwarfs with model-independent mass and radius determinations. The hotter and
cooler white dwarf in CSS 41177 are indicated with a 1 and 2 respectively. Other measurements from eclipsing white dwarf binaries are shown as black dots (O’Brien et al. 2001; Maxted et al. 2004, 2007; Parsons et al. 2010, 2012a,b,c; Pyrzas et al. 2012). The grey dots are for white dwarfs based on parallax measurements (Shipman et al. 1997; Holberg et al. 1998; Provencal et al. 2002; Holberg et al. 2012) and common proper motion systems (Provencal et al. 1998; Casewell et al. 2009). The dotted line shows the zero-temperature mass-radius relations from Verbunt & Rappaport (1988). The solid grey lines are mass-radius relations for helium core white dwarfs with a hydrogen envelope mass of MH/M∗= 10−4, metallicity of Z=0.001, and with T=24500K (upper curve) and T=11500K (lower
curve) (Benvenuto & Althaus 1998). The dashed grey lines are for carbon/oxygen core white dwarfs, again with MH/M∗ = 10−4 and
T=24500K (upper curve) and T=11500K (lower curve) (Wood 1995).
0.0 0.1 0.2 0.3 0.4 0.5
white dwarf mass (M⊙) 0.000
0.005
0.010
0.015
0.020
0.025
0.030
w
h
it
e
d
w
ar
f
ra
d
iu
s
(R
⊙
)
0.30 0.35 0.40
0.020
[image:8.612.47.284.454.598.2]0.022
Figure 3. The 68 and 95 percentile contours for the masses and radii of the hotter white dwarf (black) and cooler white dwarf (grey) in CSS 41177. The lines indicate mass-radius rela-tions for hydrogen envelopes of MH/M∗= 10−4 (solid) MH/M∗
= 10−8 (dashed), for temperatures of T
WD = 24500 K (black)
and TWD= 11500 K (grey), and all with a metallicity of Z=0.001
(Benvenuto & Althaus 1998). The inset shows an enlargement of the contours and mass-radius relations.
Fig. 3 shows the results from our MCMC analysis for the masses and radii of both white dwarfs, as 68 and 95 percentile joint confidence regions. Also shown in Fig. 3 are
mass-radius relations for hydrogen envelope masses of 10−4
(solid lines) and 10−8(dashed lines) of the stellar mass, M∗,
for both white dwarf temperatures (Benvenuto & Althaus 1998). Our results are in good agreement with both rela-tions, but may favour a low-mass hydrogen envelope for the higher-mass and hotter white dwarf. Observational studies of pulsating white dwarfs suggest that the hydrogen content can be several orders of magnitude smaller than the
stan-dard prediction of stellar evolution of 10−4 M∗, see Bradley
(2001, Table 1). However, note that those listed white dwarfs are all of significantly higher mass than the CSS 41177 white dwarfs.
The current state of affairs is displayed in Fig. 4, which shows all highly accurate white dwarf masses and radii, de-termined independently of mass-radius relations. The two CSS 41177 white dwarfs (numbered 1 and 2) fall in an area of the mass-radius diagram that has hardly been ex-plored so far, and supply new tests for the theoretical mass-radius relations at low white dwarf masses. In general the measurements agree reasonably well with the models. Note that the solid and dashed grey mass-radius relations are
for temperatures of Teff= 24500 K and 11500 K (upper
and lower curves), and that the two notable outliers are both white dwarfs that are significantly hotter (CSS 03170: Parsons et al. 2012c and NN Ser: Parsons et al. 2010).
Using the same models by Benvenuto & Althaus (1998), we determined the cooling age for the hotter white dwarf to
be∼50 Myr. The cooler white dwarf is substantially older
at∼330 Myr.
1000 2000 3000 4000 5000 6000 7000 8000 9000 wavelength ( ˚A)
10−16
10−15
10−14
fλ
(e
rg
/c
m
2/s
/
[image:9.612.64.522.86.323.2]˚ A)
Figure 5.Comparison of observed and model spectra of CSS 41177. The broad light grey line shows 100 different overlapping models,
randomly chosen from our MCMC analysis. Each consists of a combination of two white dwarf model spectra corresponding to the MCMC parameters. The total model is scaled to the dereddened g′band SDSS magnitude (m
g = 17.14) and an interstellar extinction
of E(B-V) = 0.0339 (Schlegel et al. 1998) is taken into account using the expressions presented in Seaton (1979) and Howarth (1983). The dark grey line shows the observed SDSS spectrum, and the black dots indicate the GALEX far-UV, GALEX near-UV and SDSS u′,
g′, r′, i′and z′ fluxes (from left to right; errorbars too small to be seen).
mass transfer during their evolution, the second of which is thought to result in a common envelope phase. The nature of the first is less certain, but was most likely a common enve-lope or stable Algol-like mass transfer (Iben et al. 1997). Dif-ferent binary population synthesis codes agree that both of these evolutionary paths could produce the final CSS 41177 parameters (Toonen et al. 2013, Fig. A.22 and A.24). Un-der conservative mass transfer, Algol evolution may lead to too small a final orbital separation. Therefore stable non-conservative mass transfer (Woods et al. 2012), or a
com-mon envelope following theγ-prescription (Nelemans et al.
2000) could be a more accurate description of the first phase of mass transfer.
4.3 White dwarf pulsations
In the method explained in Sect. 3 we effectively mea-sured the white dwarf temperatures from the depths of the eclipses in the different bands and the temperature-dependent specific intensities from Gianninas et al. (2013). With this approach the temperatures determined are in-dependent of both the SDSS spectrum and model spec-tra, which formed the basis of the temperatures derived by Parsons et al. (2011). In contrast to their results, we obtain somewhat higher values for both white dwarf temperatures. This is, at least in part, due to the fact that they did not include the effect of reddening. The SDSS spectrum and a group of representative models from our MCMC analysis are plotted in Fig. 5, with reddening accounted for. The model spectra show that we overestimate the GALEX far-UV flux, indicating that our white dwarf temperatures may be too
high. To assess how this influences our conclusions on the masses and radii we ran an additional MCMC analysis in which we fixed the temperature of the hotter white dwarf
toT1 = 21100 K, the value found in Parsons et al. (2011).
The results are shown in the last column of Table 4. As ex-pected, the temperature of the cooler white dwarf is also reduced, but the effect on other parameters is well within the uncertainties.
The results from our light curve analysis place the cooler, secondary white dwarf very close to the blue edge of the DA white dwarf instability strip, and the results from
our analysis with the fixed lowT1places it near the red edge
of the strip, so we looked for signs of pulsations in the light curve. We inspected the January 2012 data, excluding the single primary eclipse observation from May 2011 to avoid artificial low-frequency signals. Looking at the out-of-eclipse data, we did not find any pulsations with an amplitude
ex-ceeding 3.0, 1.0 and 1.1 mmag in the u′, g′ and r′ band.
However, the secondary white dwarf’s contribution to the flux is strongly diluted by the presence of the primary white dwarf and the flux ratios differ in the three bands. For the
u′, g′ and r′ band the primary to secondary flux ratios are
7.7, 4.3 and 3.5 respectively. Correcting for the flux dilution this translates to a non-detection of pulsations with an
am-plitude exceeding 26.1, 5.3 and 5.0 mmag in the u′, g′ and
r′ band.
The contribution of the secondary to the total amount
of flux is highest in the r′
band, but white dwarf pulsa-tion amplitudes for non-radial modes increase towards bluer
wavelengths. For thel= 1 andl= 2 modes the amplitude
9000 10000
11000 12000
13000
Teff(K) 5.0
5.5
6.0
6.5
7.0
7.5
8.0
8.5
9.0
lo
g
(g
)
CSS 41177
[image:10.612.308.543.86.246.2]CSS 41177 (fixed T1)
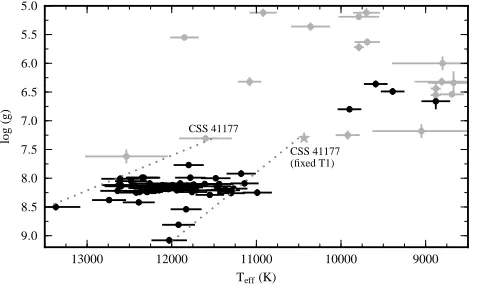
Figure 6.ZZ Ceti diagram, showing the position of the cooler
secondary white dwarf in CSS 41177, both from our standard analysis and from our analysis with a the fixed low value forT1=
21100 K. In the bottom left corner are the pulsating white dwarfs found by Gianninas et al. (2011), and their empirical boundaries for the instability strip. Also in that corner is the most massive pulsating white dwarf found so far, by Hermes et al. (2013a). To-wards the top right corner are five pulsating white dwarfs found by Hermes et al. (2012) and Hermes et al. (2013b) (one is off the plot at the right). The grey dots represent those white dwarfs that have been found not to be pulsating (Steinfadt et al. 2012; Hermes et al. 2012, 2013c,b).
the r′band (Robinson et al. 1995). Therefore our strongest
constraint comes from the g′ band.
Fig. 6 shows the log(g) versus Teff diagram, with
the white dwarfs found to be pulsating (black dots: Gianninas et al. 2011; Hermes et al. 2012, 2013b), and those without pulsations down to 10 mmag (grey dots: Steinfadt et al. 2012; Hermes et al. 2012, 2013c,b). The latter group now includes the secondary white dwarf of CSS 41177, which is pushing on the boundary of the insta-bility strip. Results from the analysis described in Sect. 3 put it at the blue edge of the strip, whereas the results from
our analysis with a fixed low value forT1 put the secondary
at the red edge. Because Parsons et al. (2011) did not ac-count for reddening, the temperatures they derived are an underestimate and the secondary will be somewhat hotter than shown with the star in Fig. 6, placing it even inside the current empirical instability strip.
Note that the data we have are not ideally suited to search for pulsations, due to the brief sections of out-of-eclipse data. With continuous observations spanning several orbital periods one could push the limit further down, or possibly detect small amplitude pulsations.
4.4 Orbital period variations
Fig. 7 shows the mid-eclipse times of the primary eclipses in an observed minus calculated (O-C) diagram, where the calculation is based on the linear ephemeris in Eq. 6. All our ULTRACAM and LT/RISE data are included. For the
ULTRACAM data we show the weighted mean of the u′,
g′
and r′
data. All eclipse times are listed in Table 3. This binary is an ideal target for eclipse timing, a method which can be used to detect the presence of circum-binary planetary-like companions (see for
ex-2011 2012 2013
−5
0 5
O
-C
(s
ec
o
n
d
s)
−3000 −2000 −1000 0 1000 2000 3000
[image:10.612.48.287.93.237.2]cycle number
Figure 7. Observed minus calculated (O-C) diagram for the
primary eclipses of CSS 41177, including our ULTRACAM and LT/RISE data and 5 eclipse observations from Backhaus et al. (2012, shown in grey). We used the ephemeris from Eq. 6. The ULTRACAM eclipses were observed in three filters simultane-ously, and the times shown here are the weighted averages of these. See Table 3 for a list of our eclipse times.
ample Marsh et al. 2013; Beuermann et al. 2010, 2013; Potter et al. 2011). This is because the orbital decay through
gravitational wave radiation is only∼0.5 second over a
base-line of 10 years. Also orbital period variations due to mag-netic cycles in the stars (the so-called Applegate’s mecha-nism, see Applegate 1992) are unlikely, as this mechanism is expected to be extremely weak or non-existent in white dwarfs. Even if the orbit is indeed eccentric, as discussed in Sect. 4.1, the apsidal precession of the orbit is too slow to cause a noticeable deviation in the eclipse times over a realistic observational baseline.
5 CONCLUSIONS
We have presented our high signal to noise observations of CSS 41177 and the analysis of both the spectroscopic and photometric data. The high spectral and temporal resolu-tion and the ULTRACAM observaresolu-tions in three wavelength bands allowed us to accurately model the binary and both white dwarfs, without the need to use mass-radius relations. The results place these two white dwarfs in a region of the mass-radius diagram that is as yet unexplored; they are the lowest mass white dwarfs with parameters determined without the need to assume a mass-radius relation. Our re-sults agree with white dwarf models for the corresponding temperatures and with standard hydrogen envelopes. There are signs that the hydrogen layers on both CSS 41177 white
dwarfs are thinner than the commonly assumed MH= 10−4
M∗.
Additionally, the secondary, cooler white dwarf explores a new region of the ZZ Ceti diagram. Although its temper-ature and surface gravity put it close to the boundary of the ZZ Ceti instability strip, we found no significant pulsa-tions in the light curve to a limit of roughly 0.5% relative amplitude.
pri-mary eclipse. Although the Rømer delay predicts such an offset, it also predicts that the secondary eclipse will occur late, whereas we measured it to occur early. Therefore the orbit of the two white dwarfs may be slightly eccentric. To measure this effect more precisely more secondary eclipse observations are needed.
ACKNOWLEDGEMENTS
We thank Detlev Koester for the use of the white dwarf model spectra and the referee for helpful comments and suggestions. TRM, CMC and BTG were supported under a grant from the UK Science and Technology Facilities Coun-cil (STFC), ST/I001719/1. SGP acknowledges support from the Joint Committee ESO-Government of Chile. VSD, SPL and ULTRACAM are supported by the STFC. The research leading to these results has received funding from the Eu-ropean Research Council under the EuEu-ropean Union’s Sev-enth Framework Programme (FP/2007-2013) / ERC Grant Agreement n. 320964 (WDTracer).
The William Herschel Telescope is operated on the is-land of La Palma by the Isaac Newton Group in the Spanish Observatorio del Roque de los Muchachos of the Instituto de Astrofísica de Canarias. The Liverpool Telescope is operated on the island of La Palma by Liverpool John Moores Univer-sity in the Spanish Observatorio del Roque de los Muchachos of the Instituto de Astrofísica de Canarias with financial sup-port from the UK Science and Technology Facilities Council. This research has made use of NASA’s Astrophysics Data System.
REFERENCES
Applegate, J. H., 1992, ApJ, 385, 621 Backhaus, U., et al., 2012, A&A, 538, A84
Barstow, M. A., Bond, H. E., Holberg, J. B., Burleigh, M. R., Hubeny, I., Koester, D., 2005, MNRAS, 362, 1134 Benvenuto, O. G., Althaus, L. G., 1998, MNRAS, 293, 177 Beuermann, K., Dreizler, S., Hessman, F. V., 2013, A&A,
555, A133
Beuermann, K., et al., 2010, AAP, 521, L60
Bildsten, L., Shen, K. J., Weinberg, N. N., Nelemans, G., 2007, ApJ, 662, L95
Bloemen, S., et al., 2011, MNRAS, 410, 1787 Bradley, P. A., 2001, ApJ, 552, 326
Breedt, E., Gänsicke, B. T., Marsh, T. R., Steeghs, D., Drake, A. J., Copperwheat, C. M., 2012, MNRAS, 425, 2548
Brown, W. R., Kilic, M., Hermes, J. J., Allende Prieto, C., Kenyon, S. J., Winget, D. E., 2011, ApJ, 737, L23 Casewell, S. L., Dobbie, P. D., Napiwotzki, R., Burleigh,
M. R., Barstow, M. A., Jameson, R. F., 2009, MNRAS, 395, 1795
Claret, A., 2000, A&A, 363, 1081
Dhillon, V. S., et al., 2007, MNRAS, 378, 825 Drake, A. J., et al., 2009, ApJ, 696, 870 Drake, A. J., et al., 2010, ArXiv e-prints
Gianninas, A., Bergeron, P., Ruiz, M. T., 2011, ApJ, 743, 138
Gianninas, A., Strickland, B. D., Kilic, M., Bergeron, P., 2013, ApJ, 766, 3
Hermes, J. J., Montgomery, M. H., Winget, D. E., Brown, W. R., Kilic, M., Kenyon, S. J., 2012, ApJ, 750, L28 Hermes, J. J., Kepler, S. O., Castanheira, B. G., Gianninas,
A., Winget, D. E., Montgomery, M. H., Brown, W. R., Harrold, S. T., 2013a, ApJ, 771, L2
Hermes, J. J., et al., 2013b, ArXiv e-prints Hermes, J. J., et al., 2013c, ApJ, 765, 102
Hobbs, G. B., Edwards, R. T., Manchester, R. N., 2006, MNRAS, 369, 655
Holberg, J. B., Barstow, M. A., Sion, E. M., 1998, ApJS, 119, 207
Holberg, J. B., Oswalt, T. D., Barstow, M. A., 2012, AJ, 143, 68
Howarth, I. D., 1983, MNRAS, 203, 301
Iben, Jr., I., Tutukov, A. V., 1984, ApJS, 54, 335
Iben, Jr., I., Tutukov, A. V., Yungelson, L. R., 1997, ApJ, 475, 291
Kaplan, D. L., 2010, ApJ, 717, L108 Kaplan, D. L., et al., 2013, ArXiv e-prints Kilic, M., et al., 2013, ArXiv e-prints Koester, D., 2009, A&A, 498, 517
Koester, D., 2010, Mem. Soc. Astron. Italiana, 81, 921 Marsh, T. R., 2001, MNRAS, 324, 547
Marsh, T. R., Dhillon, V. S., Duck, S. R., 1995, MNRAS, 275, 828
Marsh, T. R., et al., 2013, MNRAS
Maxted, P. F. L., Marsh, T. R., Morales-Rueda, L., Barstow, M. A., Dobbie, P. D., Schreiber, M. R., Dhillon, V. S., Brinkworth, C. S., 2004, MNRAS, 355, 1143 Maxted, P. F. L., O’Donoghue, D., Morales-Rueda, L.,
Napiwotzki, R., Smalley, B., 2007, MNRAS, 376, 919 Moffat, A. F. J., 1969, A&A, 3, 455
Nelemans, G., Verbunt, F., Yungelson, L. R., Portegies Zwart, S. F., 2000, A&A, 360, 1011
Nomoto, K., 1982, ApJ, 253, 798
O’Brien, M. S., Bond, H. E., Sion, E. M., 2001, ApJ, 563, 971
Paquette, C., Pelletier, C., Fontaine, G., Michaud, G., 1986, ApJS, 61, 197
Parsons, S. G., Marsh, T. R., Gänsicke, B. T., Drake, A. J., Koester, D., 2011, ApJL, 735, L30
Parsons, S. G., et al., 2010, MNRAS, 407, 2362 Parsons, S. G., et al., 2012a, MNRAS, 420, 3281 Parsons, S. G., et al., 2012b, MNRAS, 426, 1950 Parsons, S. G., et al., 2012c, MNRAS, 419, 304 Potter, S. B., et al., 2011, MNRAS, 416, 2202
Provencal, J. L., Shipman, H. L., Hog, E., Thejll, P., 1998, ApJ, 494, 759
Provencal, J. L., Shipman, H. L., Koester, D., Wesemael, F., Bergeron, P., 2002, ApJ, 568, 324
Pyrzas, S., et al., 2012, MNRAS, 419, 817 Renzini, A., et al., 1996, ApJ, 465, L23 Robinson, E. L., et al., 1995, ApJ, 438, 908
Schlegel, D. J., Finkbeiner, D. P., Davis, M., 1998, ApJ, 500, 525
Schmidt, H., 1996, A&A, 311, 852 Seaton, M. J., 1979, MNRAS, 187, 73P
Steele, I. A., et al., 2004, in Oschmann, Jr., J. M., ed., So-ciety of Photo-Optical Instrumentation Engineers (SPIE)
Conference Series, vol. 5489 of Society of Photo-Optical
Instrumentation Engineers (SPIE) Conference Series, p. 679
Steinfadt, J. D. R., Kaplan, D. L., Shporer, A., Bildsten, L., Howell, S. B., 2010, ApJL, 716, L146
Steinfadt, J. D. R., Bildsten, L., Kaplan, D. L., Fulton, B. J., Howell, S. B., Marsh, T. R., Ofek, E. O., Shporer, A., 2012, PASP, 124, 1
Sterken, C., 2005, in Sterken, C., ed., The Light-Time Ef-fect in Astrophysics: Causes and cures of the O-C
dia-gram, vol. 335 ofAstronomical Society of the Pacific
Con-ference Series, p. 181
Sterne, T. E., 1939, MNRAS, 99, 451
Toonen, S., Claeys, J. S. W., Mennekens, N., Ruiter, A. J., 2013, ArXiv e-prints
Tremblay, P.-E., Ludwig, H.-G., Steffen, M., Bergeron, P., Freytag, B., 2011, A&A, 531, L19
Tremblay, P.-E., Ludwig, H.-G., Steffen, M., Freytag, B., 2013, A&A, 552, A13
Valsecchi, F., Farr, W. M., Willems, B., Deloye, C. J., Kalogera, V., 2012, ApJ, 745, 137
Vennes, S., et al., 2011, ApJ, 737, L16
Verbunt, F., Rappaport, S., 1988, ApJ, 332, 193 Vernet, J., et al., 2011, A&A, 536, A105 Webbink, R. F., 1984, ApJ, 277, 355 Weidemann, V., 2000, A&A, 363, 647 Whelan, J., Iben, Jr., I., 1973, ApJ, 186, 1007 Winn, J. N., 2010, ArXiv e-prints
Wood, M. A., 1992, ApJ, 386, 539
Wood, M. A., 1995, in Koester, D., Werner, K., eds.,
White Dwarfs, vol. 443 ofLecture Notes in Physics, Berlin
Springer Verlag, p. 41
Woods, T. E., Ivanova, N., van der Sluys, M. V., Chaich-enets, S., 2012, ApJ, 744, 12