White Rose Research Online [email protected]
Universities of Leeds, Sheffield and York
http://eprints.whiterose.ac.uk/
This is the author’s post-print version of an article published inForest Ecology and Management, 310
White Rose Research Online URL for this paper:
http://eprints.whiterose.ac.uk/id/eprint/77906
Published article:
Goodman, RC, Phillips, OL, Del Castillo Torres, D, Freitas, L, Cortese, ST, Monteagudo, A and Baker, TR (2013)Amazon palm biomass and allometry. Forest Ecology and Management, 310. 994 - 1004. ISSN 0378-1127
1
Amazon palm biomass and allometry
12
Rosa C. Goodmana*, Oliver L. Phillipsa, Dennis del Castillo Torresb, Luis Freitasb, Sebastián 3
Tapia Cortese c, Abel Monteagudod,e, and Timothy R. Bakera 4
5 a
School of Geography, University of Leeds, Leeds, UK LS2 9JT 6
b
Instituto de Investigaciones de la Amazonía Peruana (IIAP), Iquitos, Perú 7
c
Foro de Etnobiología, Lima, Perú 8
d
Herbario Vargas, Universidad Nacional San Antonio Abad del Cusco, Cusco, Perú 9
e
Proyecto Flora del Perú, Jardín Botánico de Missouri, Oxapampa, Perú 10
11
* Corresponding author. Tel: +44 11334 39448; 12
E-mail addresses: [email protected] (R. C. Goodman), [email protected] (O. L.
13
Phillips), [email protected] (D. del Castillo Torres), [email protected] (L. Freitas), 14
[email protected] (S. Tapia Cortese), [email protected] (A. 15
Monteagudo), and [email protected] (T. R. Baker) 16
Abstract
18
Palms (family Arecaceae) are abundant in Amazonian forests, but the allometry of these 19
monocotyledonous plants remains poorly quantified. Woody palm biomass is most commonly 20
estimated with dicotyledonous tree models, which leaves substantial uncertainty as to their true 21
biomass and productivity. We developed the first extensive dataset of directly-measured 22
arborescent palm biomass: 136 individuals from nine species in terra firme and wetland forests 23
―Astrocaryum murumuru, Attalea phalerata, Bactris gasipaes, Euterpe precatoria, Iriartea
24
deltoidea, Mauritia flexuosa, Mauritiella aculeata, Oenocarpus bataua, and Socratea exorrhiza. 25
We created single species (n = 8–21) and family-level (n = 97–106) allometric equations, using 26
diameter, stem height, total height, and stem dry mass fraction, to estimate (i) total aboveground 27
biomass for all species, (ii) belowground biomass for the two wetland species (Mauritia and 28
Mauritiella), and (iii) leaf mass for all species. These new palm models were then applied to nine 29
1-ha plots in the southwestern Amazon (Tambopata) to calculate the impact on forest biomass 30
estimates once palm mass is estimated with palm-specific models, rather than from models 31
created for dicot trees. We found that stem height was the best predictor variable for arborescent 32
palm biomass, but the relationship between stem height and biomass differed among species. 33
Most species showed weak biomass–diameter relationships, but a significant relationship could 34
be identified across all species. The new palm models were better estimators of palm mass than 35
existing dicot models. Using our species-level models increased estimates of palm biomass at our 36
study site by 14–27 %, compared to using recently published pantropical biomass models for 37
trees. In other forests, the effect of using these palm equations on biomass estimates will depend 38
on palm sizes, abundance, and species composition. 39
40
1 Introduction
42
Palms (family Arecaceae or Palmae) are an ancient part of tropical ecosystems (Bremer et 43
al., 2004) and one of the most widespread and ecologically diverse plant families (Tomlinson, 44
2006; Eiserhardt et al., 2011). They play major roles in ecosystem processes (Peters et al., 2004; 45
LaFrankie and Saw, 2005) and local livelihoods (May et al., 1985; Johnson, 1996; Runk, 1998). 46
Arecaceae is one of the most heavily used plant families for non-timber forest products with 47
multiple applications in indigenous and rural activities, mostly associated with food, fibres, 48
animal fodder, and construction (Peters et al., 1989; Phillips and Gentry, 1993; Johnson, 1996; 49
Zambrana et al., 2007). 50
Nearly 2,400 species of palms occur across the Neotropics, Africa, and Asia (Govaerts and 51
Dransfield, 2005). Within the Neotropics, palms are most abundant in western Amazonia and 52
Central America (Kahn et al., 1988; Terborgh and Andresen, 1998; Montufar and Pintaud, 2006; 53
Eiserhardt et al., 2011). They are less prevalent in other regions but still occur, especially in 54
forests with frequent inundation (Kahn et al., 1988; Terborgh and Andresen, 1998) and soils with 55
poor physical properties, such as shallow rooting depth (Emilio et al., 2013). Arecaceae is the 56
single most abundant arborescent plant family in western Amazonian forests, in both terra firme
57
and flooded forests (Terborgh and Andresen, 1998). In some forests, palms have been found to 58
represent over two-thirds of stems with diameter (D) ≥ 10 cm (Terborgh and Andresen, 1998) or 59
nearly 100 % of stand biomass (Brown, 1997). Indeed, some species, such as Mauritia flexuosa, 60
can establish nearly mono-dominant stands ('aguajales'; Kahn and Mejia, 1990) and are an 61
integral part of many carbon-rich swamp ecosystems (Lahteenoja et al., 2009). 62
Despite their importance, there are no explicit studies of carbon stocks and dynamics of 63
palms. While many models have been developed to estimate the biomass of dicotyledonous 64
(dicot) trees (e.g., Brown et al., 1989; Baker et al., 2004; Chave et al., 2005; Basuki et al., 2009; 65
Alvarez et al., 2012; Feldpausch et al., 2012), there are few available to estimate palm biomass. 66
Thus, most stand-level and macro-ecological studies use dicot models to estimate palm mass 67
(e.g., Malhi et al., 2004; Phillips et al., 2008; Baccini et al., 2012) or stem basal area to assess 68
aboveground biomass (AGB) changes (e.g., Lewis et al., 2004; Malhi et al., 2004). The 69
productivity of palms has also been poorly studied, and palms have even been described as a 70
‘missing term’ in coarse woody productivity assessments (Malhi et al., 2009). For example, palm 71
substantially, and palm fruit productivity may be severely underestimated because they do not fit 73
into standard leaf litter traps (Chave et al., 2010). Overall, these factors lead to substantial 74
uncertainty in AGB stocks and productivity in areas where palms are prevalent. 75
Estimates of palm biomass and stem productivity made from dicot models are likely to be 76
inaccurate, especially when using D and wood density (ρ), because the two groups of plants have 77
very distinct growth patterns and internal properties. Palms are monocotyledons which grow in 78
height but lack secondary (diameter) growth (Rich et al., 1986; Tomlinson, 2006). Thus, many 79
species have weak or no relationship between height and diameter (Rich et al., 1986). The 80
internal stem structure is also very different in palms (Parthasarathy and Klotz, 1976), with 81
higher density and stiffness towards the peripheries and base of the stem (Rich, 1987b), and 82
‘wood’ density in Arecaceae is generally lower than in dicot families (Chave et al., 2009; Zanne 83
et al., 2009). Furthermore, palms lack branches, which can contribute substantially to dicot 84
biomass (Goodman et al., in press). This suggests that palm biomass may be overestimated by 85
dicot equations, but this has yet to be tested on directly-measured palm biomass data. 86
The lack of palm biomass equations is puzzling: there are still no broadly accepted or 87
applicable equations to estimate their mass. The few existing palm models are created for a 88
single species and often do not cover a wide range of sizes. Most palm models appear in 89
technical reports or other unpublished works (Hughes, 1997; Delaney et al., 1999; Brown et al., 90
2001; Freitas et al., 2006; Sierra et al., 2007; Kumar and Russell, unpublished, cited in Kumar, 91
2011). The only three peer-reviewed publications we could locate were each developed for a 92
single species in a particular environment: Prestoea montana in sub-montane Puerto Rico 93
(Frangi and Lugo, 1985), oil palm (Elaeis guineensis) under commercial cultivation (Thenkabail 94
et al., 2004), and Oenocarpus bataua in a transition zone from lowland to premontane forests in 95
Colombia (Sierra et al., 2007). One mixed-species model has been developed but only for very 96
small individuals, 1 ≤ height ≤ 1.5 m (Sierra et al., 2007). There is clearly a strong need to 97
develop more widely applicable equations to estimate the biomass and productivity of this 98
prevalent and important plant group. 99
Similarly, there has been no rigorous examination of the most appropriate form of palm 100
allometric relationships. Most models are built with the simple form: biomass = a + bx (Frangi 101
and Lugo, 1985; Thenkabail et al., 2004; Kumar and Russell, unpublished, cited in Kumar, 102
(e.g., West et al., 1997; Chave et al., 2005). Stem height is the most commonly used predictor 104
variable (x) for palm mass (Frangi and Lugo, 1985; Delaney et al., 1999; Brown et al., 2001; 105
Thenkabail et al., 2004; Sierra et al., 2007), but others have used total height (Frangi and Lugo, 106
1985), diameter (Hughes, 1997), or age (Kumar and Russell, unpublished, cited in Kumar, 2011) 107
to estimate palm biomass. Brown (1997) suggested that palm biomass could be estimated using 108
height and D as if palms were cylinders (i.e., D2H), multiplied by wood density, and added to a 109
term accounting for leaves, but this approach has yet to be applied. Estimating AGB with 110
compound variable ρD2H and a form factor to account for stem taper is common for dicots 111
(Chave et al., 2005; Feldpausch et al., 2012) but may be particularly appropriate for palm 112
allometry because they lack branches. Non-linear relationships between biomass and the 113
predictor variable(s) ―such as with a power-law, as has been suggested on theoretical grounds 114
(West et al., 1997)― have also not been comprehensively tested. 115
Because palms exhibit primary (height) growth nearly independently of diameter and stems 116
taper little, we expect that that (i) height will be highly predictive of palm biomass, and (ii) palm 117
mass should be approximately proportional to its volume calculated as a cylindrical form with D2
118
and total or stem height. Furthermore, because palm ‘wood’ density can vary 10-fold between 119
species and even within individuals (Rich, 1987b), we expect that a variable accounting for 120
density or moisture content will be necessary to include in mixed-species models. Our specific 121
objectives are to (i) create single species and family-level models for arborescent palms using a 122
variety of simple and compound predictor variables and model forms and then (ii) examine the 123
impact of applying new palm models on forest biomass estimates in a well-studied western 124
Amazonian site where arborescent palms are common. 125
2 Materials and methods
126
2.1 Species selection and study area
127
Species or genera were selected to include the six most dominant arborescent palm species 128
in the Amazon ―Iriartea deltoidea, Attalea butyracea, Oenocarpus bataua, Euterpe precatoria, 129
Socratea exorrhiza, and Astrocaryum murumuru (Emilio et al., 2013)― and two prominent 130
species in wetland forests, Mauritia flexuosa and Mauritiella spp. (Kahn, 1991; Roucoux et al., 131
2013). We focus on arborescent palms because these are included in most forest inventories (D≥ 132
Palms were harvested from mature forests in western Amazonia. In 2006, Mauritia
134
flexuosa and Mauritiella aculeata were harvested and weighed in wetlands within the Pacaya– 135
Samiria National Reserve in Loreto, Peru. In 2011, biomass data were collected from seven 136
species in terra firme, moist tropical forests within a forestry concession in Madre de Dios, Peru 137
(Table 1). 138
2.2 Data collection
139
In total, 136 arborescent palms from nine species were individually measured, harvested, 140
and weighed in 2006 and 2011 (Table 1). Similar methods were used throughout. Sampling was 141
designed to represent the entire range of stem heights exhibited by each species. In Madre de 142
Dios, individuals from each species were selected within a 100-m radius of dicot trees harvested 143
in a concurrent study (Goodman et al., in press), and the first individual encountered to fulfil the 144
stem height criteria was selected so that there was no bias towards any certain form or structural 145
integrity. Before harvesting, D was measured at 1.3 m or above the highest root and total height 146
(Htot) was measured from the ground to the highest point of the highest leaf. After felling, stem
147
height (Hstem) was measured from ground level to the point where the first (lowest) leaf parted
148
from the stem. All leaves were counted, and, in the Madre de Dios dataset, the length of three 149
randomly-selected leaves was measured from the base of the rachis to the tip of the terminal 150
leaflet. 151
Fresh mass of all plant parts was measured in the field immediately after felling. 152
Aboveground parts were divided into aboveground roots, stem, leaves (petiole, rachis, and 153
leaflets), and other parts (flowers, fruits, bracts, etc), and measured in the field with a 250 kg 154
capacity scale with 0.1 kg precision. In Loreto, belowground roots were also sampled following 155
Gallardo-Ordinola (2001). Fine roots were sampled from eight soil cores (10 cm diameter and 90 156
cm deep). Four cores were excavated from each of two directions extending 80 cm from the base 157
of the stem at 90°. The entire main root was then extracted using a 3-ton hand winch and 158
weighed (Freitas et al., 2006). 159
Stem samples were collected from 3–4 individuals per species (except Bactris, n = 2) to 160
estimate moisture content. In Madre de Dios, samples were collected from individuals in the 161
lower, middle, and upper height classes per species; and three samples were collected from each 162
individual ―at the base, middle, and top of each stem (Table A.1). In Loreto, three individuals 163
Dios, we collected a composite leaf sample consisting of one leaf sample from each species 165
including the rachis and attached leaflets. In Loreto, leaves were sampled from three individuals 166
per species. Fresh mass of each sample was measured immediately in the field. Samples were 167
then air-dried and transported to a drying oven. In this study, we did not measure ρ directly 168
because volume measurement errors would have been virtually unavoidable. Measuring volume 169
by water displacement would have relied upon doing so immediately, which was not possible in 170
the field, and estimating volume by calliper or ruler measurements would have been inaccurate 171
due to uneven edges and thickness of the sample cut. 172
[Table 1] 173
2.3 Laboratory work and data preparation
174
Stem samples were dried at 101 °C and leaf samples at 65 °C (Williamson and Wiemann, 175
2010), and dry mass was recorded after three consecutive days of constant mass with a digital 176
scale with 1 mg precision. Dry mass fraction (dmf) was calculated as the proportion of dry mass 177
per unit fresh mass (dry mass/ fresh mass or 1 – moisture content). Individual mean dmf was 178
calculated as the mean of three samples taken at different points along the stem (Table A.1), and 179
species mean dmf was calculated as the average of individual means (Table 2). Carbon content 180
was determined for Mauritiella and Mauritia by calorimetry (Segura-Madrigal, 1997) at 181
Universidad Nacional Agraria La Molina, Lima, Peru. To test whether dmf is a better 182
explanatory variable than wood density, we followed the established practice of assigning ρ 183
values to each individual species to the finest taxonomy available according the Global Wood 184
Density Database (Chave et al., 2009; Zanne et al., 2009). 185
Stem, root, and leaf dry mass of every individual in the database was calculated as fresh 186
mass × dmf, where dmf is mean dmf for each tissue for each species (Table 2). Mean individual 187
leaf mass was calculated by dividing total leaf mass by the number of leaves. 188
2.4 Model development and evaluation
189
All species were arborescent with a single stem and multiple leaves. Because of their 190
simple growth form (no or very little diameter growth and no branches), models were created 191
using Hstem, Htot, and two compound variables based on the premise that palms are nearly
192
cylindrical (D2Htot and D2Hstem). Single-species models to estimate AGB were created for each
193
Mauritiella. Given the ubiquity of forest inventories measuring D only, we also attempted to 195
create models to estimate AGB without any height variable. 196
To create family-level equations, data from all species were combined. A subset of data 197
―the individuals from which stem dmf samples were taken (n = 27)― were excluded to test the 198
developed models. We used the same five variables as the single-species equations, plus four 199
additional compound variables, dmfD2Htot, and dmfD2Hstem, ρD2Htot, ρD2Hstem, where dmf is the
200
species mean dmf of the stem determined in this study and ρ is ‘wood’ density for species, genus, 201
or family obtained from Global Wood Density Database (Chave et al., 2009; Zanne et al., 2009). 202
Finally, we created a mixed-species regression model to estimate mean leaf mass from leaf 203
length. 204
For each explanatory variable, we tested five model forms: simple linear, third-order 205
polynomial, exponential, logarithmic, and power. In several instances, variables in the linear 206
models had to be transformed to satisfy the assumption of equal variance and normality of the 207
residuals. Non-significant terms were removed via backwards elimination. All models were built 208
using the linear model function (lm) in R, version 2.15.1. For family-level models, we also 209
performed a generalised linear model (glm) analysis using the final linear model and species to 210
test whether the slope and intercept terms were significantly different between species (e.g., 211
AGB~D+Species). However, because no a priori factor ―such as habitat or phylogeny― could 212
explain species differences, we included all species in the final equations to make them the most 213
broadly-applicable possible. We evaluated models based on coefficient of determination (R2), 214
residual standard error (RSE), and Akaike information criterion (AIC), when comparable. 215
Next, all family-level models were evaluated against the test data (n = 27) to examine their 216
suitability. For the test data, dry mass was calculated from the directly-measured dmf and fresh 217
mass and of each individual (Table A.1). Finally, we used the full directly measured palm 218
biomass dataset (n = 136) to both further evaluate the recommended models and to assist the 219
interpretation of the forest plot analysis. A correction factor, exp(RSE2/2), was applied to 220
biomass estimates from logarithmically transformed models (Baskerville, 1972). We examined 221
the errors produced by the recommended species-level models, selected family models, and two 222
dicot equations (Feldpausch et al., 2012). Errors (kg) were calculated on the original scale as 223
masspredicted – massobserved, and relative errors (%) were calculated as error/ massobserved × 100 %. 224
%), and mean and standard deviation of relative errors. Overall predictability was assessed by 226
standard deviation of the relative errors (Chave et al., 2005), and R2 was calculated on the 227
original scale as 1 – (SSerror / SStotal). 228
2.5 Implications for forest biomass
229
To explore the implications of using new palm models on palm and forest biomass 230
estimates in western Amazonia, we estimated stand level AGB density on nine, 1-ha permanent 231
plots within the Tambopata National Reserve in Madre de Dios, Peru (12.8⁰ S, 69.3⁰W). Plots 232
were established between 1979 and 2010 and have been recensused every 2–3 years by 233
RAINFOR researchers (Malhiet al., 2002). All individuals with D ≥ 10 cm are included in the 234
inventories and have been botanically identified. In 2011, D of all individuals was remeasured, 235
and data were obtained from the ForestPlots.net database on 2 August 2012 (Lopez-Gonzalez et 236
al., 2011; Lopez-Gonzalez et al., 2012). For this study, total and stem heights were measured on 237
all palms with a laser hypsometer (Nikon Forestry 550) during the same year. 238
We estimated AGB using two published dicot and four new palm models. First, we used 239
two new pantropical biomass models (Feldpausch et al., 2012) using ρ and D only (Feld 1) and ρ, 240
D,and estimated H (Feld 2) to estimate AGB of all trees and palms. Total height was estimated 241
from D using the Weibull model for western Amazonia (Table 3 in Feldpausch et al., 2012). 242
Next, we recalculated AGB of all palms using the recommended species-level models and three 243
family-level models (Table 3). For species without a specific model (Astrocaryum gratum,
244
Attalea butyracea, A. cephalotes, A. maripa, and O. mapora; 7.4 % of all palms), we used the 245
model for the same genus. Each of the new palm estimates were compared to estimates made by 246
the two dicot models at the stand level. 247
3 Results
248
3.1 Architecture and internal properties
249
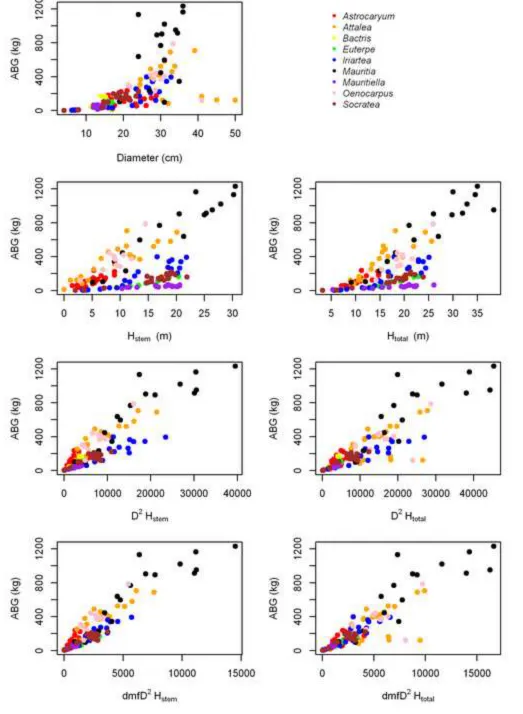
For most species, height–diameter relationships were weak and height could not be 250
predicted from D (Figure 1A). Some species had a broad range of heights across a broad range of 251
diameters with very little relationship between the two (Astrocaryum and Attalea); the two 252
wetland species had a broad range of heights over a very narrow range of diameters (Mauritia
253
and Mauritiella); others were clustered with very narrow height and diameter ranges 254
(Oenocarpus and Socratea); while height and diameter were clearly related for Euterpe and 255
Dry mass fraction varied between species (Table 2), among individuals of the same 257
species, and along the stem of the same individual (Appendix, Table A.1). There appeared to be 258
a slight negative relationship between dmf and height at which the sample was collected (i.e., dmf
259
greatest at base) and a very slight positive relationship between mean stem dmf and the height of 260
the individual (i.e., mean dmf greater in taller individuals). However, no significant relationships 261
could be determined, so we calculated individual dmf as the mean of the three samples taken 262
along each stem and species-level dmf as the simple mean of the three individuals per species. 263
Mean dmf was consistently higher for leaf tissue than stem or root tissues (Table 2). Carbon 264
fraction was usually slightly < 50 % of dry mass in Mauritia and Mauritiella and similar 265
between the two species in stem and root tissues, but it was more variable and slightly higher and 266
in leaf tissue. 267
Individual AGB varied across more than three orders of magnitude, from as little as 0.7 kg 268
to as much as 1231 kg. AGB generally increases with stem diameter when all species are 269
combined (Figure 1B), but within a species AGB is more strongly related to stem height (Figure 270
1C). Belowground root biomass contributed 13–780 kg in Mauritia and Mauritiella, representing 271
13–47 % of total plant dry mass. Mean leaf mass varied by over an order of magnitude between 272
species, ranging from 0.2 kg leaf-1 in Bactris to 14.2 kg leaf-1 in Oenocarpus (Table 2). 273
[Table 2] 274
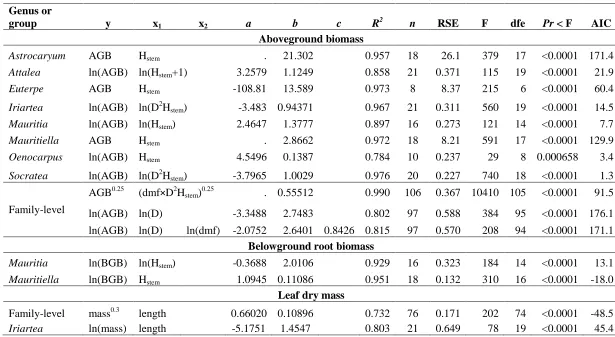
3.2 Species-level models
275
Single-species models performed well, with R2 > 0.90 for most species (Table 3, Figure 2). 276
Height was the key variable to estimate AGB, and including D added little to or even worsened 277
model performance. Models with Hstem alone were better than those with the compound variable
278
D2Hstem for most of species, and models with Htot alone were always better than those with D2Htot
279
(Table A.2). Models with only D were only significant for Euterpe, Iriartea, and Socratea. For 280
all other species, AGBcould not be estimated from D alone. The recommended models, one for 281
each species, are listed in Table 3. Other models, with different predictor variables, are available 282
in Table A.2. 283
[Table 3] 284
[Figure 2] 285
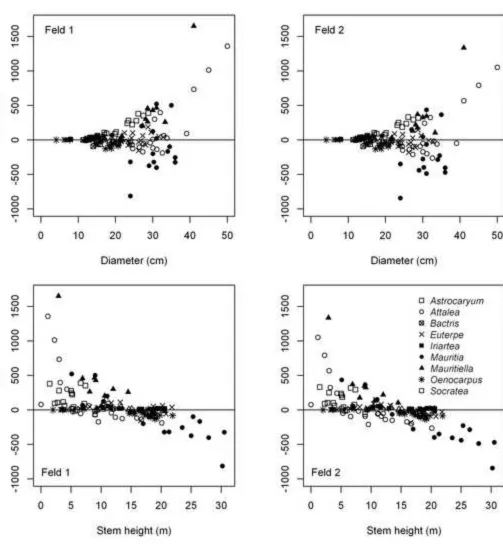
3.3 Family-level models
The transformed model with compound term dmfD2Hstem best estimated AGB of all species
287
(Table 3). This model was selected as best from the metrics used to evaluate built models (R2, 288
RSE, AIC; Table A.3) and performed well against the test data (Table A.4). Separating these 289
variables in a logarithmically-transformed additive model did not improve model performance. 290
One individual with no stem (Hstem = 0 m) had to be removed as an outlier; thus, these models are
291
only valid for individuals with Hstem ≥ 1 m.
292
The best family-level model (dmfD2Hstem) showed some differences between species, but
293
the glm analysis revealed that slope and intercept were only significantly different for only one 294
species each (Astrocaryum and Mauritia, respectively; P < 0.05). This model generally 295
underestimated AGB for Astrocaryum, Attalea, Mauritia, and Oenocarpus and overestimated 296
mass for Bactris, Euterpe, Iriartea, Mauritiella, and Socratea (Figure 3A). 297
To permit palm biomass estimation from inventories that have not measured Hstem, we
298
explored the use of other predictor variables. Visible trends were observed between AGB and D, 299
Htot, and D2Htot, but the relationships were subject to outliers or anomalies (Figure A.1). Thus,
300
we had to remove outliers, and the resulting equations are only valid within the given range 301
(Table 3). Models with just D, or D and dmf, performed reasonably well but are onlyvalid for 302
individuals with diameters between 6 and 40 cm and stem heights > 3 m. Prediction errors from 303
these models showed few differences between species, except that Mauritia was almost always 304
underestimated and Iriartea with D < 22 cm was usually overestimated (Figure 3B,C). The 305
compound variable D2Htot was especially prone to producing outliers when individuals have very
306
short stems with tall leaves or short stems with large diameters: three Attalea and one 307
Oenocarpus were identified as such, all of which had Hstem ≤ 3 m and Htot < 5 m. Models with
308
Htot had a tendency to overestimate AGB of shorter individuals and underestimate taller
309
individuals (data not shown). For both pairs, the models with dmf (D+dmf and Htot+dmf) were
310
significantly better than the model with D or Htot alone (P < 0.05). We also tested models with ρ
311
instead of dmf, but ρ was never significant. Likewise, models with a compound predictor variable 312
using ρ never performed as well as those with dmf (i.e., ρD2Hstemvs. dmfD2Hstem), so we do not
313
report models with ρ. 314
Leaf mass can be estimated from leaf length (Table 3). We present a mixed species model, 315
Iriartea leaves showed a very clear, and significantly different, relationship between leaf mass 317
and length, so we have reported separate results for this species (Figure A.2). 318
[Figure 3] 319
3.4 Model evaluation
320
Comparing model predictions to the subset of test data, the recommended family model 321
with the compound term dmfD2Hstem had the lowest bias (mean % error = 0.2 %), but another
322
model using the log-transformed compound variable with total height (dmfD2Htot) performed best
323
by all other criteria (Table A.4). All family-level models performed reasonably well, except the 324
models with Htot and Htot+dmf (Table A.4).
325
Testing model estimates against the full biomass dataset (n = 136), the species model 326
estimates were always best, followed by the family-level dmfD2Hstem model (Table A.5). The two
327
models without any height variable, D and D+dmf, and the two dicot models all overestimated 328
AGB and performed very poorly when applied to the full biomass dataset (-0.184 ≤ R2 ≤ 0.145). 329
However, when the dataset was reduced to only the individuals for which all models were valid 330
(Hstem > 3 m and 6 ≤ D < 40 cm; n = 125), results for the recommended species and family model
331
estimates changed little, but estimates from the palm and dicot models without measured height 332
improved substantially (0.548 ≤ R2 ≤ 0.615; Table A.5). The species-level and Feld 1 models 333
slightly overestimated AGB (mean % error = 3 and 6 %, respectively), the recommended family-334
level and Feld 2 models slightly underestimated AGB (mean % error = -5 and -7 %, 335
respectively), while the D and D+dmf model estimates were nearly neutral (mean % error = 0.6 336
and -0.03, respectively). By nearly all metrics, all palm models were better estimators of palm 337
AGB than the dicot models. 338
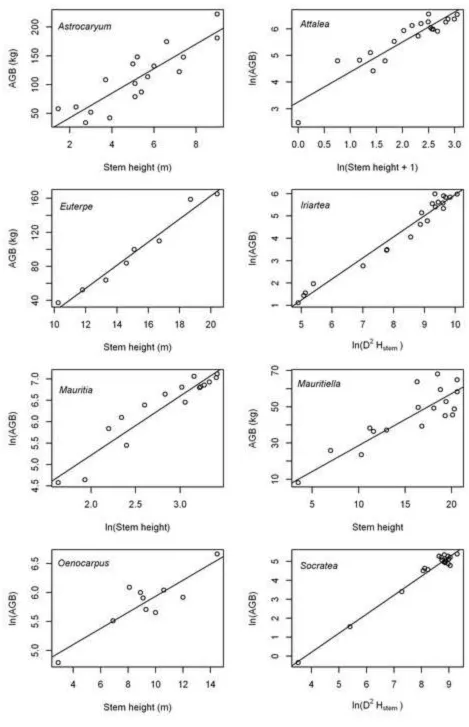
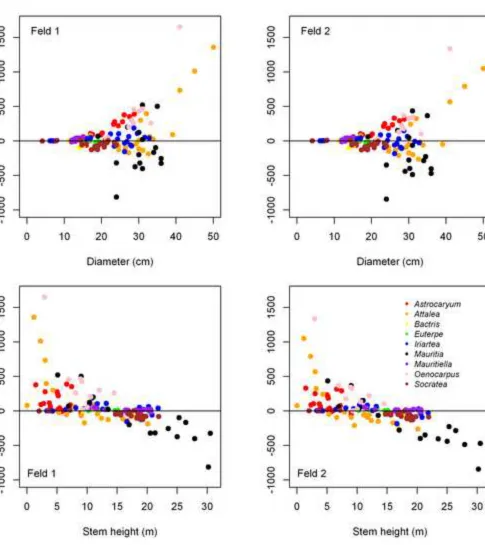
The dicot models were poor estimators of individual palm AGB, with errors ranging from 339
–844 to +1651 kg. Whether each one over- or underestimates palm mass was largely dependent 340
upon species, diameter, and stem height. The magnitude of errors increased considerably with 341
diameter, but the direction of errors was largely dependent on stem height (Figure 4). The dicot 342
models typically overestimated AGB of palms with short stems but underestimated AGB of 343
taller stemmed individuals. This crossover occurred at Hstemc. 14 and 15 m for the Feld 1 and 2
344
models, respectively. Prediction errors between species are consistent between the two dicot 345
models, but the Feld 2 model estimates were usually lower. Both dicot models tended to 346
underestimate AGB of Mauritia, Socratea, most palms with Hstem> 15 m, and all palms with
348
Hstem> 22 m.
349
[Figure 4] 350
3.5 Implications for forest biomass
351
Across the nine plots in Tambopata, palms represented between 3 and 32 % of all stems (D
352
≥ 10 cm) and, based on species-level equations, contributed from 5 to 43 Mg of above ground 353
biomass per hectare. The two dicot models yielded different AGB estimates, for both trees and 354
palms the Feld 2 (with estimated height) estimates were lower than the Feld 1 estimates (Table 355
4). Using estimates from the recommended species models (Table 3), palm AGB density in the 356
nine plots was on average 29 or 40 % greater than would have been estimated with the Feld 1 357
and 2 dicot models, respectively. However, plot means may be artificially large due to large 358
relative differences in two plots with very low palm presence (TAM05 and TAM07; Table 4). 359
Thus, if palm biomass on all plots is combined as one unit, the overall difference in palm mass 360
across all nine plots is 14 or 27 % greater than Feld 1 and 2 estimates, respectively. Total AGB 361
density estimates of the whole stand (i.e., dicot trees and palms combined) were between 1 and 2 362
% greater than the Feld models (Table 4). 363
Stand-level palm AGB estimated from the other three palm models was usually lower than 364
the species-level palm model estimates. Among the family-level equations, the model with D
365
only yielded the most similar results to the species-level estimates, followed by the dmfD2Hstem
366
model, but the D+dmf model produced much lower estimates. In some plots the family-level 367
models gave lower AGB estimates than did the dicot models, but across all plots palm AGB is 368
still higher than would have been estimating using dicot models (Table 4). 369
[Table 4] 370
4 Discussion
371
4.1 Architecture and intrinsic properties
372
Our data appear to have captured several different growth patterns of arborescent palms, as 373
demonstrated by the differing relationships between diameter, height, and AGB among species 374
(Figures 1 and A.1). These differing allometries have implications for the best single- and mixed-375
species biomass models. For example, Iriartea (Rich, 1987a), Socratea (Rich et al., 1986), and 376
Euterpe (Avalos and Fernandez Otarola, 2010) can continue to increase in diameter via sustained 377
three genera for which we were able to estimate AGB from D alone. For other genera, such as 379
Mauritiella, stem diameter is virtually the same at every height, so including D in allometric 380
equations adds little or no explanatory value.
381
Variable moisture content between species, between individuals of the same species, and 382
within a single stem make it difficult to determine the exact dry mass of palms. As with stem 383
density (Rich, 1987b), dry mass fraction tends to be greatest at the base and decreases along the 384
stem. Mean stem dmf may also increase with increasing stem height, as reported by Rich 385
(1987b), perhaps because cell walls thicken with age (Rich, 1987a; Tomlinson, 2006). 386
Nonetheless, our data show that using species mean dmf values works well. Using the test data, 387
the differences in dry mass estimates, when calculated from fresh mass and either species mean 388
dmf or dmf measured for each individual, are very small: the mean difference between the two 389
calculations was only 2.5 kg or 1.9 %. Therefore, we consider the results reported here to be 390
reliable and to represent an advance in improving palm biomass estimates. When utilising these 391
models, values for dmf can be found in Table 2. For the genera included in this study, we 392
recommend using mean stem dmf for the respective taxon and the overall mean (0.370) for all 393
other genera. 394
4.2 New models
395
As hypothesised, height was always a very important parameter to consider in palm 396
biomass equations. Total height was sometimes a better estimator than stem height. However, 397
total height is likely to be a less reliable measurement than stem height, as it can be subjective 398
and often difficult to measure if only one leaf is extending upwards. Thus, we recommended the 399
second best model for each of these species, which includes Hstem in all cases. Estimating palm
400
mass using compound variables (D2Hstemor D2Htot) was often not necessary for single-species
401
models but was best for family-level models because H–D relationships differed between 402
species. As expected, accounting for dry mass fraction also improved mixed-species model 403
estimates, and dmf was a better variable than ρ to account for internal species differences, 404
perhaps because of the difficulty of measuring palm ρ accurately. 405
There proved to be a reasonable relationship between these two variables when all species 406
were combined, and family-level models with D alone or D+dmf performed remarkably well 407
given the weak relationship of diameter with biomass at the species-level. These models 408
these models should be applied with caution, as estimates made outside the diameter and height 410
ranges used to build the models can be erroneous (Table A.5). We provide species- and family-411
level palm models with a variety of input data to accommodate existing inventories, and these 412
models could be used to create new palm biomass estimates from existing forest inventory data 413
(i.e., D and species). These estimates would be more accurate than estimates from dicot 414
equations, but estimates from palm models including height would be far more accurate (Tables 415
A.4, A.5). Likewise, because AGB could not usually be predicted from D within a single species, 416
it is likely that the relationship between AGB and D within an individual is also unreliable and, 417
therefore, that productivity of individual palm trees should preferably also be estimated from 418
models that include stem height or total height. 419
4.3 Implications for forest biomass
420
Contrary to our expectations, palm biomass estimates were greater in each of the nine plots 421
examined when applying our most reliable palm equations, compared to palm biomass estimated 422
from standard dicot models. Although palms do not have branches or relatively dense stems, they 423
often weigh more than dicot trees at small diameters because they can be much taller (Rich et al., 424
1986). As a result, AGB of many tall palms with small diameters can be underestimated by the 425
dicot models (Figure 4). Evaluating model estimates on our directly-measured biomass dataset 426
could not fully reflect this because the destructive dataset was designed to create reliable 427
regression models across a broad range of sizes, and, thus, includes a higher proportion of short 428
stemmed individuals than inventoried in mature forests in Tambopata (D≥ 10 cm). Mean Hstem of
429
palms in the forest plots (15.3 m) was slightly greater than in the biomass dataset (12.7 m) and 430
above the limit at which dicot models underestimate AGB of most palms (14–15 m). The effect 431
of using new palm biomass models will also likely be determined by the species composition and 432
the interaction between size and composition. In Tambopata, for example, Iriartea deltoidea
433
makes up 54% of all registered palms with D≥ 10 cm, followed by Euterpe precatoria (14 %), 434
Socratea exorrhiza (12 %), and Mauritia flexuosa (7 %). In the destructive biomass dataset, the 435
dicot models estimated AGB of Iriartea moderately well but consistently underestimated AGB 436
of Socratea and Mauritia (Figure 4). Thus, palm AGB estimates may be considerably higher 437
than previously estimated in stands where these species, especially Mauritia flexuosa, are 438
dominant. Conversely, new palm equations may slightly reduce AGB estimates, as compared to 439
as in central Amazonia (Emilio et al., 2013), or in stands where the palm population is dominated 441
by shorter individuals (Kahn and Mejia, 1990). 442
Our results show higher palm AGB density estimates in plots than would have been 443
estimated from dicot equations, but the magnitude of this increase depends on the palm equation 444
used to estimate AGB. When tested on the directly-measured biomass dataset, the species 445
models slightly overestimated AGB but the recommended family-level model (dmfD2Hstem;
446
Table 3) underestimated AGB by a greater amount. Likewise, the Tambopata plot estimates were 447
greater using the species-level models than this family model. Thus, the true ‘increase’ in palm 448
AGB is likely to be in between these estimates but closer to the species model estimates. The 449
overall differences (when all plots are combined) in palm AGB estimates between the two palm 450
estimates discussed above are similar. Thus, despite some sensitivity to the palm model used, 451
true palm AGB in Tambopata is greater than would have been estimated by dicot equations. 452
This dataset and new models do not, however, represent small palms, nor do they capture 453
the reproductive parts of mature individuals. Though stemless and juvenile palms can be 454
abundant in some ecosystems (Kahn and Mejia, 1990), they are not generally included in forest 455
inventories and contribute little to forest biomass (Nascimento and Laurance, 2002). We also 456
found that although palm leaves are large, they weigh little compared to the woody tissues. 457
Because no individuals in the biomass dataset were fruiting at the time of harvest, these estimates 458
do not accurately account for reproductive parts. 459
These new palm biomass equations should have multiple applications and facilitate more 460
accurate estimates of carbon stocks and cycling in tropical forests. Though increases in whole 461
forest estimates are locally small (0.9–1.8 % at Tambopata), this increase could be expected to 462
impact total carbon stock estimates in tropical forests more broadly, particularly in forests with 463
hydromorphic soils. These models may also finally assist accurate quantification of above- and 464
belowground carbon stocks of the palm community in the extensive, carbon-rich peat ecosystems 465
which cover c. 150,000 km2 in Amazonia (Lahteenoja et al., 2009). 466
These new equations can also be used to improve palm productivity estimates. Palm stem 467
productivity may also be greater than previously estimated by dicot models using diameter ―as 468
commonly measured in permanent plot inventories― because palms grow in height with little or 469
no corresponding increase in stem diameter (Rich et al., 1986). Estimating leaf mass by either the 470
usually ignored due to the technical difficulties of sampling palm leaf fall (Chave et al., 2010). 472
Though other structures, such as inflorescences, bracts, and fruits, can contribute substantially to 473
forest productivity (Phillips, 1993), they still remain poorly quantified or ignored in 474
comprehensive studies (Chave et al., 2010; Malhi et al., in press). These ‘missing terms’ in forest 475
productivity estimates (Malhi et al., 2009) need to be incorporated, particularly as they can be 476
expected to vary substantially in space and time. For example, because palms are more abundant 477
in the western Amazon (Kahn et al., 1988; Terborgh and Andresen, 1998; Eiserhardt et al., 478
2011), it is possible that the magnitude of increase in aboveground forest productivity from east 479
to west across Amazonia may be even greater than previously considered (Malhi et al., 2004; 480
Aragão et al., 2009; Quesada et al., 2012). 481
5 Conclusions and future directions
482
This study is the first to create a comprehensive dataset of arborescent palms and family-483
level allometric equations to estimate aboveground biomass. We report both single- and mixed-484
species models with a variety of input variables to accommodate different forest inventory 485
methods. Single species models estimated palm biomass very well, as does the recommended 486
family-level model with dmfD2Hstem. The family-level models without a height variable provide
487
unbiased estimates of palm AGB, but should be applied with caution. With these new models, 488
we can finally estimate palm biomass and productivity more reliably. When equations were 489
applied to forest plots at one location in western Amazonia, palm biomass density was on 490
average 14 or 27 % greater than would have been estimated using two pantropical biomass 491
models for dicot trees. In other forests, the effect of new palm equations on plot biomass 492
estimates will depend on palm sizes, abundance, and species composition. The magnitude of 493
palm productivity and carbon cycling fluxes will also likely be greater than previously estimated 494
by dicot models, but the magnitude of this effect has yet to be formally explored. We recommend 495
that palm stem height should be measured in future inventories to accurately estimate palm 496
biomass and, especially, biomass changes in this important forest component. 497
6 Acknowledgements
498
This project was financially supported by School of Geography at University of Leeds, 499
World Wildlife Fund (WWF)–Peru, and by Moore Foundation and US Forest Service grants to 500
of the Amazon Forest Inventory Network (RAINFOR). In-kind support has been provided by 501
Maldonado. We thank Gabriela Lopez-Gonzalez for providing plot inventory data from 503
RAINFOR and ForestPlots.net. For their logistical support during field work, we thank Nelson 504
Gutierrez, Juan Carlos Riveros, and Cecilia Alvarez at WWF–Peru and Ronald Corvera at IIAP 505
in Puerto Maldonado. We extend specials thanks to Cesar Vela, Sebastian Tapia, Erasmo 506
Otárola, Carlos Linares, Percy Martínez, Gustavo Adolfo, Joel Millward-Hopkins, Amador 507
Pfuro, and all the field assistants for their hard work during the field campaign. RCG was 508
supported by the Fully-funded International Research Scholarship from University of Leeds 509
during the research. OLP is supported by an Advanced Grant from the European Research 510
Council and a Royal Society Wolfson Research Merit Award. All fieldwork was conducted with 511
permits from the Dirección General Forestal y de Fauna Silvestre within the Peruvian Ministry of 512
Agriculture. 513
7 References
514
Alvarez, E., Duque, A., Saldarriaga, J., Cabrera, K., de las Salas, G., del Valle, I., Lema, A., 515
Moreno, F., Orrego, S., Rodríguez, L., 2012. Tree above-ground biomass allometries for carbon 516
stocks estimation in the natural forests of Colombia. For. Ecol. Manage. 267, 297-308. 517
Aragão, L.E.O.C., Malhi, Y., Metcalfe, D.B., Silva-Espejo, J.E., Jimenez, E., Navarrete, D., 518
Almeida, S., Costa, A.C.L., Salinas, N., Phillips, O.L., Anderson, L.O., Alvarez, E., Baker, T.R., 519
Goncalvez, P.H., Huaman-Ovalle, J., Mamani-Solorzano, M., Meir, P., Monteagudo, A., Patino, 520
S., Penuela, M.C., Prieto, A., Quesada, C.A., Rozas-Davila, A., Rudas, A., Silva, J.A., Vasquez, 521
R., 2009. Above- and below-ground net primary productivity across ten Amazonian forests on 522
contrasting soils. Biogeosciences 6, 2759-2778. 523
Avalos, G., Fernandez Otarola, M., 2010. Allometry and stilt root structure of the neotropical 524
palm Euterpe precatoria (Arecaceae) across sites and successional stages. Am. J. Bot. 97, 388-525
394. 526
Baccini, A., Goetz, S.J., Walker, W.S., Laporte, N.T., Sun, M., Sulla-Menashe, D., Hackler, J., 527
Beck, P.S.A., Dubayah, R., Friedl, M.A., Samanta, S., Houghton, R.A., 2012. Estimated carbon 528
dioxide emissions from tropical deforestation improved by carbon-density maps. Nat. Clim. 529
Change 2, 182-185. 530
Baker, T.R., Phillips, O.L., Malhi, Y., Almeida, S., Arroyo, L., Di Fiore, A., Erwin, T., Killeen, 531
Patino, S., Pitman, N.C.A., Silva, J.N.M., Martinez, R.V., 2004. Variation in wood density 533
determines spatial patterns in Amazonian forest biomass. Global Change Biol. 10, 545-562. 534
Baskerville, G.L., 1972. Use of logarithmic regression in the estimation of plant biomass. Can. J. 535
For. Res./Rev. Can. Rech. For. 2, 49-53. 536
Basuki, T.M., van Laake, P.E., Skidmore, A.K., Hussin, Y.A., 2009. Allometric equations for 537
estimating the above-ground biomass in tropical lowland Dipterocarp forests. For. Ecol. Manage. 538
257, 1684-1694. 539
Bremer, K., Friis, E.M., Bremer, B., 2004. Molecular phylogenetic dating of asterid flowering 540
plants shows early Cretaceous diversification. Syst. Biol. 53, 496-505. 541
Brown, S., 1997. Estimating Biomass and Biomass Change of Tropical Forests: a Primer In. 542
Food and Agriculture Organization of the United Nations, p. 55. 543
Brown, S., Delaney, M., Shoch, D., 2001. Carbon monitoring, analysis, and status report for the 544
Rio Bravo Carbon Sequestration Pilot Project. In, Report to the Programme for Belize. Report to 545
the Programme for Belize, Winrock International, Arlington, VA, USA. 546
Brown, S., Gillespie, A.J.R., Lugo, A.E., 1989. Biomass estimation methods for tropical forests 547
with applications to forest inventory data For. Sci. 35, 881-902. 548
Chave, J., Andalo, C., Brown, S., Cairns, M.A., Chambers, J.Q., Eamus, D., Folster, H., 549
Fromard, F., Higuchi, N., Kira, T., Lescure, J.P., Nelson, B.W., Ogawa, H., Puig, H., Riera, B., 550
Yamakura, T., 2005. Tree allometry and improved estimation of carbon stocks and balance in 551
tropical forests. Oecologia 145, 87-99. 552
Chave, J., Coomes, D., Jansen, S., Lewis, S.L., Swenson, N.G., Zanne, A.E., 2009. Towards a 553
worldwide wood economics spectrum. Ecol. Lett. 12, 351-366. 554
Chave, J., Navarrete, D., Almeida, S., Alvarez, E., Aragao, L.E.O.C., Bonal, D., Chatelet, P., 555
Silva-Espejo, J.E., Goret, J.Y., von Hildebrand, P., Jimenez, E., Patino, S., Penuela, M.C., 556
Phillips, O.L., Stevenson, P., Malhi, Y., 2010. Regional and seasonal patterns of litterfall in 557
tropical South America. Biogeosciences 7, 43-55. 558
Delaney, M., Brown, S., Powell, M., 1999. Carbon-Offset Report for the Noel Kempff Climate 559
Action Project, Bolivia. In. Report to The Nature Conservancy, Winrock International, 560
Eiserhardt, W.L., Svenning, J.-C., Kissling, W.D., Balslev, H., 2011. Geographical ecology of 562
the palms (Arecaceae): determinants of diversity and distributions across spatial scales. Ann. 563
Bot. 108, 1391-1416. 564
Emilio, T., Quesada, C.A., Costa, F.R.C., Magnusson, W.E., Schietti, J., Feldpausch, T.R., 565
Brienen, R.J.W., Baker, T.R., Chave, J., Álvarez, E., Araújo, A., Bánki, O., Castilho, C.V., 566
Honorio C, E.N., Killeen, T.J., Malhi, Y., Oblitas Mendoza, E.M., Monteagudo, A., Neill, D., 567
Alexander Parada, G., Peña-Cruz, A., Ramirez-Angulo, H., Schwarz, M., Silveira, M., ter 568
Steege, H., Terborgh, J.W., Thomas, R., Torres-Lezama, A., Vilanova, E., Phillips, O.L., 2013. 569
Soil physical conditions limit palm and tree basal area in Amazonian forests. Plant Ecol. Div., 1-570
15. 571
Feldpausch, T.R., Lloyd, J., Lewis, S.L., Brienen, R.J.W., Gloor, M., Monteagudo Mendoza, A., 572
Lopez-Gonzalez, G., Banin, L., Abu Salim, K., Affum-Baffoe, K., Alexiades, M., Almeida, S., 573
Amaral, I., Andrade, A., Aragao, L.E.O.C., Araujo Murakami, A., Arets, E.J.M.M., Arroyo, L., 574
Aymard, G.A., Baker, T.R., Banki, O.S., Berry, N.J., Cardozo, N., Chave, J., Comiskey, J.A., 575
Alvarez, E., de Oliveira, A., Di Fiore, A., Djagbletey, G., Domingues, T.F., Erwin, T.L., 576
Fearnside, P.M., Franca, M.B., Freitas, M.A., Higuchi, N., Honorio, E., Iida, Y., Jimenez, E., 577
Kassim, A.R., Killeen, T.J., Laurance, W.F., Lovett, J.C., Malhi, Y., Marimon, B.S., Marimon-578
Junior, B.H., Lenza, E., Marshall, A.R., Mendoza, C., Metcalfe, D.J., Mitchard, E.T.A., Neill, 579
D.A., Nelson, B.W., Nilus, R., Nogueira, E.M., Parada, A., Peh, K.S.H., Pena Cruz, A., Penuela, 580
M.C., Pitman, N.C.A., Prieto, A., Quesada, C.A., Ramirez, F., Ramirez-Angulo, H., Reitsma, 581
J.M., Rudas, A., Saiz, G., Salomao, R.P., Schwarz, M., Silva, N., Silva-Espejo, J.E., Silveira, M., 582
Sonke, B., Stropp, J., Taedoumg, H.E., Tan, S., ter Steege, H., Terborgh, J., Torello-Raventos, 583
M., van der Heijden, G.M.F., Vasquez, R., Vilanova, E., Vos, V.A., White, L., Willcock, S., 584
Woell, H., Phillips, O.L., 2012. Tree height integrated into pantropical forest biomass estimates. 585
Biogeosciences 9, 3381-3403. 586
Frangi, J.L., Lugo, A.E., 1985. Ecosystem dynamics of a sub-tropical floodplain forest. Ecol. 587
Monogr. 55, 351-369. 588
Freitas, L., Otárola, E., del Castillo Torres, D., Linares, C., Martínez, C., Malca, G.A., 2006. 589
Servicios Ambientales de Carbono y Secuestro de Carbono de Ecosistema Aguajal en la Reserva 590
Nacional Pacaya Samiria, Loreto - Perú In. Instituto de Investigaciones de la Amazonía Peruana 591
Gallardo-Ordinola, J.L.E., Luizão, F.J., Fernandes, E.C., Wandelli, E., Afonso Meira, R., 2001. 593
Root carbon and nutrient stocks in central Amazonian abandoned pastures and agroforestry 594
systems. In. INPA-Ecology, Cornell University and EMBRAPA-CPAA. 595
Goodman, R.C., Phillips, O.L., Baker, T.R., in press. The importance of crown dimensions to 596
improve tropical tree biomass estimates. Ecol. Appl. 597
Govaerts, R., Dransfield, J., 2005. World checklist of palms. Royal Botanic Gardens, Kew, 598
Richmond, UK. 599
Hughes, R.F., 1997. Effects of deforestation and land use on biomass, carbon, and nutrient pools 600
in the Los Tuxtlas Region, Mexico. In, Department of Forest Science. Oregon State University, 601
Corvallis, Oregon, p. 105. 602
Johnson, D. (Ed.), 1996. Palms: Their Conservation And Sustained Utilization. IUCN, World 603
Conservation Union, Gland, Switzerland. 604
Kahn, F., 1991. Palms as key swamp forest resources in Amazonia. For. Ecol. Manage. 38, 133-605
142. 606
Kahn, F., Mejia, K., 1990. Palm communities in wetland forest ecosystems of Peruvian 607
Amazonia. For. Ecol. Manage. 33-4, 169-179. 608
Kahn, F., Mejia, K., Decastro, A., 1988. Species richness and density of palms in terra firme 609
forests of Amazonia. Biotropica 20, 266-269. 610
Kumar, B.M., 2011. Species richness and aboveground carbon stocks in the homegardens of 611
central Kerala, India. Agric. Ecosyst. Environ. 140, 430-440. 612
LaFrankie, J.V., Saw, L.G., 2005. The understorey palm Licuala (Arecaceae) suppresses tree 613
regeneration in a lowland forest in Asia. J. Trop. Ecol. 21, 703-706. 614
Lahteenoja, O., Ruokolainen, K., Schulman, L., Oinonen, M., 2009. Amazonian peatlands: an 615
ignored C sink and potential source. Global Change Biol. 15, 2311-2320. 616
Lewis, S.L., Phillips, O.L., Baker, T.R., Lloyd, J., Malhi, Y., Almeida, S., Higuchi, N., Laurance, 617
W.F., Neill, D.A., Silva, J.N.M., Terborgh, J., Lezama, A.T., Vásquez Martinez, R., Brown, S., 618
Chave, J., Kuebler, C., Núñez Vargas, P., Vinceti, B., 2004. Concerted changes in tropical forest 619
structure and dynamics: evidence from 50 South American long-term plots. Philos. Trans. R. 620
Soc. Lond., Ser. B: Biol. Sci. 359, 421-436. 621
Lopez-Gonzalez, G., Lewis, S.L., Burkitt, M., Baker, T.R., Phillips, O.L., 2012. 622
Lopez-Gonzalez, G., Lewis, S.L., Burkitt, M., Phillips, O.L., 2011. ForestPlots.net: a web 624
application and research tool to manage and analyse tropical forest plot data. J. Veg. Sci. 22, 625
610-613. 626
Malhi, Y., Aragao, L., Metcalfe, D.B., Paiva, R., Quesada, C.A., Almeida, S., Anderson, L., 627
Brando, P., Chambers, J.Q., da Costa, A.C.L., Hutyra, L.R., Oliveira, P., Patino, S., Pyle, E.H., 628
Robertson, A.L., Teixeira, L.M., 2009. Comprehensive assessment of carbon productivity, 629
allocation and storage in three Amazonian forests. Global Change Biol. 15, 1255-1274. 630
Malhi, Y., Baker, T.R., Phillips, O.L., Almeida, S., Alvarez, E., Arroyo, L., Chave, J., Czimczik, 631
C.I., Di Fiore, A., Higuchi, N., Killeen, T.J., Laurance, S.G., Laurance, W.F., Lewis, S.L., 632
Montoya, L.M.M., Monteagudo, A., Neill, D.A., Vargas, P.N., Patino, S., Pitman, N.C.A., 633
Quesada, C.A., Salomao, R., Silva, J.N.M., Lezama, A.T., Martinez, R.V., Terborgh, J., Vinceti, 634
B., Lloyd, J., 2004. The above-ground coarse wood productivity of 104 Neotropical forest plots. 635
Global Change Biol. 10, 563-591. 636
Malhi, Y., Farfán Amézquita, F., Doughty, C.E., Silva-Espejo, J.E., Girardin, C.A.J., Metcalfe, 637
D.B., Aragão, L.E.O.C., Huaraca-Quispe, L.P., Alzamora-Taype, I., Eguiluz-Mora, L., 638
Marthews, T.R., Halladay, K., Quesada, C.A., Robertson, A.L., Fisher, J.B., Zaragoza-Castells, 639
J., Rojas-Villagra, C.M., Pelaez-Tapia, Y., Salinas, N., Meir, P., Phillips, O.L., in press. The 640
productivity, metabolism and carbon cycle of two lowland tropical forest plots in SW Amazonia, 641
Peru. Plant Ecol. Div. 642
Malhi, Y., Phillips, O.L., Lloyd, J., Baker, T., Wright, J., Almeida, S., Arroyo, L., Frederiksen, 643
T., Grace, J., Higuchi, N., Killeen, T., Laurance, W.F., Leano, C., Lewis, S., Meir, P., 644
Monteagudo, A., Neill, D., Vargas, P.N., Panfil, S.N., Patino, S., Pitman, N., Quesada, C.A., 645
Rudas-Ll, A., Salomao, R., Saleska, S., Silva, N., Silveira, M., Sombroek, W.G., Valencia, R., 646
Martinez, R.V., Vieira, I.C.G., Vinceti, B., 2002. An international network to monitor the 647
structure, composition and dynamics of Amazonian forests (RAINFOR). J. Veg. Sci. 13, 439-648
450. 649
May, P.H., Anderson, A.B., Balick, M.J., Frazao, J.M.F., 1985. Subsistence benefits from the 650
Babassu palm (Orbignya martiana). Econ. Bot. 39, 113-129. 651
Montufar, R., Pintaud, J.-C., 2006. Variation in species composition, abundance and 652
microhabitat preferences among western Amazonian terra firme palm communities. Bot. J. Linn. 653
Nascimento, H.E.M., Laurance, W.F., 2002. Total aboveground biomass in central Amazonian 655
rainforests: a landscape-scale study. For. Ecol. Manage. 168, 311-321. 656
Parthasarathy, M.V., Klotz, L.H., 1976. Palm "wood" .1. Anatomical aspects. Wood Sci. 657
Technol. 10, 215-229. 658
Peters, C.M., Balick, M.J., Kahn, F., Anderson, A.B., 1989. Oligarchic forests of economic 659
plants in Amazonia - utilization and conservation of an important tropical resource. Conserv. 660
Biol. 3, 341-349. 661
Peters, H.A., Pauw, A., Silman, M.R., Terborgh, J.W., 2004. Failing palm fronds structure 662
Amazonian rainforest sapling communities. Proc. R. Soc. Lond., Ser. B: Biol. Sci. 271, S367-663
S369. 664
Phillips, O., 1993. The potential for harvesting fruits in tropical rainforests: new data from 665
Amazonian Peru. Biodivers. Conserv. 2, 18-38. 666
Phillips, O., Gentry, A., 1993. The useful plants of Tambopata, Peru: I. Statistical hypotheses 667
tests with a new quantitative technique. Econ. Bot. 47, 15-32. 668
Phillips, O., Higuchi, N., Vieira, S., Baker, T.R., Chao, K.J., Lewis, S.L., 2008. Changes in 669
Amazonian Forest Biomass, Dynamics, and Composition, 1980–2002. Geoph. Monog. Series 670
186, 373-387. 671
Quesada, C.A., Phillips, O.L., Schwarz, M., Czimczik, C.I., Baker, T.R., Patino, S., Fyllas, N.M., 672
Hodnett, M.G., Herrera, R., Almeida, S., Alvarez Davila, E., Arneth, A., Arroyo, L., Chao, K.J., 673
Dezzeo, N., Erwin, T., di Fiore, A., Higuchi, N., Honorio Coronado, E., Jimenez, E.M., Killeen, 674
T., Lezama, A.T., Lloyd, G., Lopez-Gonzalez, G., Luizao, F.J., Malhi, Y., Monteagudo, A., 675
Neill, D.A., Nunez Vargas, P., Paiva, R., Peacock, J., Penuela, M.C., Pena Cruz, A., Pitman, N., 676
Priante Filho, N., Prieto, A., Ramirez, H., Rudas, A., Salomao, R., Santos, A.J.B., Schmerler, J., 677
Silva, N., Silveira, M., Vasquez, R., Vieira, I., Terborgh, J., Lloyd, J., 2012. Basin-wide 678
variations in Amazon forest structure and function are mediated by both soils and climate. 679
Biogeosciences 9, 2203-2246. 680
Renninger, H.J., Phillips, N., 2012. "Secondary stem lengthening" in the palm Iriartea deltoidea 681
(Arecaceae) provides an efficient and novel method for height growth in a tree form. Am. J. Bot. 682
99, 607-613. 683
Rich, P.M., 1987a. Developmental anatomy of the stem of Welfia georgii, Iriartea gigantea, and 684
Rich, P.M., 1987b. Mechanical structure of the stem of arborescent palms. Botanical Gazette 686
148, 42-50. 687
Rich, P.M., Helenurm, K., Kearns, D., Morse, S.R., Palmer, M.W., Short, L., 1986. Height and 688
stem diameter relationships for dicotyledonous trees and arborescent palms of Costa Rican 689
tropical wet forest. Bulletin of the Torrey Botanical Club 113, 241-246. 690
Roucoux, K.H., Lawson, I.T., Jones, T.D., Baker, T.R., Coronado, E.N.H., Gosling, W.D., 691
Lähteenoja, O., 2013. Vegetation development in an Amazonian peatland. Palaeogeogr., 692
Palaeoclimatol., Palaeoecol. 374, 242-255. 693
Runk, J.V., 1998. Productivity and sustainability of a vegetable ivory palm (Phytelephas 694
aequatorialis, Arecaceae) under three management regimes in northwestern Ecuador. Econ. Bot. 695
52, 168-182. 696
Segura-Madrigal, M.A., 1997. Almacenamiento y fijación de carbono en Quercus costaricensis, 697
en un bosque de altura en la Cordillera de Talamanca, Costa Rica. In, Escuela Ciencias 698
Ambientales, Facultad de Ciencias de la Tierra y el Mar. Heredia, Universidad Nacional, CR, p. 699
147. 700
Sierra, C.A., del Valle, J.I., Orrego, S.A., Moreno, F.H., Harmon, M.E., Zapata, M., Colorado, 701
G.J., Herrera, M.A., Lara, W., Restrepo, D.E., Berrouet, L.M., Loaiza, L.M., Benjumea, J.F., 702
2007. Total carbon stocks in a tropical forest landscape of the Porce region, Colombia. For. Ecol. 703
Manage. 243, 299-309. 704
Terborgh, J., Andresen, E., 1998. The composition of Amazonian forests: patterns at local and 705
regional scales. J. Trop. Ecol. 14, 645-664. 706
Thenkabail, P.S., Stucky, N., Griscom, B.W., Ashton, M.S., Diels, J., Van der Meer, B., Enclona, 707
E., 2004. Biomass estimations and carbon stock calculations in the oil palm plantations of 708
African derived savannas using IKONOS data. Int. J. Remote Sens. 25, 5447-5472. 709
Tomlinson, P.B., 2006. The uniqueness of palms. Bot. J. Linn. Soc. 151, 5-14. 710
West, G.B., Brown, J.H., Enquist, B.J., 1997. A general model for the origin of allometric 711
scaling laws in biology. Science 276, 122-126. 712
Williamson, G.B., Wiemann, M.C., 2010. Measuring Wood Specific Gravity ... Correctly. Am. J. 713
Bot. 97, 519-524. 714
Zambrana, N.Y.P., Byg, A., Svenning, J.-C., Moraes, M., Grandez, C., Balslev, H., 2007. 715
Zanne, A.E., Lopez-Gonzalez, G., Coomes, D.A., Ilic, J., Jansen, S., Lewis, S.L., Miller, R.B., 717
Swenson, N.G., Wiemann, M.C., Chave, J., 2009. Global wood density database. In. Dryad 718
Digital Repository. 719
720
Tables
722
Table 1. Directly measured biomass data analysed in this study from Madre de Dios (MdD) and 723
Loreto, Peru: number of individuals (n), diameter at 1.3 m or above roots (D), stem height 724
(Hstem), and total height (Htot). 725
Location Species n
D
(cm)
Hstem
(m)
Htot
(m) MdD Astrocaryum murumuru 19 15-29 1.5-9.0 7.1-14.7 MdD Attalea phalerata 21 17-50 0-20.1 7.1-25.6 MdD Bactris gasipaes 3 11-15 9.3-18.1 13.0-20.8 MdD Euterpe precatoria 8 12-19 10.2-20.4 13.3-22.8 MdD Iriartea deltoidea 21 6-33 3.3-21.8 5.6-25.1
Loreto Mauritia flexuosa 16 19-36 5.1-30.5 9.1-38.4
Loreto Mauritiella aculeata 18 8-15 3.5-20.6 5.3-26.1
MdD Oenocarpus bataua 10 21-41 2.9-14.5 14.2-25.9 MdD Socratea exorrhiza 20 4-24 2.0-21.9 3.2-23.9
Total 9 species 136 4-50 0-30.5 3.2-28.4
Table 2. Dry mass fraction (dry mass / fresh mass) and carbon fraction (dry masscarbon / dry 727
masstotal) in stem, leaf, and root tissue, and mean and standard deviation of individual leaf dry 728
mass of the nine species sampled. 729
Species Stem Leaf Root Leaf dry mass (kg)
Dry mass fraction mean SD
Astrocaryum murumuru 0.400 2.687 1.057 Attalea phalerata 0.357 2.649 0.938 Bactris gasipaes 0.619 0.471 0.132 Euterpe precatoria 0.398 0.620 0.269 Iriartea deltoidea 0.244 4.065 3.787 Oenocarpus bataua 0.338 9.315 1.683 Socratea exorrhiza 0.339 1.764 1.629
mixed species (above) 0.463
Mauritia flexuosa 0.367 0.517 0.402 11.444 5.845 Mauritiella aculeata 0.269 0.320 0.297 0.951 0.447
mean 0.370 0.433 0.350 3.774 1.754
Carbon fraction Mauritia flexuosa 0.481 0.494 0.491 Mauritiella aculeata 0.480 0.529 0.485
Table 3. Recommended models for each genus and mixed-species to estimate aboveground biomass (AGB; kg dry mass) or 730
belowground root biomass (BGB; kg dry mass) from stem height (Hstem; m), diameter (D; cm), and dry mass fraction (dmf; g g-1), and
731
leaf dry mass (kg) from mean leaf length (m). All models follow the form y = a + bx1 + cx2. The family-level model with dmfD2Hstem
732
is only valid for individuals with Hstem ≥ 1 m; and the family-level models without a height term are only valid for individuals with
733
Hstem > 3 m and 6 ≤ D < 40 cm.
734
Genus or
group y x1 x2 a b c R2 n RSE F dfe Pr < F AIC
Aboveground biomass
Astrocaryum AGB Hstem . 21.302 0.957 18 26.1 379 17 <0.0001 171.4
Attalea ln(AGB) ln(Hstem+1) 3.2579 1.1249 0.858 21 0.371 115 19 <0.0001 21.9
Euterpe AGB Hstem -108.81 13.589 0.973 8 8.37 215 6 <0.0001 60.4
Iriartea ln(AGB) ln(D2Hstem) -3.483 0.94371 0.967 21 0.311 560 19 <0.0001 14.5
Mauritia ln(AGB) ln(Hstem) 2.4647 1.3777 0.897 16 0.273 121 14 <0.0001 7.7 Mauritiella AGB Hstem . 2.8662 0.972 18 8.21 591 17 <0.0001 129.9
Oenocarpus ln(AGB) Hstem 4.5496 0.1387 0.784 10 0.237 29 8 0.000658 3.4
Socratea ln(AGB) ln(D2Hstem) -3.7965 1.0029 0.976 20 0.227 740 18 <0.0001 1.3
Family-level
AGB0.25 (dmf×D2Hstem)0.25 . 0.55512 0.990 106 0.367 10410 105 <0.0001 91.5
ln(AGB) ln(D) -3.3488 2.7483 0.802 97 0.588 384 95 <0.0001 176.1
ln(AGB) ln(D) ln(dmf) -2.0752 2.6401 0.8426 0.815 97 0.570 208 94 <0.0001 171.1
Belowground root biomass
Mauritia ln(BGB) ln(Hstem) -0.3688 2.0106 0.929 16 0.323 184 14 <0.0001 13.1
Mauritiella ln(BGB) Hstem 1.0945 0.11086 0.951 18 0.132 310 16 <0.0001 -18.0
Leaf dry mass
Family-level mass0.3 length 0.66020 0.10896 0.732 76 0.171 202 74 <0.0001 -48.5
Table 4. Palm and dicot tree aboveground biomass density estimates for nine RAINFOR plots in Tambopata National Reserve, Peru. 736
Estimates were made using two recent pantropical dicot models (Feldpausch et al., 2012) based on diameter and wood density (F 1) or 737
diameter, wood density, and estimated height (F 2); three family-level palm equations (D, D+dmf, and dmfD2Hstem; Table 3); and the
738
recommended species-level model for each species or genera (Table 3). Percent differences are shown for each palm model compared 739
to each dicot model. Results are summarised as mean of all plots, sum of all plots, and overall percent difference. 740