f ... ' /
documentation bulletin
COMMUNITY -
THIRD WO,RLD :
THE CHALLENGE OF INTERDEPEND.ENCE
Second edition
liBRARY
~
. / ] SPECIAL EDITIO.N
0
.. ·
r-t
.
4.)
FORKLARENDE 8EMJERKNINGER Dokumentationsbulletinen omfatter fire udgave:
- A-udgaven: ugentlig bulletin indeholdende resumeer af rets-akter, meddelelser og dokumenter fra institutionerne samt af tidsskriftartikler. De tekster, der udvrelges og gennemgas af Centraltjenesten for Arkiver og DokumE'ntation ·- (SCAD-IX/C/1) - vedrorer institutionernes virksomhed og aile hertil knyttede omrader.
Europa-Parlamentets dokumentationstjeneste yder sit bidrag til afsnittet med udvalgte artikler.
- 8-udgaven: oplysningsbulletin, der ikke udkommer regelmres· sigt, og som indeholder bibliografiske henvisninger vedrorende et bestemt emne. Hvert nyt nummer annullerer det foregaende. - C-udgaven: sammenfattende oversigt, der ikke udkommer regel· mressigt. Hvert nummer behandler en rubrik i klassifikationen og citerer de henvisninger, der er nrevnt i A·udgaven siden den sidste oversigt om samme emne.
- 0-udgaven: Bulletin reserveret for tidsskrifter der oplyser om De europreiske Frellesskabers aktiviteter.
Henvisningerne i A·udgaven og C-udgaven er angivet pa folgende made:
a) overst til venstre:
b) i selve teksten:
c) ned erst til venstre:
d) nederst til hojre: (eventuelt)
lobenummer:
A (Frellesskabets retsakter osv.) B (udvalgte artikler) bibliografisk beskrivelse klassifikationsangivelse SCAD-mikrofilmnummer eller Publikationskontorets katalognummer eller forkortelsen PE (Europa-Parlamentet)
((ortscettes pd omslagets 3. side)
HINWEIS
Das Dokumentationsbulletin besteht aus vier Ausgaben: - Ausgabe A: Wochentliches Referateblatt. Verweist auf
Rechts-akten, Mitteilungen und Dokumente der Gemeinschaften, sowie auf Zeitschriftenartikel. Die vom Zentraldienst Archiv- Doku-mentation - (SCAD-IX/C/1) ausgewerteten Texte betreffen die Tatigkeit der Institutionen und Organe der Gemeinschaften sowie die mit dieser Tatigkeit zusammenhangenden Gebiete. Die Zeitschriftenartikel werden unter Mitwirkung der Abteilung Dokumentation des Europaischen Parlaments ausgewahlt. - Ausgabe 8: Unregelmassig. Auswahlbibliographie (zu bestimm·
ten Sachbereichen). Jede Neuauflage ersetzt die vorherige Ausgabe.
- Ausgabe C: Unregelmassig. Kumulierende Bibliographie. Nach je einem Sachgebiet der Ausgabe A geordnete Sammlung. Enthalt die in einem bestimmten Zeitraum veroffentlichten Texte.
- Ausgabe 0: VerOffentlichungen tiber die Tatigkeit der Europa-ischen Gemeinschaften vorbehalten.
Die bibliographischen Referenzen (Ausgaben A und C) sind wie folgt angegeben:
a) oben links:
b) Mitte:
c) unten links:
d) unten rechts: (ggf)
laufende Nummer:
A (Dokumente der Gemeinschaften usw.) B (ausgewahlte Zeitschriftenartikel) Bibliographische Beschreibung Klassifikationsziffer
Mikrofilm-Nummer (SCAD), oder Katalognum· mer (Amt fur Amtliche Veroffentlichungen), oder Abkiirzung PE (Europaisches Parlament)
(Fortsetzung Umschlagseite 3)
EXPLANATORY NOTE The Documentation Bulletin consists of four series.
Series A: Weekly analytical bulletin listing acts and documents of the institutions as well as articloi!s from periodicals. The texts which have been selected and analysed by the Central Archives and Documentation Service (SCAD-IX/C/1) concern the institutions' activities and all related fields.
The documentation service of the European Parliament con-tributes to the selection of articles from periodicals. Series 8: Descriptive bulletin. Irregular. Contains bibliographical
references on a specified subject. Each new updating cancels the previous one.
Series C: Cumulative list. Irregular. Each number is devoted to a single subject of the classification scheme and lists the references mentioned in series A since the publication of the previous cumulative list on the same subject.
Series 0: Bulletin mentioning periodicals containing information on the activities of the European Communities.
The actual presentation of references in series A and C is as follows: (a)top left-hand corner: serial number
NOTE EXPLICATIVE
Le Bulletin de Renseignements Documentaires comporte quatre editions:
- !'edition A : Bulletin analytique hebdomadaire signalant des actes, des communications et des documents des institutions ainsi que des articles de periodiques. Les textes retenus et analyses par le Service Central ArchivesDocumentation -(SCAD-IX/C/1) concernent les activites des institutions et tousles domaines qui s'y rattachent.
Le Service de documentation du Parlern,ent Europeen colla· bore a Ia selection des articles de periodiques.
- !'edition 8 : Bulletin signaletique a parution irreguliere, com· prenant des references bibliographiques sur un sujet determine. Chaque mise a jour annule !'edition precedente.
- I' edition C : Repertoire cumulatif a parution irreguliere. Chaque numero est consacre a une rubrique du plan de classement et reprend les references citees dans !'edition A depuis Ia parution du cumulatif precedent sur le meme sujet.
- I' edition D: est reservee a des periodiques d'information sur les activites des Communautes europeennes.
La presentation materielle des references dans les editions A et C est Ia suivante :
a) en haut eta gauche :
b) corps de Ia notice :
c) en bas eta gauche :
d) en bas et a droite : ( eventuellement)
numero d 'ordre :
A (actes communautaires, etc.) B (articles selectionnes) description bibliographique indices de classification no de microfilm du SCAD ou no de catalogue de !'Office des Publications, ou sigle PE (Parlement europeen)
(Suite a Ia 3eme page de couverture)
AVVERTENZA
II Bollettino di documentazione consta di quattro edizioni : - I'Edizione A : e un bollettino analitico settimanale che segnal(l
atti, comunicazioni e documenti comunitari, come pure articoli selezionati da periodici. I testi selezionati e analizzati dal Ser-vizio Centrale Archivi e Documentazione - (SCAD-IX/C/1) riguardano le attivita delle istituzioni e tutti i settori nei quali esse si esplicano.
II Servizio di documentazione del Parlamento Europeo colla-bora alia selezione degli articoli di periodici.
- I'Edizione 8 : e un bollettino segnaletico non periodico, com-prendente i riferimenti bibliografici disponibili su un soggetto determinato. Ogni aggiornamento include tutti i riferimenti bibliografici pubblicati nel precedente bollettino sullo stesso soggetto, e quindi lo annulla.
- I'Edizione C : e un indice cumulativo, non periodico, relativo ad una sezione del piano di classificazione e contiene tutti i riferimenti bibliografici pubblicati nell'edizione A a partire dalla data del precedente indice.
- I'Edizione D : e riservata a periodici d 'informazione sulla atti-vita delle Comunita Europee.
La presentazione materiale dei riferimenti bibliografici neUe edizioni A e C e Ia seguente :
a) in alto a sinistra :
b) al centro :
c) in basso a sinistra :
d) in basso a destra : ( se necessaria)
numero d'ordine A (atti comunitari, ecc.) B (articoli selezionati) descrizione bibliografica indici di classificazione
numero del microfilm SCAD, o numero di catalogo dell'Ufficio dellePubblicazioni, o sigla PE (Parlamento Europeo)
(seguito in terza pagina di copertina)
TOELICHTING Het documentatiebulletin bestaat uit vier uitgaven :
- Uitgave A : Wekelijks analytisch bulletin dat handelingen, mededelingen en dokumenten van de instellingen zowel als artikelen uit tijdschriften signaleert. De door de Centrale dienst archieven en documentatie (SCAD-IX/C/1) geselecteerde en geanalyseerde teksten betreffen de activiteiten van de instel-lingen en aile gebieden die daarmee in verband staan. De documentatiedienst van bet Europese Parlement werkt mede aan de selectie van tijdschriftartikelen.
- Uitgave 8 : Bibliografisch bulletin dat onregelmatig verschijnt en dat referenties over een bepaald onderwerp bevat. Ieder bijgewerkt nummer vervangt bet voorgaande.
- Uitgave C : Cumulatief dee! dat onregelmatig verschijnt. Ieder nummer is gewijd aan een rubriek van de classificatie en neemt de gegevens op die in uitgave A vanaf de verschijning van bet voorgaande dee! over hetzelfde onderwerp werden vermeld. - Uitgave D : voorbehouden aan de tijdschriften over de
werk-zaamheden va·n de Europese Gemeenschappen. De gegevens in de uitgaven A en C worden als volgt vermeld :
documentation bulletin
COMMUNITY -
THIRD WORLD :
THE CHALLENGE OF INTERDEPENDENCE
By
Wolfgang HAGER
and Michael NOELKE
Second edition
KEF I KEG I CEC I CCE I CEG
SCAD (IX-C-1) Rue de Ia Loi, 200, Wetstraat B-1 049 Bruxelles • Brussel
mit der Mitarbeit des Dokumentationsdienstes
• des Europiiischen Parlamentes
• avec la collaboration du Service de documentation
du Parlement Europeen
• with the collaboration of the Documentation Service
of the European Parliament
LEGAL NOTICE
The present study does not necessarily reflect the views of the Commission of the European Communities on the subject matter of the study nor does it necessarily anticipate the future attitude of the Commission on the topic.
@ Copyritt'tt CECA- CEE- CEEA, Bruxelles-Luxembourg,1980 Printed in Belgium
Foreword Chapter I Chapter II Chapter III Chapter IV Chapter V
Conclusions • •
TABLE OF CONTENTS
.
.
. .
.
. .
. .
. .
.
.
.
.
. .
. . .
. . .
.
Energy dependence and interdependence Raw materials
The Third World : a fast-growing market Industrialisation of the Third World : a threat or an opportunity for Europe
.
. .
.
.
Third World purchasing power and the role of financial transfers
.
. .
.
. .
.
.
.
.
. .
.
. .
. .
. .
. .
.
. .
Glossary
. .
. . .
.
.
.
.
.
. . .
~.
. . .
.
.
. . .
.
.
Analytical index
List of Tables and charts
.
.
. .
. .
.
. . .
.
. .
. .
.
3
5
39
69
103
119
147
149
153
FOREWORD
*
This revised, updated and expanded version of a study first published in February 1979
provides an instrument for measuring the main elements of the interdependence which
links Europe irrevocably with the Third World : energy; agricultural and mineral raw
materials; the growing importance of the Third World as an export market for the
Community; the new international division of labour in manufacturing industry; financial
transfers, and so on.
Produced with everyone interested in development and cooperation problems in mind,
it focuses on one aspect of interdependence : the growing importance of the Third
World for the European economy. In this way it hopes to demonstrate that cooperation
with the developing countries is not merely a moral duty but a political imperative
reflecting Europe's specific interests.
The authors, Dr Wolfgang Hager and Michael Noelke, are members "European Research
Associates", an economic consultancy based in Brussels. They were assisted in this
work by Eduardo Castell and Luigi Passamont1.
Brussels, October 1980.
*
European Communities - Commission
Europe and the Third World : A Study in Interdependence
Chapter I - ENERGY DEPENDENCE AND INTERDEPENDENCE
For Western Europe, oil represents by far the most important single link to that increasingly diverse group of countries which still regard themselves as belonging to a common grouping, the Third World.
In fact, more than 60% of all Community imports from Third World countries is petroleum.
In addition, the Community buys increaS-ing-qua-n-t-ities of natural gas from these countries, and imports of uranium ore will rapidly gain in importance. Beyond the fact of energy dependence there is, however, a less generally recognised fact of energy interdependence : the energy policies pursued the industrialised countries affect the long-term development prospects of non-oil producing developing countries. Even in the short-term, the ability of the rich consuming nations to achieve cooperative and stable market rela-tions with the oil producers has a direct bearing on the economic fortunes of the poorer countries.
Oil has also been an important factor in transforming the overall political relations between North and South : it has moved nations from non-committal discussions on the future of the international economic system towards seriou~
if still largely inconclusive, negotiations. Present and future energy requirements
As table I,1 shows, Middle East oil is by far the cheapest energy source in terms of production costs. But it is also by far the most internationally-traded source of energy, and therefore highly sensitive to global imbalances in supply and demand. Oil is not only cheap to produce, however, but also extremely cheap to utilise. It is therefore the ideal fuel for developing countries - if it remains available.
I I 1
PRIMARY ENERGY PRODUCTION COSTS
(in dollars/barrel oil equivalent)
0,25 to 1,00
7,00 to 12,00
1 0,00 to 15,00
15,00 to 25,00
15,00 to 35,00
Middle East oil
r
tlq.'ilid fuels' from asphalt sandstt.quid tuets>from tiitumloous schists
Source : Shell : World Energy Prospects.
1 barrel : 159 litres
There are other good long-term reasons for the rich countries to diversify away from a technically cheap energy source like oil. One of these is the narrow geographic concentration of internationally tradeable reserves (and
current production) - (see tables I,2 and I,3, below).
I, 2 1978 ESTIMATES OF PROVEN WORLD OIL RESERVES
unit Billions of barrels (1)
World total 641.61 of which Asia-Pacific
Europe Middle East Africa
Western Hemisphere Communist areas
Source : The Oil and Gas journal - Dec. 1978.
lJ,
0~
~~~
Indonesia20.01 23.97 370.00 57.89 75.75 94.00
!,3 ESTIMATED 1978 WORLD OIL PRODUCTION
unit : 1000 barrels/day
World total 59,993 of which Asia-Pacific Europe Middle East Africa
Western Hemisphere Communist areas Source The Oil and Gas journal - Dec. 1978.
8
~
0~
~~~
Indonesia
The other reason for diversifying out of oil is the actual market price, whose development is charted in table I,4.
I,4
EVOLUTION OF CRUDE OIL PRICES (ARABIAN LIGHn 1970·1979
in dollars/barrel
(Arabian Light) 24
23,5
22
20
18
16
~---1-4,5J
: :
~---~;~-
.... ' 1t2sI
12.38 12.71J.33r
18,5
-10
L
I ---~--~~---~---+----~----~--~~
8
~-6 5.18
5,12 _-.
4
2,29 2t18 2.59
2 1,80 2,18 ,r--:
l
..
..
..
0 ,. ,,
1 JU y
MAY JUI.JAII. JAil. 110¥. OCT. OCT. JULY JAil.
Source : ccle Monde11 29th June 1979.
The Community's energy requirements
As shown in table I,S, there has been a substantial fall in energy imports in the five years since the oil 9risis. These imports will however rise again in the eighties. Because much of this initial rise is in the form of gas, oil imports will remain stable in absolute amounts until 1985, and only then rise again quite sharply.
I,S
DEVELOPMENT OF PRODUCTION AND IMPORTS OF PRIMARY ENERGY BY THE EC 1970-1978 AND FORECAST FOR 1985 AND 1990
1400
1300
1200
1100
1000
900
800
700
600
500
400
300
200
100
in millions toe
Production
.,.. (a
_ - - - Imports of Primary Energy
- - - , ... (b)
_.,.- __ ... :,..,....(a)
- - - ... , , , .. (b) ...
--
_...
,
,,
---
_________
..-.,,.-;.,.,.,..
~~-_.-....
---
....,-""",.,
....
--
--
....
--
...,,...,...,
--~~r~~~~~~~~--~----4
1970 71 72 73 74 75 76 77 78 1980 1985 1990
of which Oil
Source: Eurostat: Overall Energy Balance Sheets 1970·1977
CEC: Energy Objectives for 1990 and Programmes of the member states. COM (78) 613. 16 November 1978 CEC: Energy ObJectives of the Community for 1990 and convergence of policies and member states. COM (79) 316
The picture looks more positive if we consider not the absolute quantities but the share of imported oil in total energy consumption, i.e. the most
important measure.of energy dependence (table I,6). Here we see a sharp de-cline from over 60% in 1973 to about 50% in the late seventies, and to nearer 40% in 1985. This improvement, however, will be short-lived : by the end of the eighties the share will again rise to just below 50%.
I,6
THE SHARE OF OIL IN THE EUROPEAN COMMUNITY'S CRUDE ENERGY CONSUMPTION 1970·1978 AND FORECAST FOR 1985 AND 1990
60
50
40
30
1970 71 72 73 74 75 76 77 78 (a) hypothesis of strong consumption growth (b) hypothesis of weak consumption growth
1980 1985 1990
Source: Eurostat: Overall Energy Balance Sheets 1970-1977
CEC: Energy Objectives for 1990 and Programmes of the member states- COM (78) 613- 16 November 1978 CEC: Energy objectives of the Community for 1990 and convergence of policies and member states. COM (79) 316
As table I,7 shows, the relatively modest increase in oil consumption is predicated on a substantial increase in other sources of energy. In this context, government priorities go to nuclear, coal, and gas (see following page).
"Domestic" Community oil production, most of it from the North Sea, will continue to increase and account, on optimistic assumptions, for about a quarter of total oil consumption by 1990. (cf. tables A-I,2 and A-I,3). At present, little more than one tenth of our oil needs are produced within the Community, an average which contains national variations from virtual 100% import dependence in Belgium, France or Italy to 56% dependence for Britain (A-I,4).
1,7
DEVELOPMENT OF CRUDE ENERGY CONSUMPTION IN THE EUROPEAN COMMUNITY BY PRIMARY SOURCE: 1970·1978 AND FORECASTS FOR 1985 AND 1990
in millions toe
I
1400
l
I
1200
1000
l
I
BOO
J
Natural gas
I
600
I
400
j
Oil
I I I I I I I I I I
1970 1975 1980 1985 1990
Source: Eurostat ·Overall Energy Balance sheets 1970-1979
CEC: Energy ,objectives for 1990 and programmes of the member states COM (78) 613 · 16 November 1978 CEC: Energy objectives of the Community for 1990 and convergence of policies of member states. COM (79) 316
It is interesting, in this context, to compare the Community situation with that of the United States and Japan. the Community is still the biggest importer, although on present trends, the US is rapidly catching up. Japan, with its much smaller population, imports only a third less than the other
two, a reflection of its poor domestic energy resources (see tables !,8 and I,9).
I,S
CRUDE OIL CONSUMPTION AND CRUDE OIL IMPORTS OF THE BIG INDUSTRIAL COUNTRIES : EC, USA, JAPAN; 1977·1979
in millions of tonnes
USA
900 EC 890 905
922 JAPAN
800 800 800
700
600
525 535 545
500
-400 ~---....---...
4p0 402 41 7
"'"---
...4 6 472 4! 0 400 400
300
200
-100
1 290
i
:rr----~----'1
9
1977 78 79
90.6% 88.2% 82.5%
1977 78
oil imports x 100 oil consumption
7~
=
- - - . - - - - '
44.9% 44.4% 45.2%
1977
99.6%
Source: CEC: The Energy Situation in the Community and in the World; COM (79) 142; March 20th 1979.
I,9 THE IMPORTANCE OF IMPORTED OIL IN U.S. OIL REQUIREMENTS : 1960-1978 Net oil imports are given in millions of tonnes of oil equivalent
1960 1965 1970 1973 1975 Net oil imports 66.3 99.3 152.9 287.1 301.9 As per cent of total oil 14.6 18.7 22.2 36.2 39.2
requirements
As per cent of total 6.5 8.1 9.7 16.5 18.1 energy requirements
Source DECO Economic Outlook n° 25/1979.
78 79
99.6% 99.6%
1978 409.2
The self-sufficiency ratio of the Community is considerably more favourable as regards natural gas. Most member countries have some production capacit~
Great Britain and,more especially, the Netherlands are substantial producers. Yet while imports in 1977 stood at only 11% of total consumption, this share has risen rapidly to 19% as efforts to diversify away from oil have intensi-fied (table A-I,5).
Lastly,a word about nuclear energy which, unlike coal and other forms of domestic energy, has relevance for our relationship with the Third World. For one thing, nuclear power with its vast capital and technological requi-rements is an energy source open chiefly to the rich countries, while poorer countries have no option b'ut to increase their reliance on oil. Secondly, uranium ore is increasingly mined in the Third World, although useful figures on the amounts imported are not available (1).
The growing importance of nuclear energy and its heavy concentration in the rich countries can be read from table A-I,6.
According to the intentions of member governments, the Community's nuclear capacity is meant to double every five years until 1990. The expansion of anti-nuclear movements may, however, oblige governments to change their plans. But it should be noted that since the second oil price explosion of 1979
and following the loss of certain overseas markets, such as Iran, for their nuclear reactors, member states are intensifying efforts to speed up their nuclear programmes and make up for the time lost in recent years.
Certain developing countries like India, Pakistan and Brazil are making major efforts, with the help of industrialised nations,to aquire a nuclear generating capacity. The sale of nuclear equipment to developing countries raises very sensitive political problems, given the risk that nuclear tech-nology can be adapted for military purposes.
It is estimated that by 1990 nuclear capacity outside the OECD area will have reached only one-tenth of the 460 - 640 Gigawatts of installed nuclear electricity in Western industrialised countries.
Table I, 10 shows the extraordinary growth in uranium requirements in the next 20 years. The table (see following page) also shows that world requi-rements for uranium will be twice as high if nations choose to forego the
(1) See however table A-I,12 for figures on exploration expenditures by advanced and less developed countries.
option of recycling used fuel rods through processes which yield, among other products, large quantities of plutonium, a primary ingredient for ma~
king atomic weapons.
I, 10
ESTIMATE OF WORLD URANIUM REQUIREMENTS
without recycling
338
234
1977 80 85 90 95 2000 1977
Source: Uranium- Resources, productions and demand - OECD, Paris 1978.
in thousands of tonnes
present trend
accelerated scenario
with recycling
242
181
The Community's energy suppliers a. Oil
In 1978, more than 4/5ths of all oil imported into the Community came from the Middle East and North Africa. Less than 20% came from the rest of the world, notably Nigeria, Eastern Europe and Norway (table I,11). Saudi Arabia supplied 25% of our imports, and all Arab states taken together nearly two thirds.
I, 11
THE EC'S BIGGEST SUPPLIERS OF CRUDE OIL IN 1978
Libya __
Algeria~
Gulf States
Source: Euro_stat- Hydrocarbons monthly bulletin- n" 9/1979. •
The tables I,12 and table A-I,7 show that the market shares of individual supplying countries varied considerably between 1970 and 78. Thus, Algeria sup-plied half the amount in 1978 that it did in 1970, and Libya less than a third. The amounts supplied by Irak remained remarkably stable, while Iran doubled its exports to the Community. In the meantime, of course, there have been sharp cut-backs and reduced production ceilings in Iran. In future, Mexico can be expected to become a major exporteralthough its significance
for the Community lies in its contribution to global energy supplies.
While the importance of individual supplier countries changes, the importance of the Middle East as our principal source, and of OPEC as the dominant force
in the world oil market, seems assured: as shown in table I,2 above, five Middle Eastern countries hold more than half the world's reserves of crude oil. Almost three quarters (73%) of world reserves are held by OPEC, as against 8% in North America, 11% in the Soviet Union and only 3% in Wes-tern Europe.
1,12
EVOLUTION OF EC PRODUCTION AND IMPORTS OF CRUDE OIL FROM 1970 TO 1978
unit : millions of tonnes
600
550
500
450
400
350
/~
~I
\~-~
\
~~\ ~,~
Others~/ ~~
----
--·~~nEurope
\\~
'--- Western HemisphereGulf States
\
~---\:~Kuwait
I
EC productiOOJSaudi Arabia
300
- - \
250
'~
~
·~
200
Iran
150
Iraq
100
50
~
~-~~~----~----~---~ AI~:::
More than any other item in world trade, oil has become the object of state control and interstate bargaining. On the economic front, this bargaining -most of it still implicit rather than explicit - involves both short-term and long-term choices by producers and consumers.
For the producers, the short-term issues are those of pricing and production levels. The laws of interdependence operate even in this context, where producers might appear to have an autonomous power of decision : when prices are pushed too high, the resulting recession in the consuming countries can reduce the volumes sold while the resulting inflation raises the export pri-ces of countries selling machines, consumer goods and food to the oil coun-tries. Inflation also reduces the value of the oil producers' bank balances and other forms of outstanding credit while economic recessions reduce the value of their tangible assets held abroad.
For the consumers, the short-term issues involve decisions on saving and producing energy and how sacrifices in money, comfort, or perhaps employment are to be distributed. The short-term goal is to relieve the pressure of the oil market through a better balance between supply and demand ; a second, more important goal, is to start the slow process of long-term adjustment. The main long-term issue for both producers and consumers concerns the speed with which oil a finite resource, is exploited. Most producers, with the exception of Saudi Arabia, can look for only a few decades of production at or near present levels. For many, time is thus too short to build up a viable economy to provide an income after the oil runs out. Their strategy will be to stretch this period by adopting conservation measures. If present growth rates in world oil consumption continue, Saudi Arabia would have to double its production. At that rate, however, it too would begin to run out of oil by the year 2000. Much points to the fact that Saudi Arabia will not, in fact, increase production to anything like the extent considered necessary by Western energy planners.
Unless the Community and the other large consumers condition themselves to this long-term perspective, the prospect is one of painful and wasteful forced adaptation. The form this would most likely take is a series of eco-nomic cycles, with periods of moderate growth - which strain energy supplies-followed by sharp recessions due to price-induced inflation and balance-of-payments problems. During periods of weak growth, oil supplies might well, for a short time, exceed demand - enough to disguise the underlying problem and delay the response to it. Political problems in a single important pro-ducer country could, however, wipe out such a "mini-glut" overnight.
It would be quite wrong, however, to reduce the oil problem to one of supply interruptions. At present, the long-term economic policy stances of producers and consumers are incompatible.
b. Natural gas
Looked at from the perspective of energy interdependence, natural gas presents a number of unique features. Unlike oil which is a fungeable commodity and can be sold in small lots in many markets, gas requires considerable invest-ment : on the producer side, pipelines and refrigeration plants which require
the security of long-term purchasing contracts ; on the consumer side, treat-ment plants, pipelines and a domestic supply infrastructure which equally re-quire long-term contrats. Special ships to transport liquid natural gas are another big investment borne by either suppliers or purchasers. Interdepen-dence thus has a particularly material reality in international trade in gas. Supplies are usually contracted over 10-20 years.
It is perhaps for this reason that gas imports are considered an alternative to oil dependence, in spite of the fact that the number of suppliers here is even smaller. By the mid-eighties, only five countries will supply the Com-munity. Three of these are developing countries (see table I,13). However, none of these approaches in importance the principal "domestic" supplier of most Community countries, the Netherlands (table A-I,18). The Soviet Union is the chief outside supplier.
I,13 BREAKDOWN AND FUTURE DEVELOPMENT OF EC IMPORTS OF NATURAL GAS BY COUNTRY OF ORIGIN
(in billions of ~ and in %)
1978 1985 1990
~~ ~
~ ~~ % Bn ~ %
ALGERIA 4,7 11,3 48,7 40,8 61,2 40,6 LIBYA 2,9 6,9 3,3 2,8 3,3 2,2 USSR 17,1 41,0 23,8 19,9 25,6 16,9 NORWAY 17,0 40,8 35,2 29,6 46,2 30,6
IRAN
-
-
8,1 6,8 10,0 6,6OTHERS
-
-
-
-
4,4 2,9TOTAL 41,7 100% 119,1 100% 150,7 100% Source Aspects of external measures by the Community in the Energy
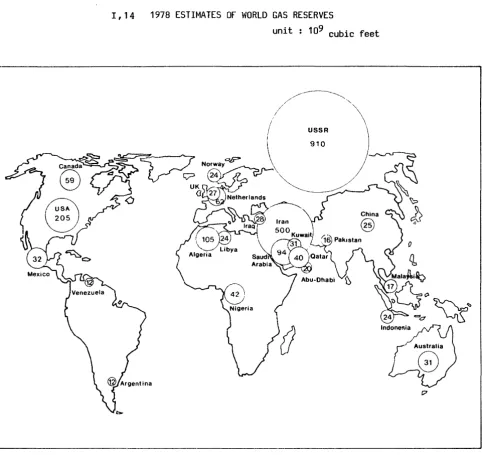
Table I,14 shows the importance of these last-named countries on the distant periphery of the Community as regards known reserves. In Iran and most Middle East countries, however, a great deal of gas released in the process of oil extraction - socalled associated gas - is simply flared off, as the infra-structure for collecting this gas is lacking. Because of the long lead-times involved, high energy prices cannot change this situation quickly. But a map of world gas reserves may,by the late 1980's look quite different from the picture presented in table I,14.
r
I,14 1978 ESTIMATES OF WORLD GAS RESERVES
World total 2,502 of which
unit : 109 cubic feet
Asia-Pacific Europe Middle East
119,850 143,260 730,660
Africa 186,290
Western Hemisphere 376,950 Communist areas 945,000 Source The Oil and Gas journal - Dec. 1978.
[image:23.588.55.537.180.635.2]c. Uranium
Statistics on trade in uranium are so fragmentary as to be worthless. However, OECD estimates on present and future production provide some indication of the
importance of the Third World even for this energy source. By 1985, four ad-vanced countries, the
u.s.,
Canada, South Africa and Australia,will produce 73,000 tonnes of uranium out of a non-communis~ world production of 92,000(table A-!,9). EEC domestic production- assuming membership of Greece, Spain and Portugal -will be around 5,500 tonnes, and that of the Third World around 13,000 tonnes. Most important for Europe, not less than 11,000 tonnes of this total will be produced in three associated African states. To this must be added a part of "South African" production which may by then come from an independent Namibia.
The true importance of these supplies of uranium ore for the Community is greater than the figures suggest. Our principal suppliers in the advanced world, for both economic and political reasons, prefer to supply uranium which has already been submitted to the expensive and highly sophisticated process of enrichment - coupled with increasingly stringent conditions as to the end use of the fuel. As Europe's two large enrichment consortia (Eurodif and Eurenco) take up full-scale production, supplies of raw uranium gain in importance.
The importance of Africa for the medium-term future is clearly visible from the estimates (table A-I,10)of world reserves. Taking the high estimate, Africa emerges as the most promising continent. But as the less speculative estimates of known deposits (table A-I,11) show, much of this total is to be found in South Africa. Another indication of the future is given by expen-ditures on prospecting for new finds of uranium (table A-I,12). The share of total expenditures carried out in the LDCshas risen only modestly from 13%
A -1, 1 WORLD ENERGY CONSUMPTION -ESTIMATES FOR THE YEAR 2000 1 9 7 5 2 0 0 0 population per total population assuming low consumption ~n millions capita million total toe toe per millions C( capita million 0( toe America 237 7.8 1 849 304 1.0% 12.1. 3 688 2.8~~ Europe 386 3.1 1 197 448 0.6% 4.7 2 113 2.3% Turkey) Europe 385 3.5 1 348 494 1.m~ 7.6 3 770 4.2% USSR) Australia, Zealand, South Africa 154 2.5 385 197 1.0% 5.2 1 026 4.0% for developed 1 162 4.1 4 779 1 443 0.9% 7.3 10 597 3.2% 30% 83% 22% 70% 823 0.44 362 1 194 1.5% 1.6 1 919 6.9% World 1 983 0.3 595 3 860 2.7% 0.68 2 614 6.1% 10% 17% for developing 2 806 0.34 957 5 054 2.4% 0.9 4 533 6 .4~~ 70% 17% 78~~ 30% total 3 968 1.45 5 736 6 497 2.0% 2.3 15 130 4.0% average annual growth rate in the period 1975 to 2000. : CEC : Energy cooperation ; SEC (79) 31 ; 13 December 1978. assuming high assuming minimum consumption consumption per total per total capita million o( capita million o( toe toe 14 4 265 3.4~~ 10 3 033 2.0% 6.5 2 898 3.6% 4.4 1 964 2.0~~ I 9.2 4 565 5.0% 5.7 2 822 3.0%
I I
A-I,2
DEVELOPMENT OF EEC OIL PRODUCTION AND IMPORTS 1970·1978 AND FORECAST FOR 1985 AND 1990
in millions toe
700
600
500
400
300
200
iOO
1970
A-I,3
1975 1978 1980 1985
(a) Oil production
(b)
Oil imports
1990
EC: IMPORTED OIL AS A PROPORTION OF TOTAL OIL CONSUMPTION
100 90
70
50
30
10
I *
1970 1975
a) Hypothesis of strong consumption growth b) Hypothesis of weak consumption growth
1978 1980
Source: Eurostat: Overall Energy Balance Sheets 1970·1977
1985 1990
CEC: Energy Objectives for 1990 and Programmes of the Member States· COM (78) 613 • 16 November 1978 CEC: Energy objectives of the Community for 1990 and convergence of policies of member states. COM (79) 316
26
A - 1,4
COMMUNITY MEMBERS' CRUDE OIL SUPPLIES - 1978 - PRODUCTION, IMPORTS, LEVEL OF DEPENDENCE
unit : millions TOE EUR-9 D F I Nl B l UK Production 62,2 5,1 1 '1 1,5 1,5
-
-
52,6 Imports 480,6 97,8 115,6 112,8 57,8 33,0-
66,3 level of dependence (%) 88 ,5~~ 95,0% 99 ,o~~ 98 '7~~ 97,5% 100~~ 100~~ 55,8% Source Eurostat- Hydrocarbons monthly bulletin- n° 9/1979.A- I,S
IRL DK
-
0,4 2,3 7,8100~~ 92 '9~~
EC SUPPLIES OF NATURAL GAS - 1977-1978 - PRODUCTION - IMPORTS FROM THIRD COUNTRIES IMPORTS FROM THE NETHERLANDS - GROSS DOMESTIC CONSUMPTION
(unit : 1000 tera joule) EUR 9 D F I Nl B
PRODUCTION 77 6 491.5 673.0 298.9 526.1 3 407.4 1.3 78 6 161.9 725.1 308.9 519.7 3 119.5 1.5 IMPORTS FROM 77 802.2 232.8 123.6 354.9 10.2
10.3 3rd COUNTRIES 78 1 416.6 507.2 185.5
407.2 61.9 54.9 IMPORTS FROM 77 1 887.2 884.0 455.9 139.5 388.5 NETHERLANDS 78 1 669.0
-716.2 452.0 138.7
-
341.0 GROSS DOMESTIC,7 7 183.1 1 767.9 820.7 1 009.3 1 508.4 399.9 CONSUMPTION 78 7 470.7 1 932.5 894.9 1 023.1 1 515.4 396.6 DEGREE OF (1)DEPENDENCE ON 77 11.2% 13.2% 15.1% 35.2% 0.0% 2.6% 3rd COUNTRIES 78 19 .o~~ 26.2% 21.8~~ 39.8% 4.1% 13.8%
Source : Eurostat - Hydrocarbons monthly bulletin n° 9/1979 • (1) : %defined by the relationship 3rd countries imports
gross domestic consumption
l
UK
-
1 584.8-
1 487.2-
70.4-
200.0 19.3 -21.1 -19.3 1 657.5 21.1 1 687.2-
4.3%-
11.9~~IRL DK
-
--
--
--
--
--
--
--
--
-A - I, 6 NUCLEAR POWER GROWTH ESTIMATES
(in G We)
1977 1980 1985 1990
Germany 6 12 25 47
Austria
-
0.7 0.7 2Belgium 1.7 1.7 3.5 8
Canada 3.3 6 10 20
Denmark
-
-
-
2Spain 1 .1 8 15 20
United States 48 60 115 194
Finland 0.4 2.2 2.2 3.5
France 4.7 15 34 53
Greece
-
-
-
1Italy 0.6 1.4 5.4 25
Japan 8 15 27 50
Luxembourg
-
-
-
1Netherlands 0.5 0.5 0.5 3
Portugal -
-
-
1.8United Kingdom 6.6 10.3 10.3 15.3
Sweden 3.2 6.5 7.4 8
Switzerland 1.0 1.9 2.8 3
Turkey
-
-
-
1European Community 20.1 40.9 78.7 154.3
DECO countries
"present trend" estimate 85 141 259 459 "accelerated nuclear" estim 85 141 343 640 Non OECD countries
"present trend" 2 5 19 45
"accelerated" scenario 2 5 25 60
Total
"present trend" 87 146 278 504
"accelerated" scenario 87 146 368 700
Source Uranium - Resources, Production and Demand. DECO, Paris 1978.
A-rr8
NATURAL GAS EC : IMPORTS FROM THIRD
CONSUMPTION
1977
PARTY COUNTRIES AND GROSS INLAND
NORWAY
110 893 Tj
ALGERIA
ABU DHABI139246Ti
1181 TiSource: Eurostat - Gas statistics 1977. Up to date November 1978
Proportion accounted for by :
indigenous gas
Netherlands gas
Third party countries
USSR 452 021 Ti
o
o
o
p
LIBYA
98 894 Tj
d$
il
co
A - !,9 FORECAST OF WORLD URANIUM PRODUCTION CAPABILITIES 1977-1990
excluding Soviet Union and East bloc States (tonnes of uranium)
1977 1980 1985 1990
EC : D 100 100 200 200
F 2 200 2 850 3 700 4 000
I 0 120 120 120
OTHER EUROPEAN STATES
.
.
Spain 191 678 1 272 1 272
Portugal 85 95 270 270
Turkey 0 100 100 100
Yugoslavia 0 0 180 440
AFRICA :
South Africa 6 700 11 700 12 500 12 000
Central African Emp. 0 0 1 000 1 000
Gabon 800 1 200 1 200 1 200
Niger 1 609 4 100 9 000 9 000
NORTH AMERICA
.
.
United States 14 700 22 600 36 000 47 000
Canada 6 100 7 950 12 500 11 250
LATIN AMERICA :
Argentina 130 360 600 600
Brazil
-
385 385 385Mexico 0 170 550 550
ASIA :
India 200 200 200 200
Japan 30 30 30 30
Philippines 0 38 0 0
OCEANIA :
Australia 400 500 11 800 20 000
TOTAL (ROUNDED) 33 000 53 000 92 000 110 000
/
A - I, 10 URANIUM SPECULATIVE RESOURCES LISTED BY CONTINENT (1)
Continent Number Speculative resources
of countries (million tonnes U)
Africa 51 1.3
-
4.0America, North 3 2.1
-
3.6America, South and Central 41 0.7
-
1.9Asia and far East
*
41 0.2-
1.0Australia and Oceania 18 2.0
-
3.0Western Europe 22 0.3
-
1.3Total 176 6.6 - 14.8
Eastern Europe, URSS, 9 3.3
-
7.3Peoples Republic of China
*
Excluding Peoples Republic of China and the eastern part of USSR.(1) Speculative Resources refers to uranium in addition to ":Estimated Additional Resources" and to "Reasonably
Assured Resources".
They are thought to exist mostly on the basis of indirect indications and geological extrapolations in deposits discoverable with existing exploration techniques.
Source : Uranium, Resources, Production and Demand. OECD, Paris 1978.
A- !,11
ESTIMATED URANIUM RESOURCES OF NON-COMMUNIST WORLD, DATA AVAILABLE 1ST JANUARY 1977
unit 1000 tonnes uranium
-~ ..
-Reasonably assured Estimated additional
resources resources
(80 80-130 (80 80-130
dollars/KgU dollars/KgU dollars/KgU dollars/KgU
EC : D 1.5 0.5 3.0 0.5
DK - Greenland 0.0 5.8 0.0 8.7
r
37.0 14.8 24.1 20.0I 1.2
o.o
1.0o.o
UK 0.0 0.0 0.0 7.4
OTHER EUROPEAN STATES :
Spain 6.8 0.0 8.5 0.0
Portugal 6.8 1.5 0.9 0.0
Finland 1.3 1.9
o.o
0.0Sweden 1.0 300.0 3.0 0.0
Turkey 4.1 0.0 0.0 0.0
Yugoslavia 4.5 2.0 5.0 15.0
Austria 1.8 0.0
o.o
0.0AFRICA :
South Africa 306.0 42.0 34.0 38.0
Algeria 28.0
o.o
50.0 0.0Central African Emp. 8.0 0.0 8.0
o.o
Gabon 20.0 0.0 5.0 5.0
Madagascar 0.0 0.0 0.0 2.0
Niger 160.0
o.o
53.0 0.0Somalia
o.o
6.2o.o
3.4Zaire 1.8
o.o
1.7 0.0NORTH AMERICA :
United States 523.0 120.0 838.0 215.0
Canada 167.0 15.0 392.0 264.0
LATIN AMERICA :
Argentina 17.8 24.0 0.0 0.0
Bolivia 0.0
o.o
o.o
0.5Brazil 18.2 0.0 8.2 0.0
Chile 0.0
o.o
5.1o.o
Mexico 4.7 0.0 5.1 0.0
ASIA :
Korea 0.0 3.0 0.0 0.0
India 29.8 0.0 23.7 0.0
Japan 7.7 0.0 0.0 0.0
Philippines 0.3 0.0 0.0 0.0
OCEANIA :
Australia 289.0 7.0 44.0 5.0
TOTAL (ROUNDED) 1 650.0 540.0 1 510.0 590.0
A- !,12 EXPLORATION EXPENDITURE In respective country (1) PRE-1972 1972 1973 1974
Denmark 450 0 170 170
France 87 000 4 800 5 400 8 200 Germany r.R. n.a. 1 200 1 700 2 000 United Kingdom 637 110 68 40 Total EC 88 087 6 110 7 338 10 410 Australia 31 000 12 800 16 300 14 600 Canada n.a. n.a. n.a. n.a.
Greece 0 90 90 122
Japan 10 617 630 533 507 Portugal 5 594 135 207 246 South Africa 841 n.a. 376 822 Spain 13 336 1 787 1 929 2 576 Sweden 1 000 1 200 1 480 2 070 Switzerland 742 40 166 142 Turkey 3 500 400 500 650 United States (3) 238 870 32 400 49 470 80 950 Total Industrialised 305 500 49 482 71 051 102 685
:ountr~es
Bolivia 200 60 70 1 150 Brazil 10 000 1 500 8 500 10 000 Central African Empire 15 000 0 0
Chile n.a. n.a. n.a. n.a.
Colombia 0 0 0 500
Ghana n.a. 0 0 0
India 39 146 2 584 2 402 3 214
Iran n.a. 0 0 n.a.
Jordan 0 n.a. 28 20
Korea 0 65 43 30
Madagascar n.a. 0 0 0
Mexico n.a. 488 1 554 1 709
Niger (2) 34 000
Philippines 300 1 1 20
Somalia (2) 3 750 6 250
Sudan n.a. n.a. n.a. 0
Total Developing countries 64 646 8 448. 46 598 22 893 TOTAL 458 233 64 040 124 987 135 988
(US $ 1 000) 1975 1976
300 300 14 600 19 600 2 000 3 000 10 15 16 910 22 911 10 000 n.a.
n.a. 45 000 224 432 360 463 244 276 342 357 6 483 7 100 2 900 (5 050)
126 69 800 900 128 290 183 425 149 769 243 072 1 760 1 912 19 000 16 000
3 000
8 33 1 000 1 500 0 0 3 407 3 352 n.a. n.a. n.a. n.a. 38 192
0 50 2 150 1 731 n.a. 40 46
0 0 200 30 403 25 016 197 082 290 999 n.a. Not available, expenditures occured but have not been reported
or are withheld to avoid disclosing single company data. (1) Data in Tables are not in all cases mutually exclusive. (2) Numbers reported refer to the total expenditures over the
period indicated by the horizontal line.
(3) USA data for "PRE-1972" only include the years 1966 to 1971. US NURE expenditures are included for the years 1975 to 1977.
1977 estimated
1 400 20 000 3 000 269 24 669 n.a. n.a. 1 340
505 261 229 11 000 n.a.
61 2 500 256 150 272 046 1 400 19 000 2 000 50 2 000 44 4 321 30 000 n.a. 200 236 2 119 n.a. 980
0 0 62 350 359 065
N.B. Expenditures occured but have not been reported for : Algeria, Argentina, Austria, Cameroon, Egypt, Gabon, India, Ireland, Italy, Morocco, New Zealand, Peru, Thailand, Uruguay, Yugoslavia, Zaire and Zambia.
Source : Uranium - Resources, Production and Demand. DECO, Paris 1978.
A - I' 13 COMMUNITY ENERGY CONSUMPTION ACCORDING TO ECONOMY SECTORS in %
Industry Transport Household Total and domestic
Solid fuels 5
-
3 8Natural gas
-
-
8 14I
Petroleum products 12 17 17 46
Electrical power and 16 1 15 32 others
Total 39 18 48 100%
A - I, 14 ENERGY CONSJMPTION IN THE ACP STATES IN 1975
Population Total (in millions) consumption
(million toe) Africa (1) 277 858 17.548
Indian Ocean 10 106 0.546
Caribbean 4 822 6 397
Pacific 3 574 0.761
Exemple :
Upper Volta 6 032 0.078
Ethiopia 27 950 0.533
Nigeria 75 023 3.792
Zaire 24 721 1.285
Sudan 15 550 1.652
Kenya 13 350 1 550
(1) Not including Botswana, Lesotho and Swaziland. Source : CEC - Energy Cooperation - 13 December 1978.
36
Per capita consumption
in toe
0.063 0.054 1.326 0.213
Energy consumption and population
1975; energy in mio. tee.
213540000_
IUSAI
2349,5 254390000 258400000
1178,3
(g)
ECI
usA
I
USAIeee
PI
USSR[!]
JapanE3
1410,8
=50000000
111560000
International comparison of energy consumption
per capita
lEI
EClusAI
USAPer capita Industrial production
by region, 1973, in dollars
208
38
[!]
JapanChapter II RAW MATERIALS
After energy, raw materials and food products are the determining factors in the relationship between rich and poor countries. This is the case even although the developing nations are not the Community's biggest suppliers and although raw materials represent the declining rather than the dynamic sector of Third World development (1).
Why the political importance of raw materials ? For one thing they constitute the oldest economic link between South and North and thus carry the weight of historic injustices. Because raw materials, until very recently, were the only goods exported by most LDCs, these countries have given a lot of thought to the nature of the market and its perceived iniquities : most of the demands made under the heading of the New International Economic Order are based on analyses carried out in Latin America just before and after World War II. In the decades since, the Third World has been slowly unifying around raw
materials-related demands. The political salience, lastly, is enhanced by the fact that primary commodities, until very recently, always involved resources of the land with its direct links to national sovereignty. Strange as it may seem, exploiting human resources through foreign investment in manufac-tures is a less sensitive matter than exploiting subsoil resources constituted millions of years ago.
Raw materials, the symbol of North-South interdependence, have thus become the object of bargaining on two levels. One concerns essentially the substi-tution of new trade mechanisms for present arragements which are perceived as free by the industrialised countries, and perceived as managed - to their disadvantage - by the developing countries. The Integrated Programme
for Commodities, launched by UNCTAD in 1974, has been the focus of this effort.
The second level concerns essentially a redistribution of the benefits between the foreign investor in mining or agricultural enterprises on the one hand, and the host country on the other. While efforts are being made to tackle this problem at aglobal level (i.e. through the introduction of far-reaching concepts of national sovereignty over resources, new international
accounting standards,etc.), the core of this bargaining takes place between individual companies and host governments. Host countries have been so suc-cessful(and have created such a climate of uncertainty) that much of potential new investment is transferred to industrialised raw-material producing
countries (see below).
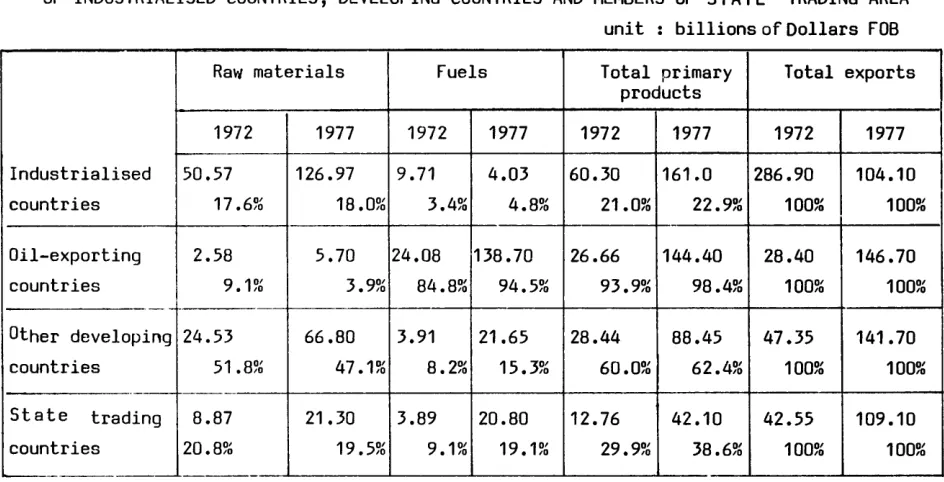
As to the economic importance of primary commodities for the Third world, this is inadequately reflected in the 43% share of such items in the total exports of non-OPEC developing countries (see table II,1).
11,1 SHARE OF RAW MATERIALS, FUELS AND PRIMARY PRODUCTS IN THE EXPORTS OF INDUSTRIALISED COUNTRIES, DEVELOPING COUNTRIES AND MEMBERS OF STATE TRADING AREA
unit : billions of Dollars FOB Raw materials Fuels Total primary Total exports
products
1972 1977 1972 1977 1972 1977 1972 1977
Industrialised 50.57 126.97 9.71 4.03 60.30 161.0 286.90 104.10
countries 17. 6~o 18.mo 3.4~o 4.B~o 21.m~ 22. 9~o 1om~ 1oo~o
-Oil-exporting 2.58 5.70 24.08 138.70 26.66 144.40 28.40 146.70
countries 9 .1~o 3. 9~o 84 .8~o 94. 5~~ 93. 9~~ 98 .4~~ 1oo~o 100~~ -.
Other developing 24.53 66.80 3.91 21.65 28.44 88.45 47.35 141.70
countries 51 .B~o 47 .1~o 8. 2~o 15.3~o 60 .o~o 62 .4~o 1omo 1oo~o
·
-State trading 8.87 21.30 3.89 20.80 12.76 42.10 42.55 109.10
countries 20. 8~o 19. s~o 9 .1~o 19. 1~o 29. 9~o 38 .6~~ 1omo 10mo
.._____
________
Source GATT - International trade 1978/1979.
Much of their remaining exports, notably metals and some processed food pro-ducts, are also linked to commodities. Moreover, as shown in chapter IV manufactured exports are heavily concentrated in a few "rich" LDCs, while commodities are the largest, and often the only, source of revenue for the large majority (see table A- II,1).
Advanced countries like Australia, Sweden and the United States have in fact financed much of their development by exports of basic commodities and for most LDCs this is the most promising way. As more than two-thircsof LDC primary commodities are exported to Western industrialised countries (see table A- II,2), their special role in the long-term development of LDC income is evident.
[image:43.584.67.539.240.481.2]The economic importance of raw materials to the industrial countries is more
difficult to assess. Non-energy, commodities ma~up only a small part of
GNP, perhaps 5%. Yet they form the basis of the inverted pyramid of industrial
processing. Some of them are virtually indispensable and others can only be
replaced at great cost. Most agricultural products sold by the Third World
are in overabundant supply, although periodic shortages of items like coffee
push prices up and can lead the noticeable cuts in consumption. For mineral
raw materials, the issue is almost never one of catastrophic supply
disrup-tions, but of short- and medium-term market fluctuations which are
dispropor-tionately costly to the economy as a whole. Thus, sudden price increases of
the kind experienced in 1973 can accelerate inflationary pressures, requiring
the economy as a whole to run below capacity. In the medium term, insufficient
investment in new supplies due to political uncertainty and prolonged spells
of depressed prices can lead to long periods of high prices requiring costly
adjustment by some of the affected industries.
Table A - II,3 compares the dependance of the EC with that of the US and
Japan as regards some critical minerals. Many of these are used in small
quantities to produce special steels and metals without which sophisticated
engineering is impossible. Except for a few products like lead, mercury and
sulphur (all of which need to be recycled for environmental reasons so that
demand for new supplies is declining), the Community's dependence is nearly
100%. The position of the
us
is not as much more favorable as has often beenoften suggested. The real differencelies in the possession of strategic
stockpiles by the US which in some cases amount to several years'supplies.
The abundance of physical reserves is clearly demonstrated by table A - II,4.
The only item to cause some concern is silver ( an important industrial
catalyst). For some materials found on the ocean floor, the socalled
mangane-se nodules (manganemangane-se, copper, cobalt, nickel), known supplies are already
practically unlimited.
The importance of the LDC's
World reserves of minerals are concentrated in the large continental or
sub-continental countries. where a great deal of exploration has been done
the
us,
USSR, Canada, Australia and South Africa (see table II,2,followingpage). Reserves in developing countries appear to be crucial only for a few
meterials : tin, bauxite (alumina)·, cobalt, columbium,and nickel. The table
also reveals the high concentration of reserves in a few countries : in most
cases five countries hold 2/3 or more of total reserves. In only four cases
do the.three largest holders of reserves control somewhat less than half of
II,2 GEOGRAPHIC DISTRIBUTION OF KNOWN AND ESTIMATED RESERVES (1977) Raw
materials Iron Copper Lead Tin Zinc Aluminium Titanium Chromium Colbalt Colombium Manganese Molybden Nickel Tungsten Vanadium Bismuth Silver Mercury Platinum Asbestos
Percentage of 3 Percentage of 5 biggest produc. biggest produc.
59.4 76.7 44.9 58.7 47.8 61.4 50.2 68.1 45.8 58.6 62.8 58.6 58.2 81.8 96.9 97.9 63.0 83.5 88.5 95.3 90.5 97.7 74.3 86.9 48.8 70.6 69.6 80.6 94.9 97.2 47.9 60.9 54.9 76.5 65.2 78.3 99.5 99.9 81.3 91.8
Share of certain countries in %
USSR (30.2), Brazil (17.5), Canada (11.7), Australia (11.5), India (5.8)
USA (18.5), Chile (18.5), USSR (7.9), Peru (7), Canada (6.8), Zambia (6.4)
USA (20.8), Australia (13.8), USSR (13.2), Canada (9.5), RSA (4.1)
Indonesia (23.6), China (14.8), Thailand (11.8), Bolivia (9.7), Malaysia (8.2), USSR (6.1), Brazil (5.9)
Canada (18.7), USA (14.5), Australia (12.6) USSR (7.3), Ireland (5.5)
Guinea (33.9), Australia (18.6), Brazil ~0.3
Jamaica (6.2), India (5.8), Guyana (4.1), Cameroon (4.1)
Brazil (23.2), Canada (18.7), India (16.3), Norway (15.2), Australia (8.4), USA (7.4) RSA (74.1), Rhodesia (22.2), USSR (0.6), Finland (0.6), India (0.4), Brazil (0.3) Madagascar (0.3) 1
Zaire (30.3), New Caledonia (18.8), USSR 03.9) Philippines (12.8), Zambia (7.7), Cuba (7.3) Brazil (76.6), USSR (6.4), Canada (5.5), Zaire (3.8), Uganda (3.0), Niger (3.0) RSA (45.0), USSR (37.5), Australia (8.0), Gabon (5.0), Brazil (2.2)
USA (38.4), Chile (27.8), Canada (8.1), USSR (6.6), China (6.0)
New Caledonia (18.8), Cuba (17.8), Canada (12.8), USSR (11.0), Indonesia (10.8) China (46.9), Canada (12.1), USSR (10.6), North Korea (5.6), USA (5.4), Australia (2.7) USSR (74.8), RSA (18.7), Chile (1.4), Austra-lia (1.4), Venezuela (0.9), India (0.9) Australia (20.7), Bolivia (16.3), USA (10.9), Canada (6.5), Mexico (6.5) Peru (5.4)
USSR (26.2), USA (24.8) Mexico (13.9), Canada (11.6), Peru (10.0)
Spain (38.4), USSR (18.2), Yugoslavia (8.6), China (4.5), Mexico (4.5), Turkey (4.5) RSA (82.3), USSR (15.6), Canada (1.6), Colombie (0.3), USA (0.1)
Canada (42.7), USSR (32.3), RSA (6.3), Rhodesia (6.3), USA (4.2)
Source CEC: Perspectives d'evolution structurelled'ici 1990 les mati~res premi~res.
Doc. de travail du 16 fevrier 1979.
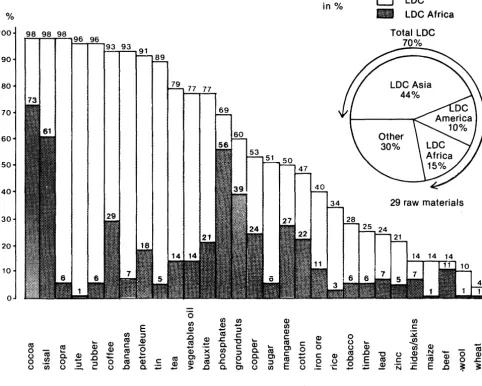
Looking notatreserves but at current production shares of developing countries in key bulk mineral commodities, we find a predominance of developing count-ries only for tin (see table A- II,S). The picture looks quite different, however, if we consider the LDC share of exports rather than production. As table II,3 indicates, the LDC share of world exports is 50% or higher for 17 of the 29 commodities listed, and for 5 of the 8 minerals listed. African developing countries are dominant world suppliers of cocoa, sisal and phos-phates, and are substantial exportersof coffee,groundnuts, manganese and cotton (see also table A- II,6).
II,3
SHARES OF THE LDC'S AND OF AFRICA* IN WORLD EXPORTS OF 29 RAW MATERIALS· AVERAGE 1974·1976
%
100
90
80
70
60
50
40
in%
77 77
CJ
LDCIll
LDC AfricaTotal LDC
70%
29 raw materials
30
20
10
0
·o
rnrn 2 Q)
E ~ (;i Q) :::I rn Q)
rn :::I D c:: c:: Q)
~ «S Q) «S ~ .r. ~ ~ «S ~
«S Q) c:: c.. Q) c::
«S Q) 0 Q) c:: ~ 0) 0
0
-m
~ D ~ «S X rn c.. «S2
(.) c.. Q) c:: ~
:::I 0 :::I c.. 0) c:: c::
-~ D
-
Q) «S 0) 0 «S 00 0 "S :::I 0 «S c:: «S .r:. 0 0
.& Q) ~ :::I E ~
(.) rn (.) ~ (.) D c..
-
> D c.. 0) (.) rn (.)Source: World Bank: Commodity Trade and Price Trends (1978 Edition); Report no EC-166/78. • :Without South Africa (RSA) but Namibia included.
rn
c::
0 ..:::.::::
(.) ~
..se
(.) Q) rn Q)
D N 0 Q) «S "'0 (.) Q)
·ca
~D E «S c:: :2 0
(.) Q)
.8 ~ .N E ~
-~
-
.r. DThe importance of LDCs to the Community comes out more sharply if we look not at world export shares but at their shares in Community imports
(see table II,4 following page and A- II,7 and A- II,S).
(;i
Q)
[image:46.588.67.549.242.628.2]~ ~
I
11,4 ORIGIN OF PRIMARY PRODUCTS IMPORTED BY THE EUROPEAN COMMUNITY : 1973-1978 (in %) Food products Non-food Mineral Fuels Non-ferrous Total 2+3+6 !Total primary agricultural products metals I products 1 raw materials 3 4 6 7I
2 I 1973 1978 1973 1978 1973 1978 1973 1978 1973 1978 1973I
1978I
1973I
1978I
IM~ORTS EXTRA-EC 100 100 100 100 100 100 100 100 100 100 100I
10~00
I
100 -INDUSTRIALISED COUNT., I I 41.8 39.2 45.8 49.) 43.8 41.9 4.5 6.1 38.5 44.6 34.8 1 46.4, 27.5 27.8 II
North America I 25.8 25.4 14.3 17.3 25.0 25.7 2.5 1.5 19.2 16.9I
17.9119.4117.3 13.8I
I SOUTH AFRICA, AUS-8.0 5.1 13.1 11.3 8.3 14.9 0.5 1.2 9.6 12.3 11.1' 12.5, 6.6 4.8 TRALIA, N.ZEALANDI
9.7I
9.31 7.8 7.6 -STATE TRADING 7.5 4.8 11.2 12.0 6.3 5.4 6.6 8.3 9.6 7.7 COUNTRIES 34.3I
31 • 8I
54.5 60. 1 -DEVELOPING COUNTRIES 42.7 50.7 29.0 27.3 37.5 37.8 88.9 79.1I
42.3 35.4I i
A number of elements stand out. Thus, the LDC share in EC food imports has
risen by 10% since 1972 to 53% , due in part to the substitution of Community
production for the temperate-zone products previously bought from other
industrialised countries and to higher prices achieved by items like coffee.
The LDC share in agricultural raw materials for industrial use has remained
steady at the relatively modest level of around 27% of the total. Prices
for these products tend to be depressed due to the threat from synthetic
substitutes, while some industrial country exports, notably timber, enjoy
good market conditions. Note that the value of these industrial raw materials
is little more than a fifth of the food imports from LDC's. The next group,
ores and related mineral products, is again dominated by the industrial
countries (57% as against 38% for the LDC's, with no significant change
since 1972.
The modest value of these imports - they amount to about 3 weeks worth of
energy imports - puts into perspective exaggerated fears about efforts by the
LCD~sto achieve better prices through unilateral cartels or commodity agreements. The figures are very similar as regardsimports of non-ferrous
metals.
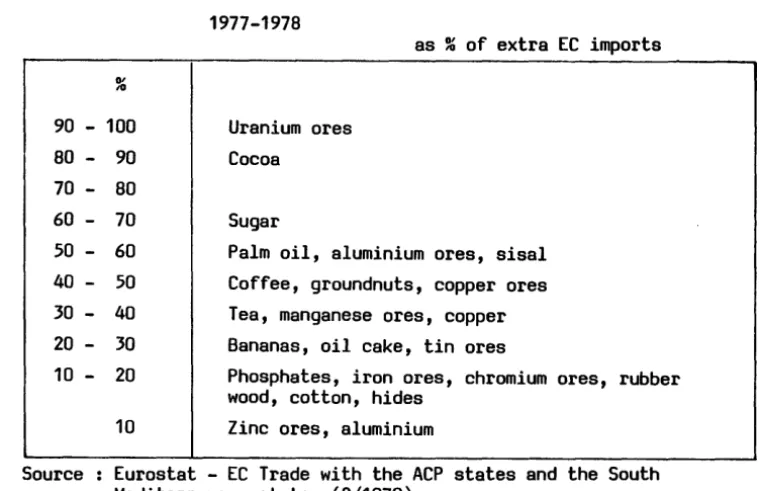
As we saw earlier in the description of market structures, global figures
for the LDC share, of EC imports are to some extent misleading. For
a number of products (see table II,5 following page), LDC'sare virtually
the only suppliers of the Community. This table need not be taken as an
indication of dependence, but as a means of identifying sectors of world trade
which lend themselves to special North-South arrangements (see below). Most
of the products with a high percentage LDC share in fact come under the export
earningsstabilisation scheme (STABEX) of the Lome convention and/or are the
object of efforts to conclude commodity agreements under the UNCTAD Integrated