A STUDY ON THYROID PROFILE IN TYPE 2
DIABETES MELLITUS
Submitted to
The Tamil Nadu Dr. M.G.R. Medical University
M.D. DEGREE EXAMINATION
BRANCH – I (GENERAL MEDICINE)
THE TAMIL NADU DR. M.G.R. MEDICAL
UNIVERSITY
CHENNAI
BONAFIDE CERTIFICATE
This is to certify that "A STUDY ON THYROID PROFILE
IN TYPE 2 DIABETES MELLITUS" is a bonafide work done by
Dr. SRIVIDYA. G, post graduate student, Department of General
Medicine, K.A.P. VISWANATHAM GOVT. MEDICAL COLLEGE,
TRICHY-1 under my guidance and supervision in partial fulfillment of
regulations of The Tamilnadu Dr. M.G.R. Medical University for the
award of M.D. Degree Branch I, (General Medicine) during the
academic period from May 2008 to March 2011.
Prof. Dr.G.ANITHA M.D.,
Associate professor, unit-IV, Dept of medicine,
K.A.P.V. Government Medical College
Trichy -1
Prof. Dr. S.PANNEER SELVAM M.D.,
Professor and Head Of the Dept,
Dept of medicine, K.A.P.V. Government Medical College
Trichy -1
DEAN
DECLARATION
I Dr. Srividya. G solemnly declare that the dissertation titled,
“A STUDY ON THYROID PROFILE IN TYPE 2 DIABETES MELLITUS” is a bonafide work done by me at Annal Gandhi Memorial hospital affiliated to K.A.P.V. Government medical college,
Trichy-1,during 2008-2010 under the guidance and supervision of
Prof Dr. S. PANNEER SELVAM, M.D., HOD/PROF of medicine and
unit chief, Prof Dr. G. ANITHA, M.D., The dissertation is submitted
to The Tamilnadu Dr.M.G.R.Medical University, towards the partial
fulfillment of requirement for the award of M.D degree (Branch-I) in
General Medicine.
Place : Trichirappalli Dr. Srividya .G
ACKNOWLEDGEMENT
It is with gratitude that I thank Prof. Dr.S. PANNEER SELVAM M.D.,
Prof &Head of the Department of The Medicine for his constant guidance
and encouragement he has given to me. I thank Professor
Dr.G. ANITHA, M.D., for her guidance is getting the best out of myself.
I thank Assistant professor Dr.S. JOSEPH PANEERSELVAM
D.DIAB, M.D., for his assistance throughout my work. I thank
Dr.N. Sundar M.D., and Dr.K. Namasivayam, M.D., who have
supported me in the work. I also thank college Dean who had shown keen
interest in our academic activities. Finally I thank colleagues and patients
who were involved in the study.
CONTENTS
SL.
NO. TITLE
PAGE NO.
1. INTRODUCTION 1
2. AIM 3
3. REVIEW OF LITERATURE 4
4. MATERIALS AND METHODS 25
5. RESULTS AND ANALYSIS 30
6. DISCUSSION 58
7. SUMMARY 66
8. CONCLUSION 68
ANNEXURES
INTRODUCTION
Diabetes mellitus is a common endocrine disorder which involves
multiple organ systems and leads to significant morbidity and mortality
due to accompanying complications. Diabetes mellitus has been defined
as "A metabolic syndrome characterised by chronic hyperglycaemia and
disturbance of carbohydrate, fat and protein metabolism associated with
absolute or relative deficiency in insulin secretion and or insulin
action".The metabolic dysregulation associated with DM causes
secondary pathophysiologic changes in multiple organ systems that
impose a tremendous burden on the individual with diabetes and on the
health care system.
Much has been accomplished in the field of diabetes and what has
been troubling everyone is the large macrovascular and micro vascular
complications of diabetes involving kidneys, eyes, blood vessels, nerves
and heart.
Thyroid diseases are also a common endocrinopathy seen in the
adult population. Thyroid hormones are intimately involved in cellular
Thus excess or deficit of either insulin or thyroid hormones could
result in the functional derangement of the cellular metabolism.
The present work is a modest attempt to study the prevalence of
AIM OF THE STUDY
1. To study the prevalence of thyroid disorders in patients with type 2
diabetes mellitus.
2. To study the distribution of thyroid disorders in patients with type
2 diabetes mellitus regarding age, sex, duration of diabetes, family
history, regularity of treatment and BMI.
3. To evaluate the relationship between glycemic control and
REVIEW OF LITERATURE
Diabetes mellitus is characterised by chronic hyperglycemia with
disturbances of carbohydrate, fat, and protein metabolism resulting from
defects in insulin secretion, insulin action, or both.1
PROBLEM STATEMENT
In the first edition of the IDF Diabetes Atlas, released in 2000, the
estimated global diabetes prevalence was 151 million. Now the estimated
diabetes prevalence for 2010 has risen to 285 million, representing 6.4%
of the world’s adult population, with a prediction that by 2030 the
number of people with diabetes will have risen to 438 million. Far from
being a disease of higher income nations, diabetes is very much a disease
associated with poverty and disproportionately affecting the lower
socio-economic groups3. Although the prevalence of both type 1 and type 2 DM
is increasing worldwide, the prevalence of type 2 DM is rising much
more rapidly because of increasing obesity and reduced activity levels as
countries become more industrialised. Previously a disease of the middle
aged and elderly, type 2 diabetes has recently escalated in all age groups
Unfavourable modification of lifestyle and dietary habits with
urbanisation are the most important factors for the development of
diabetes. The percentage of diabetic cases in urban areas is projected to
increase from 54% in 1995 to 73% by the year 2025.5 According to IDF
(2009), India has the highest number of people suffering from diabetes
mellitus with 50.8 million and spends 2.8 billionUS$ or 1% of the global
health expenditure for diabetes and related problems6. United Nations in
2006 in Resolution 61/225 stated that “diabetes is a chronic, debilitating
and costly disease associated with severe complications, which poses
severe risks for families, Member States and the entire world”.7
HISTORY
Diabetes is as old as medicine. Early evidence of description of
symptoms of diabetes recorded in the Ebers papyrus, 1550 B.C.8 Arateus
(30-90 AD), coined the term diabetes, meaning “siphon,” to explain the
“liquefaction of the flesh and bones into urine”. In Greek this word means
'to run through' that describes 'unquenchable thirst' seen in association
with this disease.9 Shushruta (Circa 600AD) noted this disease in
Ayurveda and described it as "Madhumeha".10
In 1869, Paul Langerhans, published in his dissertation on
islets of Langerhans shortly after his death.11,12 In 1889, Minkowski and
Von Mering, in Strassburg, Germany, discovered the central role of the
pancreas in diabetes.13 In 1910, Jean de Meyer suggested that the
pancreatic secretion lacking in diabetic state to be called as “Insulin” to
denote it’s origin from insulae of Langerhans.14 Banting and Charles Best
in 1921, extracted insulin from dog's pancreas.15 The first chemical
application of insulin was on 14 year old Leon and Thompson, a patient
of diabetic ketoacidosis in January 1922 in Canada. This discovery
revolutionized the management of diabetes. Oral hypoglycaemic drugs
were introduced by Frank and Fuchs in 1955.8
DESCRIPTION OF DIABETES MELLITUS
When fully expressed, diabetes is characterized by fasting
hyperglycemia, but the disease can also be recognized during less overt
stages, most usually by the presence of glucose intolerance. Diabetes may
present with characteristic symptoms such as thirst, polyuria,blurring of
vision,weight loss and polyphagia.Hyperglycemia sufficient to cause
pathologic functional changes may quite often be present for a long time
before the diagnosis is made.1 Patients may revert to having impaired
glucose regulation or even normal glycemia, particularly in recent-onset
In type 1 diabetes, after a short period of insulin treatment, there
may be a variable period when insulin is no longer required for survival
and glucose tolerance may improve, the so-called honeymoon period.
Eventually such patients do need insulin treatment for survival.17
Etiologic Classification of diabetes mellitus2
I. Type 1 diabetes
A. Immune mediated
B. Idiopathic
II. Type 2 diabetes
III. Other specific types
A. Genetic defects of β - cell function
B. Genetic defects in insulin action
C. Diseases of the exocrine pancreas
D. Endocrinopathies
E. Drug - or chemical induced
F. Infections
G. Uncommon forms of immune-mediated diabetes
IV. Gestational diabetes mellitus (GDM)
The majority of cases of diabetes fall into two broad
etiopathogenetic categories, now called type 1 and type 2 diabetes.
TYPE 1 DIABETES MELLITUS
Type 1 diabetes is the form of the disease due primarily to β-cell
destruction in which insulin is required for survival. It is characterized by
the presence of anti-GAD, anti-islet cell, or antiinsulin antibodies, which
reflects the autoimmune processes that have led to β-cell destruction.18,19
TYPE 2 DIABETES MELLITUS
Type 2 diabetes is the most common form of diabetes. Insulin
resistance and abnormal insulin secretion are central to the development
of type 2 DM.2 Patients with type 2 diabetes usually have insulin
resistance and relative, rather than absolute, insulin deficiency and are
associated with progressive β-cell failure with increasing duration of
diabetes20 The risk of developing type 2 diabetes increases with age,
obesity, physical inactivity and family history of diabetes.1 The disease
DIAGNOSTIC CRITERIA FOR DIABETES MELLITUS22
Symptoms of diabetes plus random plasma glucose concentration
200 mg/dl (11.1 mmol/l). Random is defined as any time of day without
regard to time since last meal. The classic symptoms of diabetes include
polyuria, polydipsia and unexplained weight loss (or)
FPG 26 mg/dl (7.0 mmol/l). Fasting is defined as no caloric intake
for at least 8 hours. (or)
2 hours post load glucose 200 mg/dl (11.1 mmol/l) during an
OGTT. The test should be performed as described by WHO, using a
glucose load containing the equivalent of 75 gm anhydrous glucose
dissolved in water.
In the absence of unequivocal hyperglycaemia these criteria should
be confirmed by repeat testing on a different day. FPG is the most reliable
and convenient test for identifying DM in asymptomatic individuals.
HbA1C is not currently recommended to diagnosis of diabetes.
IMPAIRED GLUCOSE TOLERANCE1
Defined as 2 hours values in the oral glucose tolerance test (OGTT)
between 140 and 199mg/dl (7.8 and 11.1 mmol/L). Glucose tolerance is
above the conventional normal range but lower than the level diagnostic
arterial disease. IGT is more frequent in obese persons and often is
associated with hyperinsulinemia and insulin resistance.
IMPAIRED FASTING GLUCOSE1
Defined as fasting plasma glucose concentrations of 100 to 125
mg/dL (5.6 to <7.0 mmol/L). IFG is also a stage of impaired glucose
homeostasis with fasting glucose levels were above normal but below
those diagnostic for diabetes.
ACUTE COMPLICATIONS OF DM2
Diabetic ketoacidosis (DKA) and hyperglycemic hyperosmolar
state (HHS) are acute complications of diabetes. DKA primarily occurs in
type 1 DM but, can also occur in type 2 DM. HHS is primarily seen in
individuals with type 2 DM. Both disorders are associated with absolute
or relative insulin deficiency, volume depletion, and acid-base
abnormalities.
CHRONIC COMPLICATIONS OF DM2
The vascular complications of DM are divided into microvascular
(retinopathy, neuropathy, nephropathy) and macrovascular complications
[coronary artery disease (CAD), peripheral arterial disease (PAD),
such as gastroparesis, infections, and skin changes. The microvascular
complications of both type 1 and type 2 DM result from chronic
hyperglycemia. Evidence implicating a causative role for chronic
hyperglycemia in the development of macrovascular complications were
inconclusive. Other factors (dyslipidemia and hypertension) also play
important roles in macrovascular complications.
DYSLIPIDEMIA IN DIABETES
The dyslipidemia in type 2 diabetes and insulin resistance typically
consists of elevated triglycerides and decreased HDL cholesterol level23
and of qualitative abnormality in the LDL structure, i.e., decreased size
and increased density of the LDL particle.
METABOLIC SYNDROME AND OBESITY25
The metabolic syndrome (syndrome X, insulin resistance
syndrome) consists of a constellation of metabolic abnormalities that
confer increased risk of cardiovascular disease (CVD) and diabetes
mellitus (DM). Diagnosis of the metabolic syndrome requires the
presence of at least three of the following five criteria26
1. Elevated fasting plasma glucose levels (>110 mg/dL)
2. Visceral obesity (waist circumference >35 inches in women
3. Hypertension (>130/85 mm Hg)
4. Hypertriglyceridemia (>150 mg/dL)
5. Low high-density lipoprotein (HDL) cholesterol
(<40 mg/dL in men and <50 mg/dL in women)
THYROID
The thyroid (Greek thyreos, shield, plus eidos, form) consists of
two lobes that are connected by an isthmus. It is located anterior to the
trachea between the cricoid cartilage and the suprasternal notch. Four
parathyroid glands, which produce parathyroid hormone are located
posterior to each pole of the thyroid.27
The normal thyroid gland secretes sufficient amounts of the thyroid
hormones triiodothyronine (T3) and tetraiodothyronine (T4, thyroxine) to
normalize growth and development, body temperature, and energy levels.
Calcitonin, the second type of thyroid hormone, is important in the
regulation of calcium metabolism.28
BIOSYNTHESIS OF THYROID HORMONES27
Iodide, ingested from food, water, or medication, is rapidly
absorbed from intestine and enters an extracellular fluid pool. Transport
membrane sodium/iodide symporter (NIS). At the apical cell membrane a
second I- transport enzyme called pendrin is present. Iodide is oxidized
by thyroidal peroxidase to iodine that rapidly iodinates tyrosine residues
within the thyroglobulin molecule to form monoiodotyrosine (MIT) and
diiodotyrosine (DIT). This process is called iodide organification.Two
molecules of DIT combine within the thyroglobulin molecule to form
L-thyroxine (T4). One molecule of MIT and one molecule of DIT
combine to form T3. T4, T3, MIT, and DIT are released from
thyroglobulin by exocytosis and proteolysis of thyroglobulin at the apical
colloid border. Most of the hormone released is thyroxine. Most of the T3
circulating in the blood is derived from peripheral metabolism of T4.
Both hormones are bound to plasma proteins, including thyroxine
binding globulin (TBG); transthyretin (TTR); and albumin. The plasma
binding proteins increase the pool of circulating hormone, delay hormone
clearance, and may modulate hormone delivery to selected tissue sites.
DEIODINASES27
T4 is converted to T3 by the deiodinase enzyme.
¶ Type I deiodinase, which is located primarily in thyroid, liver,
¶ ype II deiodinase has a higher affinity for T4 and is found
primarily in the pituitary gland, brain, brown fat, and thyroid
gland.
¶ Type III deiodinase inactivates T4 and T3 and is the most
important source of reverse T3 (r T3)
PHYSIOLOGICAL EFFECTS OF THYROID HORMONES29
ª Heart: Increases number of β adrenergic receptors. Enhances
response to catecholamines
ª Adipose tissue: Stimulate lipolysis
ª Muscle: Increases protein breakdown
ª Bone: Promote growth and development
ª Nervous system: Promote normal brain development
ª Gut: Increases carbohydrate absorption
ª Lipoprotein: Stimulate LDL receptors
ª Others: Increases metabolic rate and oxygen consumption
REGULATION OF THYROID AXIS27
The thyroid axis is a classic example of an endocrine feedback
loop. TRH stimulates pituitary production of TSH, which, in turn,
EXOGENOUS AND ENDOGENOUS FACTORS SUPPRESSING
TSH SECRETION30
Dopamine antagonists, Somatostatin, Dobutamine,
Glucocorticoids, Interleukins, TNF-α, Thyroid hormones and Phenytoin.
FACTORS ASSOCIATED WITH ALTERED BINDING OF
THYROXINE BY THYROXINE-BINDING GLOBULIN30
Increased Binding
Pregnancy, Oral contraceptives, Infectious hepatitis, Cirrhosis,
HIV, Acute intermittent porphyria and Tamoxifen.
Decreased Binding
Androgens, Large doses of glucocorticoids, acromegaly, Nephrotic
syndrome, Major systemic illness and Psychiatric illness.
FACTORS ASSOCIATED WITH DECREASED CONVERSION
OF T4 TO T330
Fetal life, Caloric restriction, Hepatic disease, Major Systemic
illness, Propylthiouracil, Glucocorticoids, Propranolol, Iodinated X-ray
contrast agents, Amiodarone and Selenium deficiency.
HYPOTHYROIDISM
Hypothyroidism is the condition resulting from a lack of effects of
Symptoms
Tiredness, weaknes, dry skin, feeling cold, hair loss, difficulty
concentrating and poor memory, constipation, weight gain with poor
appetite, dyspnea, hoarse voice, menorrhagia (later oligomenorrhea or
amenorrhea), paresthesia and impaired hearing.
Signs
Dry coarse skin; cool peripheral extremity, puffy face, hands, and
feet (myxedema), diffuse alopecia, bradycardia, peripheral edema,
delayed tendon reflex relaxation, carpal tunnel syndrome and serous
cavity effusions27
METABOLIC ABNORMALITIES IN HYPOTHYROIDISM
Hypothyroidism is associated with a reduction in glucose disposal
to skeletal muscle and adipose tissue and also associated with reduced
gluconeogenesis. The net effect of these influences is usually minimal on
serum glucose levels. Degradation of insulin, is slowed and the sensitivity
to exogenous insulin may be increased.32 Both the synthesis and the
degradation of lipid are depressed in hypothyroidism with a net effect of
accumulation of LDL and triglycerides. HDL concentrations and Plasma
SUBCLINICAL HYPOTHYROIDISM
Defined as a low-normal free T4 but a slightly elevated serum TSH
level. The TSH elevation in such patients is modest, with values typically
between 4 and 15 mU/L.33 Rates of progression to overt hypothyroidism
ranges from 3% to 8% per year, higher rates seen in individuals with
initial TSH concentration greater than 10 mU/L and those with positive
anti-TPO antibodies.34 The association of mild hypothyroidism with an
increase in risk for atherosclerotic heart disease has been shown by some,
but not others.35,36
HYPERTHYROIDISM27
Hyperthyroidism is a state when thyrotoxicosis occurs because of
sustained over production of hormones by thyroid gland.
Symptoms
Heat intolerance and sweating, palpitation, fatigue and weakness,
weight loss with increased appetite, diarrhea, polyuria, oligomenorrhea,
and loss of libido.
Signs
Tachycardia; atrial fibrillation in the elderly, tremor, goiter, warm,
moist skin, muscle weakness, proximal myopathy, lid retraction or lag
METABOLIC ABNORMALITIES IN HYPERTHYROIDISM
Preexisting diabetes mellitus may be aggravated, one cause being
accelerated turnover of insulin.37 Both lipogenesis and lipolysis are
increased in thyrotoxicosis, but the net effect is lipolysis, as reflected by
an increase in the plasma concentration of free fatty acids and glycerol
and a decrease in serum cholesterol level.Triglyceride levels are usually
slightly decreased.38
SUBCLINICAL HYPERTHYROIDISM
There are no signs of thyrotoxicosis but the serum TSH is subnormal
despite normal serum free T4 concentration.37 Subclinical
hyperthyroidism may accelerate bone loss in postmenopausal women39
and increases the incidence of atrial arrhythmias including atrial
fibrillation in elderly patients.31
DIABETES AND THYROID DISEASES
Diabetes mellitus and thyroid diseases are the two common
endocrinopathies seen in the adult population. Insulin and thyroid
hormones are intimately involved in cellular metabolism. Excess or
deficit of either of these hormones could result in the functional
EFFECT OF DIABETES ON THYROID FUNCTION
In euthyroid individuals with diabetes mellitus, the serum T3
levels, basal TSH levels and TSH response to thyrotropin releasing
hormone (TRH) may all be strongly influenced by the glycemic status.41
Poorly controlled diabetes, both Type 1 and Type 2, may induce a “Low
T3 state” characterized by low serum total and free T3 levels, increase in
reverse T3 (r T3) but near normal serum T4 and TSH concentrations.42
Low serum T3 is due to reduced peripheral conversion of thyroxine (T4)
to tri-iodothyronine (T3) via 5’ monodeiodination reaction and may
normalize with improvement in glycemic status but even with good
diabetes control, the normal nocturnal TSH peak may not be restored in
C-peptide negative patients.43
EFFECT OF DIABETES MELLITUS ON THYROID DISEASES
Dysthyroid optic neuropathy (DON) resulting in blindness is the
most threatening complication of Graves’ orbitopathy (GO). It is due to
the compression of optic nerve by enlarged extraocular muscles at the
orbital apex.
Incidence of DON in patients with diabetes mellitus is higher than
that seen in control “GO” group and the recovery after treatment is also
diabetic patient owing to the vasculopathy making it more susceptible to
the pressure effect.44
EFFECT OF HYPERTHYROIDISM ON GLYCEMIC STATUS
Graves disease is the commonest cause of hyperthyroidism. While
Graves disease may be associated with type 1 diabetes in polyglandular
autoimmune syndrome, thyrotoxicosis by itself is diabetogenic. Frank
diabetes occurs in 2-3%, when hyperthyroidism develops in normal
individuals. In known diabetic patients hyperthyroidism causes
deterioration of glycemic control status.42
These changes are due to alteration in following systems
1. Gastrointestinal System
In hyperthyroidism, there is accelerated gastric emptying, enhanced
intestinal glucose absorption and an increase in portal venous blood
flow.44
2. Insulin Secretion
Insulin secretion decreases in hyperthyroidism.45,46 Insulin
clearance rate is reported to be increased by about 40%.47 Long term
thyrotoxicosis has been shown to cause beta cell dysfunction resulting in
3. Endogenous Glucose Production
In hyperthyroidism the endogenous glucose production is greatly
increased by a variety of mechanisms: (a) there is an increase in the
availability of gluconeogenic precursors( lactate, glutamine, alanine and
FFA) stimulating hepatic gluconeogenesis;49 (b) Inhibition of glycogen
synthesis;50 (c) Upregulation of GLUT-2 glucose transporters protein
expression in the hepatocyte;51 (d) Increased secretion and exaggerated
effects of glucagon and adrenaline on liver cells.49
4. Glucose utilization
In adipocytes isolated from rats, the sensitivity of glucose transport
and utilization to insulin has been found to be normal, increased or
decreased.45 In skeletal muscle, there is a preferential increase in glucose
uptake and lactate formation . This is due to increase in GLUT-1 and
GLUT-4 transporters52, increased glycogenolysis due to beta adrenergic
stimulation49, increased activity of hexokinase and 5
phosphofructokinase.53
Thus the net effect of changes occurring at various levels such as
gastrointestinal tract, beta cells, hepatocytes, adipocytes and skeletal
EFFECT OF HYPOTHYROIDISM ON GLYCEMIC STATUS
In hypothyroidism, the synthesis and release of insulin is
decreased.46 The rate of hepatic glucose output is decreased probably due
to reduced gluconeogenesis. A post receptor defect has been proposed to
explain the decrease in insulin stimulated glucose utilization in peripheral
tissues.49 The net effect is an increased risk of recurrent hypoglycemia in
a diabetic individual.54
ASSOCIATION BETWEEN DIABETES MELLITUS AND
THYROID DISORDERS
Celani MF et al in their study found that abnormal TSH values in
type 2 diabetic patients found before tight glycemic control reverted to
normal values with adequate treatment of diabetes with OHA or insulin.
They suggested that the diagnosis of thyroid dysfunction in type 2
diabetes should be delayed until improvement of metabolic status.55
Proces S et al in their study found that in diabetic patients TSH was
lower than in non diabetic subjects. They concluded that besides known
parameters such as age and drugs, thyroid function tests can also be
Warren RE et al in their study found that serum thyrotropin (i.e.
baseline TSH) is a better predictor of thyroid dysfunction than thyroid
autoantibodies in people with diabetes.57
Vondra K et al in their study found that prevalence of thyroid
disease in diabetic patients is 2-3 times higher than in non diabetic
subjects. It raises with age and is strongly influenced by female gender
and autoimmune diabetes. They even recommended thyroid disease
screening and diagnosis in patients with diabetes mellitus.58
Abdel Rahman et al in their study found that overall prevalence of
thyroid diseases was 12.5% in type 2 diabetes mellitus group. The study
suggested that diabetic patients should be screened for asymptomatic
thyroid dysfunction.59
Perros P et al in their study found that the prevalence of thyroid
disease was 13.4% in a randomly selected group of 1310 adult diabetic
patients attending a diabetic clinic. They suggested that thyroid function
should be screened annually in diabetic patients to detect asymptomatic
thyroid dysfunction which is increased in frequency in a diabetic
population.60
Smithson MJ in his study found that the prevalence of thyroid
disease (previously known and diagnosed as a result of screening) in the
practice patients was 10.8%. He concluded by suggesting that screening
for thyroid disease should be considered in patients receiving diabetes
care in community.61
Zdrojewicz Z et al in their study found that there was no difference
in thyroid gland function in patients with non insulin dependent diabetes
mellitus (type 2) and different therapies have no influence on thyroid
gland function.62
Parr JH et al in their study found that improvement in long term
metabolic control did not influence free thyroid hormone levels in well
controlled and moderately-poor controlled diabetics taking insulin.63
Chubb SA et al in their study found that none of those patients with
type 2 diabetes diagnosed as subclinical hypothyroidism had overt
hypothyroidism when restudied after 5 years. So they concluded that
subclinical hypothyroidism is a common but incidental finding and
MATERIALS AND METHODS
The present study titled "Thyroid Profile in Type 2 Diabetes
Mellitus"was carried out in the Department of Medicine and in the
Department of Diabetology, AGMGH, Trichy.
¯ Study design: Cross sectional study.
¯ Period of study: January 2010 to October 2010
¯ Materials: Questionnaire, BMI calculation, Blood pressure, FBS,
PPBS, Blood Urea, Serum creatinine,ECG, Thyroid profile (FT3,
FT4 and TSH
¯ Study group: The study group included 100 persons with known
type 2 diabetes without known thyroid disorders attending the
outpatient departments who met the inclusion criteria.
Inclusion Criteria
Known type 2 diabetes mellitus subjects who gave informed
consent to participate in the study.
Exclusion Criteria
E Patients not willing for study
E Patients with known thyroid disease
E Patients with acute illness (sepsis, acute MI, severe heart failure,
recent admission in intensive care unit)
E Patients with hepatic dysfunction
E Patients with psychiatric illness.
E Pregnancy
E Patients on treatment with drugs interfering with thyroid function
(amiodarone, propranolol, corticosteroids and oral contraceptives)
All patients in the study group were selected without any bias for
sex, duration, severity or control of diabetes. A thorough history was
recorded with particular emphasis on symptoms of hypothyroidism and
hyperthyroidism. The presence of associated illness like coronary artery
disease, hypertension and cerebrovascular accident were noted. Family
history regarding diabetes mellitus and treatment history of oral
hypoglycaemics or insulin along with duration was also included.
A thorough general and systemic examination was carried.
BMI calculation
Body mass index (BMI) is calculated with height and weight of the
subject using the following formula.
BMI = weight(kg)2
Blood sugar
Both fasting and postprandial blood sugar are estimated by
Trinder’s (Glucose oxidase) method and read at 505/670 nm.
Renal function test
The Blood Urea in this study was estimated using DAM method
(Diacetyl Monoxime). Serum creatinine was estimated using Modified
Jaffe’s method.
Thyroid Profile
Estimation done in fasting serum sample.
Methods used:
1. TSH - Ultrasensitive sandwich chemi luminescent immuno assay
2. FT3 & FT4 - Competitive chemi luminescent immuno assay.
DEFINITIONS
Diabetes Mellitus
The WHO in consultation with an expert committee of the
American Diabetes Association has approved the following diagnostic
patients on antidiabetic therapy were also considered as having diabetes
mellitus.
Fasting: No caloric intake for atleast 8 hours.2-3 days of unrestricted
carbohydrated diet prior to the test. No physical activities during the
procedures.
Systemic Hypertension (As per the JNC VII Guidelines): Subjects on
medications for hypertension and those who had a systolic blood pressure
of 140 mmHg and / or diastolic blood pressure 90 mmHg were
considered to have hypertension.
Diabetes mellitus is considered as Coronary Heart Disease equivalent.
BMI (WHO criteria for Asian population): is used for classifying the
subjects according to the weight status.
BMI Group BMI (kg/m2)
Underweight < 18.5
Normal weight 18.5-24.9
Overweight 25-29.9
Obesity 30.0
Thyroid profile
Reference values: FT3 : 1.7-4.2 ρg/ml
FT4: 0.7- 1.8 ηg/dl
v Overt hypothyroidism is defined as TSH >5.5 µIU/ml with FT4 < 0.7 ηg/dl.
v Subclinical hypothyroidism is defined as TSH > 5 µIU/ml with
normal FT3 and FT4 levels
v Overt hyperthyroidism is defined as TSH < 0.3 µIU/ml with
FT4 > 1.8 ηg/dl
v Subclinical hyperthyroidism is defined as TSH < 0.3 µIU/ml
RESULTS AND ANALYSIS
The present study titled “Thyroid Profile in Type 2 Diabetes
Mellitus” was undertaken in the Department of Medicine and Department
of Diabetology, AGMGH, trichy over a period of 10 months from
January 2010 to October 2010.
The study sample included 100 type 2 diabetes patients in the
Table-1
Age Distribution of Cases
Age Group (yrs) No. of cases Percentage
Upto 40 24 24
41-60 58 58
61 & above 18 18
Age Distribution of Cases
24
58
18
0 10 20 30 40 50 60 70
Upto 40 41-60 61 & above
Age
P
e
rc
en
tage
Table-2
Distribution of Cases According to Sex
Sex No. of cases Percentage
Male 52 52
Female 48 48
Total 100 100.0
Table -3
Distribution According to Duration of Diabetes Mellitus
Duration of DM No. of cases Percentage
Upto 5 Years 74 74
6 – 10 Years 20 20
More than 10
Years 6 6
Distribution According to Duration of Diabetes Mellitus
74 20
6
0 10 20 30 40 50 60 70 80
Upt
o 5
Yea rs
6 - 10
Yea
rs
Mor
e th
an 1
0 Ye
ars D u ra ti on o f DM Percentage
Table-4
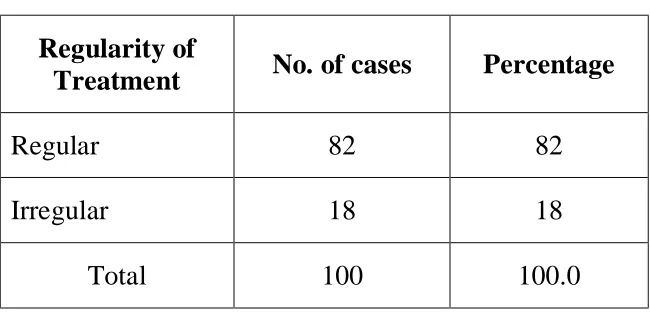
Distribution According to Regularity of treatment
Regularity of
Treatment No. of cases Percentage
Regular 82 82
Irregular 18 18
Distribution According to Regularity of treatment
82
18
0 10 20 30 40 50 60 70 80 90 100
Regular Irregular
Regularity of Treatment
P
e
rce
n
ta
ge
Table – 5
Distribution according to Family history of Diabetes Mellitus
Family H/O DM No. of cases Percentage
Yes 44 44
No 56 56
Distribution according to Family history of Diabetes Mellitus 44 56 0 10 20 30 40 50 60 70 80 90 100 P e rc e n ta ge Yes No
Fam ily H/O DM
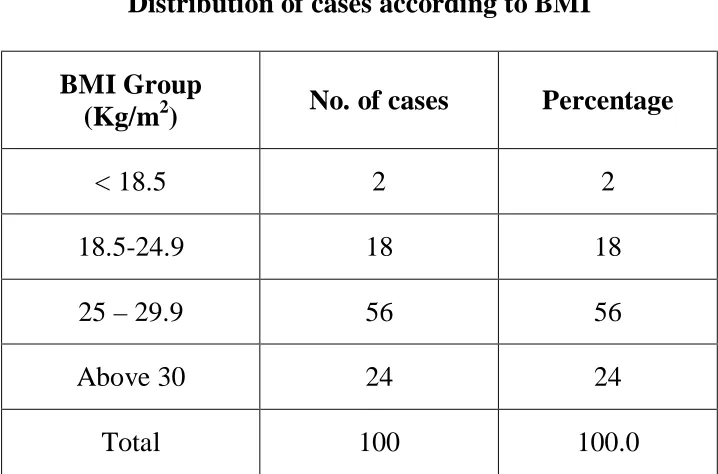
Table-6
Distribution of cases according to BMI
BMI Group
(Kg/m2) No. of cases Percentage
< 18.5 2 2
18.5-24.9 18 18
25 – 29.9 56 56
Above 30 24 24
Total 100 100.0
Among the study population, 80% (80/100) were overweight and
Distribution of cases according to BMI 2 18 56 24 0 10 20 30 40 50 60 70 80 90 100 P e rc e n ta ge
< 18.5 18.5-24.9 25 - 29.9 Above 30 BMI group kg/m2
Table-7
Distribution of Cases according to Abnormal thyroid profile
Thyroid Function Number Percentage
With normal thyroid
profile 80 80
With abnormal
thyroid profile 20 20
Distribution of Cases according to Abnormal thyroid profile
80 20
Table – 8
Distribution of thyroid diseases
Thyroid Profile No. of cases Percentage
Normal 80 80
Overt
hyporthyroidism 3 3
Subclinical
hypothyroidism 11 11
Over
hyperthyroidism 1 1
Subclinical
hyper thyroidism 5 5
Total 100 100.0
The above table shows that 11% (11/100) of the patients had report
suggestive of sub clinical hypothyroidism and 5% (5/100) of the patients
Distribution of thyroid diseases
80 3
11 1 5
Normal Overt hyporthyroidism
DISTRIBUTION OF THYROID DISEASE IN THE POPULATION STUDIED
NO NAME AGE/SEX
YEARS FT3 ρg/ml FT4 ηg/dl TSH
µIU/ml DIAGNOSIS
1 Mr. Palanisamy 60/M 3.2 1.4 7.92 Subclinical hypothyroidism
2 Mrs. Vasanthakumari 40/F 2.72 0.86 6.24 Subclinical hypothyroidism
3 Mrs. Rajalakshmi 57/F 2.57 0.86 5.924 Subclinical hypothyroidism
4 Mrs. Maanvizhi 46/F 2.81 1.2 5.938 Subclinical hypothyroidism
5 Mr. Periyasamy 72/M 2.18 1.05 9.696 Subclinical hypothyroidism
6 Mr. Annadurai 36/M 2.99 1.07 6.139 Subclinical hypothyroidism
7 Mr. Kumar 53/M 2.69 0.85 9.611 Subclinical hypothyroidism
8 Mrs. Shanmugarani 52/F 2.61 1.0 5.671 Subclinical hypothyroidism
9 Mr.Maniyan 59/M 3.15 1.1 6.434 Subclinical hypothyroidism
10 Mrs.Velmani 45/F 2.6 0.88 8.9 Subclinical hypothyroidism
11 Mrs.Amsavalli 42/F 2.79 0.65 9.8 Subclinical hypothyroidism
12 Mrs.Dhanushkodi 50/F 2.59 0.63 38.43 Overt hypothyroidism
13 Mrs.Meenambigai 42/F 1.5 0.46 > 150 Overt hypothyroidism
14 Mrs.Pushpa 56/F 2.33 0.71 35.64 Overt hypothyroidism
15 Mrs.Tamilarasi 40/F 3.2 1.88 0.28 Subclinical hyperthyroidism
16 Mrs.Uma maheswari 40/F 3.62 1.8 <0.01 Subclinical hyperthyroidism
17 Mrs.Jaya 39/F 3.17 1.3 0.205 Subclinical hyperthyroidism
18 Mrs.Suganthi 37/F 2.66 1.11 0.21 Subclinical hyperthyroidism
19 Mrs.Latha 35/F 3.03 1.32 0.172 Subclinical hyperthyroidism
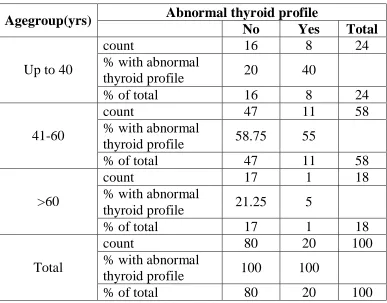
Table – 9
Abnormal thyroid profile Vs Age group
Abnormal thyroid profile Agegroup(yrs)
No Yes Total
count 16 8 24
% with abnormal
thyroid profile 20 40
Up to 40
% of total 16 8 24
count 47 11 58
% with abnormal
thyroid profile 58.75 55
41-60
% of total 47 11 58
count 17 1 18
% with abnormal
thyroid profile 21.25 5
>60
% of total 17 1 18
count 80 20 100
% with abnormal
thyroid profile 100 100
Total
% of total 80 20 100
P> 0.05 Not significant
Out of 20 patients with abnormal thyroid profile, 1patient (5%) were found to be of age 61years and more, 11 (55%) were found to be of age between 41-60 years and 8 (40%) were found to be 40 years or less.
Compared with normal thyroid profile group it has no statistical
Abnormal thyroid profile Vs Age group 20 58.75 21.25 40 55 5 0 10 20 30 40 50 60 70 80 90 100
Up to 40 41-60 >60
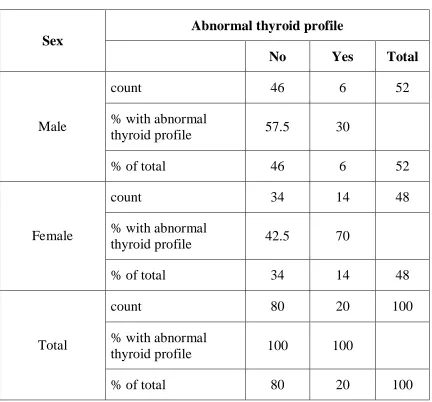
Table-10
Abnormal thyroid profile Vs Sex
Abnormal thyroid profile Sex
No Yes Total
count 46 6 52
% with abnormal
thyroid profile 57.5 30
Male
% of total 46 6 52
count 34 14 48
% with abnormal
thyroid profile 42.5 70
Female
% of total 34 14 48
count 80 20 100
% with abnormal
thyroid profile 100 100
Total
% of total 80 20 100
P <0.05 Significant
Out of 20 patients with abnormal thyroid profile, 30%(6) were
males and 70%(14) were females. Compared with normal thyroid profile
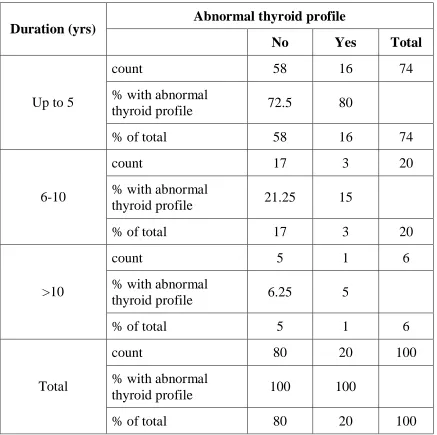
Table-11
Abnormal thyroid profile Vs Duration of Diabetes
Abnormal thyroid profile Duration (yrs)
No Yes Total
count 58 16 74
% with abnormal
thyroid profile 72.5 80
Up to 5
% of total 58 16 74
count 17 3 20
% with abnormal
thyroid profile 21.25 15
6-10
% of total 17 3 20
count 5 1 6
% with abnormal
thyroid profile 6.25 5
>10
% of total 5 1 6
count 80 20 100
% with abnormal
thyroid profile 100 100
Total
% of total 80 20 100
p>0.05 not Significant
Among the 20 patients with abnormal thyroid profile, 5%(1) had
Diabetes more than 10 years, 15%(3) had duration between 6-10 years
Abnormal thyroid profile Vs Duration of Diabetes 72.5 21.25 6.25 80 15 5 0 10 20 30 40 50 60 70 80 90 100
Up to 5 6 to10 >10
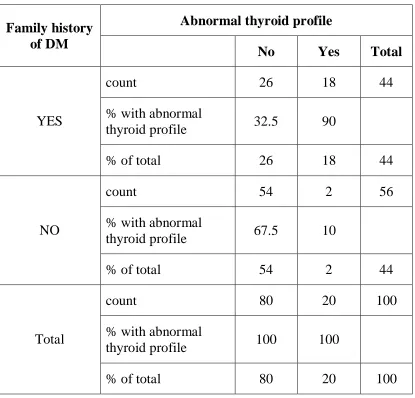
Table-12
Abnormal thyroid profile Vs Family history of Diabetes
Abnormal thyroid profile Family history
of DM
No Yes Total
count 26 18 44
% with abnormal
thyroid profile 32.5 90
YES
% of total 26 18 44
count 54 2 56
% with abnormal
thyroid profile 67.5 10
NO
% of total 54 2 44
count 80 20 100
% with abnormal
thyroid profile 100 100
Total
% of total 80 20 100
P < 0.05 Significant
18 (90%) out of 20 patients with thyroid abnormality had family
history of diabetes, but only 32.5%(26) of normal thyroid group had it.
Abnormal thyroid profile Vs Family history of Diabetes 32.5 67.5 90 10 0 10 20 30 40 50 60 70 80 90 100 P e rc e n ta ge Normal Abnormal Family History DM
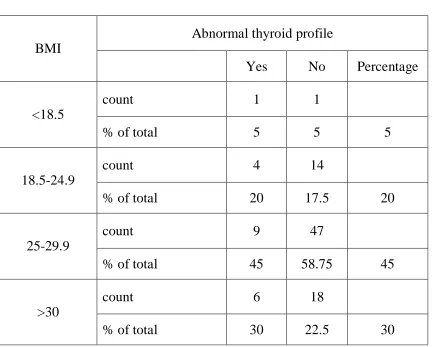
Table-13
Abnormal Thyroid Profile Vs BMI
Abnormal thyroid profile BMI
Yes No Percentage
count 1 1
<18.5
% of total 5 5 5
count 4 14
18.5-24.9
% of total 20 17.5 20
count 9 47
25-29.9
% of total 45 58.75 45
count 6 18
>30
% of total 30 22.5 30
p >0.05 Not significant
Out of 20 persons with abnormal thyroid profile, 75%(15) were
overweight and obese. Compared with normal thyroid profile group this
Distribution of Abnormal thyroid profile according to BMI
5
20
45 30
DISCUSSION
Diabetes mellitus is the most common endocrine disorder which
involves multiple organ systems and leads to significant morbidity and
mortality due to accompanying complications. Thyroid diseases are also a
common endocrinopathy seen in the adult population. Thyroid hormones
are intimately involved in cellular metabolism. Thus excess or deficit of
either insulin or thyroid hormone could result in the functional
derangement of the cellular metabolism.
In the present study patients of diabetes mellitus were taken from
Diabetic Outpatient Department, AGMGH, Trichy, over a period of 10
months from January 2010 to October 2010 and they were evaluated for
altered thyroid profile.
AGE DISTRIBUTION
In the present study of 100 type 2 diabetic patients, 24 patients
(24%) were up to 40 years, 58 patients (58%) were between 41-60 years
and 18 patients (18%) were 61 years or more. This shows that the disease
was more prevalent between 41-60 years of age.
This observation was similar to WHO report which predicts that
in the developed countries, in India and developing countries the highest
increase would occur in the age group of 45-65 year of age group.65
This observation is also similar to Kapur et al, who reported that
maximum number of cases were diagnosed between 40 and 59 year of
age with no significant difference between the genders.66
GENDER DISTRIBUTION
In the present study 52% (52 nos) of the studied population were
males and 48% (48 nos) were females. Male to Female ratio was 1.08:1.
This observation was similar to Jali et al68 and Flatau E et al69 who
reported that diabetes was more prevalent in men than in women.
This is in contrast to Arthur M. Michalek et al who reported that
prevalence of diabetes among women was higher than in men.67 Sample
size in our study is too small. This might have affected the results.
DURATION OF DIABETES MELLITUS
In the present study, majority of cases that is 74% (74/100) had
durationof diabetes up to 5 years, 20% (20/100) of patients had duration
between 6-10 years and 6% (6/100) of patients had duration of illness
more than 10 years.Majority of people are in the age group between 41 to
FAMILY HISTORY OF DIABETES MELLITUS
In the present study, 44% (44nos) of patients had family history of
diabetes and the remaining 56% (56nos) had no family history.
This study is similar to that of Tattersal and Fojans70 and
Vishwanthan.71 Vishwanthan et al conducted a study among 107 subjects.
Out of 73 subjects who gave positive family history diabetes, 19 subjects
(26%) later developed diabetes.
REGULARITY OF TREATMENT
In the present study, out of 100 subjects of the study group 82%
(82/100) were on regular treatment and 18% (18/100) were irregular.
Asha et al observed that 97% of type 2 diabetics were on
antidiabetic agents and most were using them irregularly.72
Kaur et al observed that oral anti diabetic drug compliance rate was
62.9% in diabetic population.73 The difference in our study may be due to
small sample size.
BMI
Among the study population, 80%(80/100) were overweight and
obese; 18%(18/100) had normal BMI. Mc Larty et al reported that
prevalence of IGT in subjects of all age group increased with rising
Yon Gik et al reported that the prevalence of diabetes mellitus and
IGT increased with rising BMI and with increase in WHR.75 Both these
studies support our findings.
ABNORMAL THYROID PROFILE
In the present study, 20% (20) of the total 100 patients with
diabetes mellitus had abnormal thyroid profile. The present study is
similar to Abdel-Rahman et al who in his study of 908 type 2 diabetic
patients found that the prevalence of thyroid disease was 12.5%, 6.6% of
whom were newly diagnosed and 5.9% had known thyroid dysfunction.
The prevalence of thyroid disease in the non diabetic control group was
6.6%.59
Chubb et al in a cross-sectional study of 420 patients with type 2
diabetes mellitus found that 8.6% of patients had subclinical
hypothyroidism.64
Smithson M J in his study found that the prevalence of thyroid
disease in the entire population of diabetic patients registered in the
general practice was 10.8%. In the control group of non diabetics, the
D.H. Akbar et al in their study of 100 type 2 diabetics found that
the prevalence of thyroid dysfunction was 16% and in control group of
non diabetics, it was 7%.76
Zdrojewicz et al in their study of 75 diabetic patients found that
there was no differences in thyroid gland function between patients with
type 2 diabetes mellitus and non diabetics. This study contradicts our
findings.62
DISTRIBUTION OF THYROID ABNORMALITIES
In the present study, 11% (11) of the patients had report suggestive
of sub clinical hypothyroidism and 5% (5) of the patients had report
suggestive of sub clinical hyperthyroidism. This study was similar to
Abdel-Rahman et al who in their study of 908 type 2 diabetic patients
found that 10.3% of patients had hypothyroidism (overt and sub clinical)
and 1.7% of patients had hyperthyroidism (overt and sub clinical).59
Smithson et al in their study of 233 diabetes mellitus patients found
that 11 patients were found to have undiagnosed thyroid disease, out of
which 9 were having hypothyroidism (overt and sub clinical) and 2 were
having hyperthyroidism (overt and sub clinical).61
Celani MF et al in their study of 290 type 2 diabetes mellitus
out of which 48.3% had subclinical hypothyroidism, 24.2% had subclinicl
hyperthyroidism, 23.1% had overt hypothyroidism and 4.4% had overt
hyperthyroidism.55
In the present study, diabetic patients, when compared with the
control group of normal patients in Whickham Study77 and a 20 years
follow-up of Whickham survey by Vanderpump MP et al78 shows that the
prevalence of altered thyroid profile in the study group is significant
(p=0.0064).
The presence of altered thyroid profile in diabetic patients may be
due to the fact that:
In euthyroid individuals with diabetes mellitus, the serum T3
levels, basal TSH levels and TSH response to thyrotropin releasing
hormone (TRH) may all be strongly influenced by the glycemic status.41
Poorly controlled diabetes may also result in impaired TSH
response to TRH or loss of normal nocturnal TSH peak.43 It may be
related to older age of the type 2 DM patients.64
SIGNIFICANCE OF AGE IN PATIENTS WITH ABNORMAL
THYROID PROFILE
Among the patients with abnormal thyroid profile, each 45% (9/20)
difference, when compared between patients with normal and abnormal
thyroid profile it has no significance (p = 0.987)
Vondra et al in his study found that thyroid diseases in diabetic
patients is 2-3 times higher than in nondiabetic subjects; it raises with
age, and is strongly influenced by female gender and autoimmune
diabetes. This also contradicts with our findings.58
ANALYSIS OF SEX DISTRIBUTION IN CASES WITH
ABNORMAL THYROID PROFILE
In the present study 85.7% (12/14) patients were found to be
female compared to 14.3% (2/12) male in the group with abnormal
thyroid profile.
Compared between patients with normal and abnormal thyroid
profile this is statistically significant (p=0.031).
Celani MF et al, Arthur M. Michalek et al and Abdel-Rahman et al in
their study found that the prevalence of thyroid dysfunction was
significantly higher in the female than in the male diabetic patients.55,59,67
Also Vondra et al and Cardoso et al found significant correlation
ANALYSIS OF BMI IN CASES WITH NORMAL AND
ABNORMAL THYROID PROFILE
Out of 20 patients with abnormal thyroid profile, 45% (9/20) were
overweight and 30% (6/20) were obese. There was no significant
correlation between BMI and abnormal thyroid profile (p > 0.05).
Fan W et al observed in their study that obese individuals have
normal levels of thyroxine(T4) and thyroid stimulating hormone(TSH)
but, increased levels of triiodothyronin(T3) in a minority of subjects.81
The findings contradict with Process et al who in their study found that
besides known parameters such as age and drugs, thyroid-function tests
SUMMARY
This study aimed at estimating the prevalence of thyroid
dysfunction in type 2 Diabetes mellitus patients and also to find out it’s
correlation with various risk factors. The study sample included 100 type
2 diabetic patients presented in the outpatients department. Each patient
was assessed clinically and by laboratory investigations.
Primary observations regarding thyroid profile in patients with type
2 diabetes mellitus. In the present study, 20%(20 nos) of patients with
type 2 diabetes mellitus had abnormal thyroid profile.
In patients with abnormal thyroid profile(20 nos), most common
abnormality was subclinical hypothyroidism(55%) followed by
subclinical hyperthyroidism(25%).
Our study showed significant correlation between abnormal thyroid
profile and gender, duration of diabetes and family history of diabetes.
In persons with abnormal thyroid profile, 70% were females and
30% were males. This is statistically significant. The prevalence of
thyroid abnormalities is more common in females than in males.
No significant correlation was found between altered thyroid
Additional observations in the study group of type 2 diabetes
mellitus subjects:
In the present study, patients ranged from 35 to 79 years of age.
Maximum number of patients were in the age group between 41 to 60yrs
(58%).
Majority (82%) of patients were on regular treatment and 18%
were on irregular treatment.
44% patients were having family history of diabetes mellitus and
56% had no family history.
CONCLUSION
♦ Prevalence of thyroid dysfunction is more common among type 2
diabetes mellitus patients than in general population.
♦ Prevalence of thyroid dysfunction in patients with type 2 diabetes
mellitus is higher in females than in males
♦ There is no significant correlation between age, duration of
diabetes, family history of diabetes and BMI.
♦ Routine screening for thyroid dysfunction in type 2 diabetes
mellitus patients may be justified especially in females because the
progression to overt thyroid dysfunction is associated with
significant morbidity including the adverse effects on glycemic
control, lipid profile, bone mineral density and cardiovascular
LIMITATIONS
• Study population was small.
• Associated thyroid autoimmunity was not evaluated due to
constraints.So it was not able to refine the spectrum of thyroid
dysfunction in type 2 diabetics.
• Follow up study was not done. So the natural history of subclinical
thyroid dysfunction and its effect on various parameters could not
BIBLIOGRAPHY
1. Peter H Bennett, William C Knowlap. Definition, diagnosis and
classification of diabetes. Joslin’s diabetes mellitus 14th
edition,2005: 331-337.
2. Alvin C .Powers. Diabetes mellitus. Harrison’s principles of
internal medicine 17th edition,2008: 2275-2304.
3. IDF Diabetes atlas 4th edition, 2009.
4. WHO(2003), Tech. Rep. Ser., N 916.
5. WHO(2002), Health situation in the South East Asia Region
1998-2000, New Delhi.
6. International Diabetes Federation, 20th October 2009, Montreal.
7. UN. 83rd plenary meeting, 20th December 2006. 61st session;
Agenda 113.
8. Donald M Barnett, Leo P. Krall. History of diabetes. Joslin’s
diabetes mellitus 14th edition,2005: 1-17.
9. Porter R. The greatest benefit to mankind, al medical history of
humanity. New York: WW Norton, 1997:71.
10. Schadewaldt H. The history of diabetes mellitus. In: Van
Englehardt D, ed. Diabetes, its medical and cultural history. Berlin:
Springer Verlag, 1987:43–100.
11. Langerhans P. Beitrage zur mikroskopischen Anatomie der
12. Morrison H. Translation and introductory essay. Langerhans P.
Contributions to the microscopic anatomy of the pancreas. Bull
Inst Hist Med 1937;5:259–269.
13. Minkowski O. Historical development of the theory of pancreatic
diabetes (introduction and translation by R. Levine). Diabetes
1989;38:1–6.
14. De Meyer J. Contribution l'ude de la pathogie du diabete
pancreatique. Archive Internationale de Physiologie 1909:121–180.
15. Banting FG, Best CH. The internal secretion of the pancreas. J Lab
Clin Med 1922;7:251–266.
16. Savage PJ, Bennion LJ, Bennett PH. Normalization of insulin and
glucagon secretion in ketosis-resistant diabetes mellitus with
prolonged diet therapy. J Clin Endocrinol Metab 1979;49:830–833.
17. Agner T, Damm P, Binder C. Remission in IDDM: prospective
study of basal C-peptide and insulin dose in 268 consecutive
patients. Diabetes Care 1987;10:164–169.
18. Gavin JR III, Alberti KGMM, Davidson MB, et al. Report of the
Expert Committee on the Diagnosis and Classification of Diabetes
Mellitus. Diabetes Care 1997;20:1183–1197
19. WHO Consultation Group. Definition, diagnosis and classification
of diabetes mellitus and its complications, 2nd ed. Part 1: Diagnosis
and classification of diabetes mellitus WHO/NCD/NCS/99.
20. Turner RC, Cull CA, Frighi V, et al. Glycemic control with diet,
sulfonylurea, metformin, or insulin in patients with type 2 diabetes
mellitus: progressive requirement for multiple therapies (UKPDS
49). UK Prospective Diabetes Study (UKPDS) Group. JAMA
1999;281:2005–2012.
21. Dabelea D, Pettitt DJ, Jones KL, et al. Type 2 diabetes mellitus in
minority children and adolescents. An emerging problem.
Endocrinol Metab Clin North Am 1999;28: 709-29.
22. American Diabetes Association 2007, Criteria for the diagnosis of
diabetes mellitus. Diabetes care, Volume 30, Supplement 1,
anuary 2007.
23. Howard BV. Pathogenesis of diabetic dyslipidemia. Diabetes Rev
1995;3:423–432.
24. Siegel RD, Cupples A, Schaefer EJ, et al. Lipoproteins,
apolipoproteins, and low-density lipoprotein size among diabetics
in the Framingham offspring study. Metabolism 1996;45:1267–
1272.
25. Robert H. Eckel. The metabolic Syndrome. Harrison’s principles of
internal medicine 17th edition,2008:1509-1514.
26. Expert Panel on Detection, Evaluation, and Treatment of High
Blood Cholesterol in Adults. Executive Summary of the Third
Report of the National Cholesterol Education Program (NCEP)
Blood Cholesterol in Adults (Adult Treatment Panel III). JAMA
2001; 285:2486–2497.
27. J, Larry Jameson, Anthony P. Weetman. Disorders of thyroid
gland. Harrison’s principles of internal medicine 17th edition,
2008: 2224-2247.
28. Thyroid and Antithyroid drugs. Katzung Basic clinical
pharmacology 10th edition,2007: 618-634.
29. Physiological effects of thyroid hormones. William F. Ganong
Review of medical physiology 22nd edition: 317-332.
30. P.Reed Lorson, F. Davies. Quantitation of serum thyroid hormone
concentration. Williams textbook of Endocrinology 11th edition:
299-332.
31. Nikhil Tandon. API Text book of medicine 8th edition:1002-1010
32. Chidakel A, Mentuccia D, Celi FS: Peripheral metabolism of
thyroid hormone and glucose homeostasis. Thyroid 2005;
15:899-903.
33. Gregory A. Brent, P. Reed Larsen, Terry F. Davies.
Hypothyroidism and thyroiditis. Williams textbook of
Endocrinology 11th edition: 377-409.
34. Huber G, Staub J-J, Meier C, et al: Prospective study of the
spontaneous course of subclinical hypothyroidism: prognostic
value of thyrotropin, thyroid reserve, and thyroid antibodies. J Clin
35. Kvetny J, Heldgaard PE, Bladbjerg EM, et al: Subclinical
hypothyroidism is associated with a low-grade inflammation,
increased triglyceride levels and predicts cardiovascular disease in
males below 50 years. Clin Endocrinol (Oxf.) 2004; 61: 232-238
36. Cappola AR, Fried LP, Arnold AM, et al: Thyroid status,
cardiovascular risk, and mortality in older adults. JAMA 2006;
295:1033-1041.
37. F. Davies, P.Reed Lorson. Thyrotoxicosis. Williams textbook of
Endocrinology 11th edition: 333-368.
38. Silva JE: The thermogenic effect of thyroid hormone and its
clinical implications. Ann Intern Med 2003; 139:205-213.
39. Faber J, Galloe AM: Changes in bone mass during prolonged
subclinical hyperthyroidism due to L-thyroxine treatment: a
meta-analysis. Eur JEndocrinol 1994; 130:350-356.
40. R. Sathish,V. Mohan. Diabetes and Thyroid disease-A Review. Int
J of Diabetes in Developing countries 2003;23; 120-123.
41. Schlienger JL, Anceau A, Chabrier G, North ML,. Stephan F.
Effect of diabetic control on the level of circulating thyroid
hormones. Diabetologia. 1982;22;486-8
42. Donckier JE. Endocrine diseases and diabetes. In: Textbook of
Diabetes mellitus. Pickup JC, Williams G (eds), Blackwell
43. Coiro V, Volpi R, Marchesi C, et al. Influence of residual
C-peptide secretion on nocturnal serum TSH peak in well-controlled
diabetic patients. Clin. Endocrinal. 1997;47:305-10.
44. Kalmann R, Mourits M. Diabetes Mellitus: a risk factor in patients
with Grave’s orbitopathy. Br. J. Ophthalmol. 1999; 83: 463-465.
45. Taylor R, Muculloch A, Zeuzem S, Gray P, Clark F, Alberti G.
Insulin secretion, adipocyte insulin binding and insulin sensitivity
in thyrotoxicosis. Acta Endorcinol. 1985;109:96-103.
46. Ahren B, Lundquist I, Hedner P, Valdemassan S, Scheroten B.
Glucose tolerance and insulin and C-peptide responses after
various insulin secretions stimuli in hyperthyroid and hypothyroid
subjects before and after treatment diab. Res. Clin. Practice.
1985;2:95-103.
47. Randin J, Tappy L, Scazziga B, Jequier E, Felber J. Insulin
sensitivity and exogenous insulin clearance in Grave's disease.
Measurements by the glucose clamp technique and continuous
glucose calorimetry. Diabetes. 1986;35:178-81.
48. Bech K, Damsbo P, Eldrup E, et al. Beta cell function and glucose
and lipid oxidation in Grave's disease. Clin. Endocrinol. 1996;44:
59-66.
49. Dimitriadis G, Raptis S A. Thyroid hormone excess and glucose
intolerance. Exp Clin. Endocrinol. Diabetes. 2001; 109: