VALIDATED ANALYTICAL METHODS FOR THE SIMULTANEOUS ESTIMATION OF CEFPODOXIME PROXETIL AND AMBROXOL HYDROCHLORIDE BY UV SPECTROPHOTOMETRY AND RP-HPLC IN
BULK AND TABLET DOSAGE FORM Dissertation submitted to
The Tamil Nadu Dr. M.G.R Medical University Chennai- 600 032
In partial fulfillment for the award of Degree of MASTER OF PHARMACY
(Pharmaceutical Analysis)
Submitted by BHAVYASRI.M Register No. 26106121
Under the Guidance of
Prof. Dr.T.VETRICHELVAN, M.Pharm., Ph.D. Mrs. G. ABIRAMI, M. Pharm.
Principal & Head Assistant Professor
Department of Pharmaceutical Analysis
ADHIPARASAKTHI COLLEGE OF PHARMACY
(Accredited by“NAAC”with aCGPAof2.74on a four point scale atB Grade) MELMARUVATHUR-603 319
MAY-2012
VALIDATED ANALYTICAL METHODS FOR THE SIMULTANEOUS ESTIMATION OF CEFPODOXIME PROXETIL AND AMBROXOL HYDROCHLORIDE BY UV SPECTROPHOTOMETRY AND RP-HPLC IN
BULK AND TABLET DOSAGE FORM Dissertation submitted to
The Tamil Nadu Dr. M.G.R Medical University Chennai- 600 032
In partial fulfillment for the award of Degree of MASTER OF PHARMACY
(Pharmaceutical Analysis)
Submitted by BHAVYASRI.M Register No. 26106121
Under the Guidance of
Prof. Dr.T.VETRICHELVAN, M.Pharm., Ph.D. Mrs. G. ABIRAMI, M. Pharm.
Principal & Head Assistant Professor
Department of Pharmaceutical Analysis
ADHIPARASAKTHI COLLEGE OF PHARMACY
(Accredited by“NAAC”with aCGPAof2.74on a four point scale at B Grade) MELMARUVATHUR-603 319
CERTIFICATE
This is to certify that the research work entitled“VALIDATED ANALYTICAL
METHODS FOR THE SIMULTANEOUS ESTIMATION OF CEFPODOXIME
PROXETIL AND AMBROXOL HYDROCHLORIDE BY UV
SPECTROPHOTOMETRY AND RP-HPLC IN BULK AND TABLET
DOSAGE FORM” submitted to TheTamil Nadu Dr. M.G.R. Medical University
in partial fulfillment for the award of the Degree of the MASTER OF PHARMACY
(Pharmaceutical Analysis) was carried out by BHAVYASRI. M (Register No.
26106121)in the Department of Pharmaceutical Analysis under our direct guidance
and supervision during the academic year 2011-12.
Prof.Dr.T.Vetrichelvan, M. Pharm., Ph.D., Mrs. G. ABIRAMI, M. Pharm., Principal & Head, Assistant Professor,
Department of Pharmaceutical Analysis, Department of Pharmaceutical Analysis,
Adhiparasakthi College of Pharmacy, Adhiparasakthi College of Pharmacy, Melmaruvathur-603319. Melmaruvathur-603319.
Place:Melmaruvathur.
CERTIFICATE
This is to certify that the dissertation entitled “VALIDATED ANALYTICAL
METHODS FOR THE SIMULTANEOUS ESTIMATION OF CEFPODOXIME
PROXETIL AND AMBROXOL HYDROCHLORIDE BY UV
SPECTROPHOTOMETRY AND RP-HPLC IN BULK AND TABLET
DOSAGE FORM” is the bonafide research work carried out by BHAVYASRI.M
(Register No. 26106121) in the Department of Pharmaceutical Analysis,
Adhiparasakthi College of Pharmacy, Melmaruvathur which is affiliated to The
Tamil Nadu Dr. M.G.R. Medical University under the guidance of
Prof. Dr. T. VETRICHELVAN M. Pharm., Ph.D. & Mrs. G. ABIRAMI,
M. Pharm., Department of Pharmaceutical Analysis, Adhiparasakthi College of
Pharmacy, during the academic year 2011-2012.
Place:Melmaruvathur Prof. (Dr.) T. VETRICHELVAN, M. Pharm., Ph.D.,
Date: Principal & Head,
Dedicated to
My
ACKNOWLEDGEMENT
I honestly acknowledge HIS HOLINESS ARULTHIRU AMMA and
THIRUMATHI AMMA for their sacred blessings to perform and complete my project.
My heartful thanks to Mr. G. B. ANBALAGAN Managing Trustee, MAPIMS, Melmaruvathur for providing all the necessary facilities to carry out this work.
I got inward bound and brainwave to endure experimental investigations in model analytical methods, to this extent, I concede my inmost special gratitude and thanks to Prof. Dr. T. VETRICHELVAN M. Pharm., Ph.D. Principal & Head, Department of Pharmaceutical Analysis, & Mrs. G. ABIRAMI, M. Pharm.,
Assistant Professor, Department of Pharmaceutical Analysis, Adhiparasakthi College of Pharmacy, for the active guidance, innovative ideas, creative works, infinite helps, indulgent and enthusiastic guidance, valuable suggestions, a source of inspiration where the real treasure of my work.
I conceitedly take the dispensation to present my special wisdom of thanks to
Mrs. D. NAGAVALLI, M. Pharm., Ph.D., Associate professor,
Mr. K. ANANDAKUMAR, M. Pharm., Associate Professor, G. SHANKARI M. Pharm., Assistant professor for their persuasive support and timely lend a hand to complete this work.
I wish to thank lab technicians Mr. M. GOMATHI SANKAR, D. Pharm.,
andMrs. S. KARPAGAVALLI, D. Pharm.,for their help throughout the project.
I am indeed thanks to the Librarian Mr. M.SURESH, M.L.I.S.,for providing all reference books and to make this project a great success.
It’s the precise time for me to convey my profundity thanks to my friends and
Classmatesfor their support and suggestions during my work.
I am greatly obliged to my father Mr. A. MUTHUKUMAR, my mother
Mrs. VENKATALAKSHMI, my husband Mr. M. SURESH for their inspiration, guidance, moral support, constant prayers for my successful endeavours.
Above all I dedicate myself and my work to Almighty, who is the source of knowledge and for showering all his blessings and grace upon me.
CONTENTS
SECTION TITLE PAGE NO
1. INTRODUCTION 1
1.1. Analytical Chemistry 3
1.2. Ultra violet – Spectroscopy 11 1.3. High Performance Liquid Chromatography 21 1.4. ICH Guidelines for Analytical Method Validation 24 1.5. System Suitability Parameters 29 1.6. Pharmaceutical Statistics 32
2. LITERATURE REVIEW
2.1. Drug Profile 35
2.2. Reported Methods 41
3. AIM AND PLAN OF WORK 48
4. MATERIALS AND METHODS
4.1. Materials 50
4.2. Methods employed 53
4.2.1. UV Spectrophotometric methods 53 4.2.2. Reverse Phase- HPLC Method 58
5. RESULTS AND DISCUSSION
5.1. Simultaneous equation method 63 5.2. Area under the curve method 66 5.3. Derivative spectroscopic method 68 5.4. Reverse Phase-HPLC Method 71
6. SUMMARY AND CONCLUSION
6.1. UV Spectrophotometric methods 74 6.2. Reverse Phase-HPLC method 76
LIST OF FIGURES
FIGURE
NO SUBUJECT
1 IR SPECTRUM OF CEFPODOXIME PROXETIL 2 IR SPECTRUM OF AMBROXOL HYDROCHLORIDE
3 UV SPECTRUM OF CEFPODOXIME PROXETIL IN METHANOL AT235 nm (SIMULTANEOUS EQUATION METHOD)
4 UV SPECTRUM OF AMBROXOL HYDROCHLORIDE INMETHANOL AT 248, 308 nm (SIMULTANEOUS EQUATION METHOD)
5 OVERLAID SPECTRUM OF CEFPODOXIME PROXETIL ANDAMBROXOL HYDROCHLORIDE IN METHANOL (SIMULTANEOUS EQUATION METHOD)
6 CALIBRATION CURVE OF CEFPODOXIME PROXETIL INMETHANOL AT 235 nm (SIMULTANEOUS EQUATION METHOD)
7 CALIBRATION CURVE OF CEFPODOXIME PROXETIL INMETHANOL AT 248 nm (SIMULTANEOUS EQUATION METHOD)
8 CALIBRATION CURVE OF CEFPODOXIME PROXETIL INMETHANOL AT 308 nm (SIMULTANEOUS EQUATION METHOD)
9 CALIBRATION CURVE OF AMBROXOL HYDROCHLORIDE INMETHANOL AT 235 nm (SIMULTANEOUS EQUATION METHOD)
10 CALIBRATION CURVE OF AMBROXOL HYDROCHLORIDE INMETHANOL AT 248 nm (SIMULTANEOUS EQUATION METHOD)
11 CALIBRATION CURVE OF AMBROXOL HYDROCHLORIDE INMETHANOL AT 308 nm (SIMULTANEOUS EQUATION METHOD)
12 UV SPECTRUM OF CEFPODOXIME PROXETIL IN METHANOL AT229-238 nm (AREA UNDER THE CURVE METHOD)
13 UV SPECTRUM OF AMBROXOL HYDROCHLORIDE IN METHANOLAT 291-316 nm (AREA UNDER THE CURVE METHOD)
14 CALIBRATION CURVE OF CEFPODOXIME PROXETIL INMETHANOL AT 229-238 nm (AREA UNDER THE CURVE METHOD)
15 CALIBRATION CURVE OF CEFPODOXIME PROXETIL INMETHANOL AT 291-316 nm (AREA UNDER THE CURVE METHOD)
16 CALIBRATION CURVE OF AMBROXOL HYDROCHLORIDE INMETHANOL AT 229-238 nm (AREA UNDER THE CURVE METHOD)
17 CALIBRATION CURVE OF AMBROXOL HYDROCHLORIDE INMETHANOL AT 291-316 nm (AREA UNDER THE CURVE METHOD)
19 FIRST ORDER DERIVATIVE SPECTRUM OF AMBROXOLHYDROCHLORIDE IN METHANOL (DERIVATIVE SPECTROSCOPIC METHOD)
20 OVERLAID FIRST ORDER DERIVATIVE SPECTRUM OFCEFPODOXIME PROXETIL AND AMBROXOL HYDROCHLORIDE IN METHANOL (DERIVATIVE SPECTROSCOPIC METHOD)
21 CALIBRATION CURVE OF CEFPODOXIME PROXETIL INMETHANOL AT 279 nm (DERIVATIVE SPECTROSCOPIC METHOD)
22 CALIBRATION CURVE OF AMBROXOL HYDROCHLORIDE INMETHANOL AT 235 nm (DERIVATIVE SPECTROSCOPIC METHOD)
23 BLANK USING METHANOL
24 INITIAL SEPERATION CONDITIONS IN ACETONITRILE:METHANOL : WATER - pH 5.0 WITH ORTHO PHOSPHORIC ACID (30:50:20%V/V)
25 INITIAL SEPERATION CONDITIONS IN ACETONITRILE:METHANOL: WATER - pH 5.0 WITH ORTHO PHOSPHORIC ACID (30:50:20%V/V)
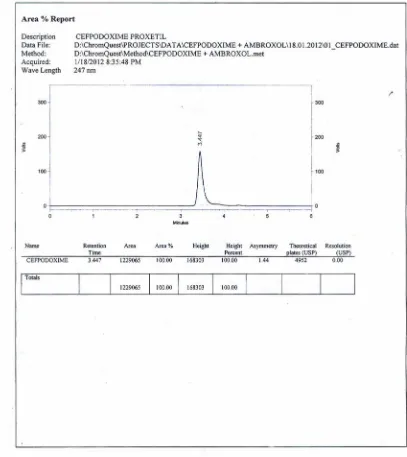
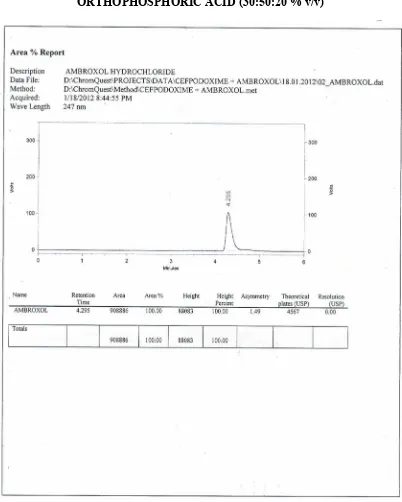
26 OPTIMIZED CHROMATOGRAM FOR CEFPODOXIME PROXETIL ANDAMBROXOL HYDROCHLORIDE
27 LINEARITY CHROMATOGRAM OF CEFPODOXIME PROXETIL ANDAMBROXOL HYDROCHLORIDE (70, 42 µg/ ml)
28 LINEARITY CHROMATOGRAM OF CEFPODOXIME PROXETIL ANDAMBROXOL HYDROCHLORIDE (80, 48 µg/ ml)
29 LINEARITY CHROMATOGRAM OF CEFPODOXIME PROXETIL ANDAMBROXOL HYDROCHLORIDE (90, 54 µg/ ml)
30 LINEARITY CHROMATOGRAM OF CEFPODOXIME PROXETIL ANDAMBROXOL HYDROCHLORIDE (100, 60 µg/ ml)
31 LINEARITY CHROMATOGRAM OF CEFPODOXIME PROXETIL ANDAMBROXOL HYDROCHLORIDE (110, 66 µg/ ml)
32 LINEARITY CHROMATOGRAM OF CEFPODOXIME PROXETIL ANDAMBROXOL HYDROCHLORIDE (120, 72 µg/ ml)
33 LINEARITY CHROMATOGRAM OF CEFPODOXIME PROXETIL ANDAMBROXOL HYDROCHLORIDE (130, 78 µg/ ml)
34 CALIBRATION CURVE OF CEFPODOXIME PROXETIL BY RP-HPLC 35 CALIBRATION CURVE OF AMBROXOL HYDROCHLORIDE BYRP-HPLC
36 CHROMATOGRAM FOR ANALYSIS OF FORMULATION FINECEF-AMTAB FOR LOW LEVEL DILUTIONS REPEATABILITY - 1
37 CHROMATOGRAM FOR ANALYSIS OF FORMULATION FINECEF-AMTAB FOR LOW LEVEL DILUTIONS REPEATABILITY - 2
38 CHROMATOGRAM FOR ANALYSIS OF FORMULATION FINECEF-AMTAB FOR LOW LEVEL DILUTIONS REPEATABILITY - 3
40 CHROMATOGRAM FOR ANALYSIS OF FORMULATION FINECEF-AMTAB FOR MID LEVEL DILUTIONS REPEATABILITY - 2
41 CHROMATOGRAM FOR ANALYSIS OF FORMULATION FINECEF-AMTAB FOR MID LEVEL DILUTIONS REPEATABILITY - 3
42 CHROMATOGRAM FOR ANALYSIS OF FORMULATION FINECEF-AMTAB FOR HIGH LEVEL DILUTIONS REPEATABILITY - 1
43 CHROMATOGRAM FOR ANALYSIS OF FORMULATION FINECEF-AMTAB FOR HIGH LEVEL DILUTIONS REPEATABILITY - 2
44 CHROMATOGRAM FOR ANALYSIS OF FORMULATION FINECEF-AMTAB FOR HIGH LEVEL DILUTIONS REPEATABILITY - 3
45 CHROMATOGRAM FOR 110% RECOVERY OF FORMULATIONFINECEF-AM TAB
46 CHROMATOGRAM FOR 120% RECOVERY OF FORMULATIONFINECEF-AM TAB
LIST OF TABLES
TABLE
NO SUBJECT
1 SOLUBILITY PROFILE OF CEFPODOXIME PROXETIL ANDAMBROXOL HYDROCHLORIDE IN POLAR AND NON POLAR SOLVENTS
2 OPTICAL CHARACTERSTICS OF CEFPODOXIME PROXETIL BYSIMULTANEOUS EQUATION METHOD (235, 248, 308 nm)
3 OPTICAL CHARACTERSTICS OF AMBROXOLHYDROCHLORIDE BY SIMULTANEOUS EQUATION METHOD (235, 248, 308 nm)
4 QUANTIFICATION OF TABLET FORMULATION (FINECEF-AMTAB) BY SIMULTANEOUS EQUATION METHOD (235, 248 nm)
5 QUANTIFICATION OF TABLET FORMULATION (FINECEF-AMTAB) BY SIMULTANEOUS EQUATION METHOD (235, 308 nm)
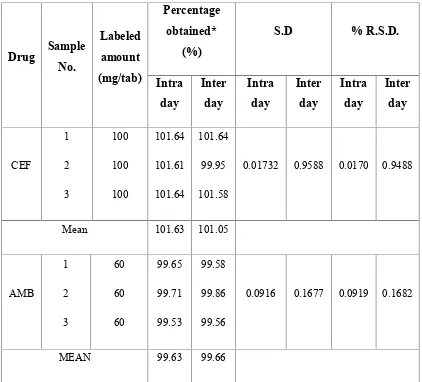
6 INTRA DAY AND INTER DAY ANALYSIS OF FORMULATION BYSIMULTANEOUS EQUATION METHOD (235, 248 nm)
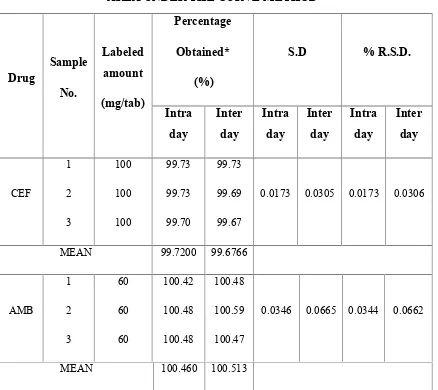
7 INTRA DAY AND INTER DAY ANALYSIS OF FORMULATION BYSIMULTANEOUS EQUATION METHOD (235, 308 nm)
8 RUGGEDNESS STUDY BY SIMULTANEOUS EQUATIONMETHOD (235, 248 nm)
9 RUGGEDNESS STUDY BY SIMULTANEOUS EQUATIONMETHOD (235, 308 nm)
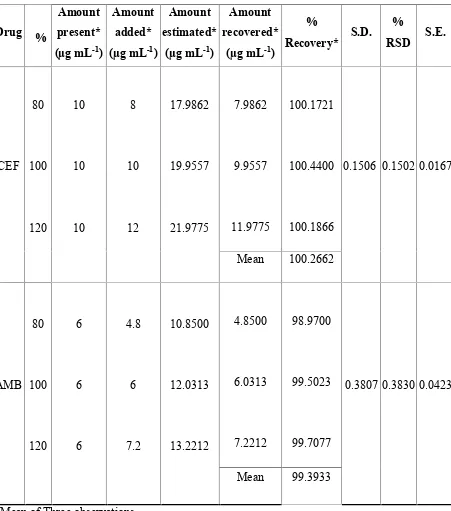
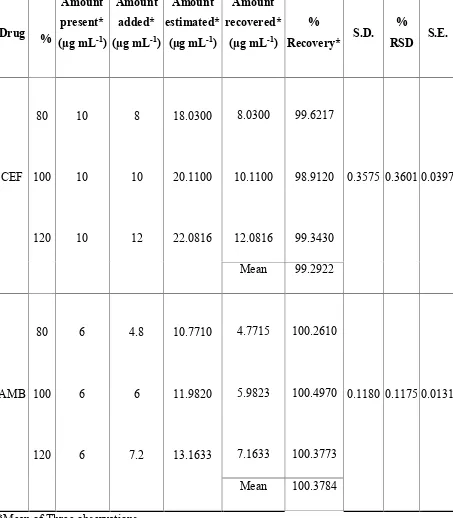
10 RECOVERY STUDY DATA OF 50% PRE ANALYSEDFORMULATION BY SIMULTANEOUS EQUATION METHOD (235, 248 nm)
11 RECOVERY STUDY DATA OF 50% PRE ANALYSEDFORMULATION BY SIMULTANEOUS EQUATION METHOD (235, 308 nm)
12 OPTICAL CHARACTERSTICS OF CEFPODOXIME PROXETIL BYAREA UNDER THE CURVE METHOD
13 OPTICAL CHARACTERSTICS OF AMBROXOLHYDROCHLORIDE BY AREA UNDER THE CURVE METHOD
14 QUANTIFICATION OF TABLET FORMULATION(FINECEF-AM TAB) AREA UNDER THE CURVE METHOD
15 INTRA DAY AND INTER DAY ANALYSIS OF FORMULATION BYAREA UNDER THE CURVE METHOD 16 RUGGEDNESS STUDY BY AREA UNDER THE CURVE METHOD 17 RECOVERY STUDY DATA OF 50% PRE ANALYSEDFORMULATION BY AREA UNDER THE CURVE METHOD
18 OPTICAL CHARACTERSTICS OF CEFPODOXIME PROXETILAND AMBROXOL HYDROCHLORIDE BY DERIVATIVE SPECTROSCOPIC METHOD
19 QUANTIFICATION OF TABLET FORMULATION(FINECEF-AM TAB) BY DERIVATIVE SPECTROSCOPIC METHOD
21 RUGGEDNESS STUDY BY DERIVATIVE SPECTROSCOPICMETHOD
22 RECOVERY STUDY DATA OF 50% PRE ANALYSEDFORMULATION BY DERIVATIVE SPECTROSCOPIC METHOD
23 SYSTEM SUITABILITY PARAMETERS FOR THE OPTIMIZEDCHROMATOGRAM BY RP – HPLC
24 OPTICAL CHARACTERSTICS OF CEFPODOXIME PROXETILAND AMBROXOL HYDROCHLORIDE BY RP-HPLC
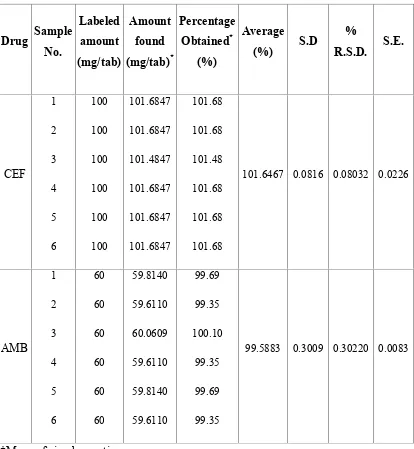
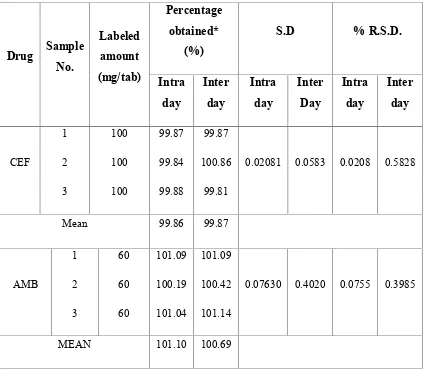
25 QUANTIFICATION OF TABLET FORMULATION(FINECEF-AM TAB) BY RP-HPLC
LIST OF ABBREVIATIONS
ICH - International Conference on Harmonisation
λ - Lambda
LOD - Limit of Detection LOQ - Limit of Quantitation
g mL-1 - Microgram Per Millilitre
mg / tab - Milligram Per tablet
ml - Millilitre
nm - Nanometer
pH - Negative Logarithm of Hydrogen Ion
% - Percentage
% RSD - Percentage Relative Standard Deviation HPLC - High Performance Liquid Chromatography Rt or tR - Retention Time
S.D - Standard Deviation S.E - Standard Error UV-VIS - Ultraviolet – Visible AUC - Area under the curve
IR - Infra Red
°C - Degree Celsius
Gms - Grams
l - Microlitre
rpm - Rotations Per Minute v/v - Volume / Volume
min - Minute
1.INTRODUCTION
(www.DrugstoreTM.com)Medicine is considered as one of major important necessity to all of us. It is
derived from the Latin words as medicine meaning "the art of healing". It is a branch
of health sciences and is the sector of public life concerned with maintaining or
restoring human health through the study, diagnosis, treatment and possible
prevention of disease, injury and other damage to the body or mind. It is both an area
of knowledge, a science of body system and their diseases and treatment. This branch
of science encompasses treatment by drugs, diet, exercise and other nonsurgical
means. It is also used to maintain our health. An agent such as drug is used to treat
disease or injury.
In the field of Pharmacology, potency is a measure of the drug activity
expressed in terms of amount required to produce an effect of given intensity. A
highly potent drug evokes a larger response at low concentrations, while a drug of
lower potency evokes a small response at low concentrations. It is proportional to
affinity and efficacy.
To demonstrate potency using an analytical assay as a surrogate measurement
of biological activity, one should provide sufficient data to establish a correlation
between the surrogate measurement(s) and the biological activity (ies) that is related
to potency. The relationship between the surrogate measurement and biological
activity may be established using various approaches, which includes comparison to
preclinical/proof of concept data, in vivo animal or clinical data, or in vitro cellular or
biochemical data. While choosing to use an analytical assay as a surrogate
measurement of biological activity to meet the potency requirements for licensed
essential to product characterization; one should initiate potency assay development
during preclinical and early clinical investigations to obtain as much product
information as possible.
In addition, measuring drug potency during early product development has a
number of advantages, such as:
Demonstrate product activity, quality and consistency throughout product
development
Generate a collection of data to support specifications for lot release
Provide a basis for assessing manufacturing changes
Evaluate product stability
Evaluate multiple assays
Recognize technical problems or reasons a different assay might be preferable
Presently drug analysis and Pharmaceutical impurities are the subjects of
constant review in the public interest. The International Conference of Harmonisation
(ICH) guidelines achieved a great deal in harmonizing the definition of impurities in
new drug substances. It is necessary to perform all the investigations on appropriate
reference standards of drug and impurities to get meaningful specifications. In order
to meet the challenges to ensure high degree of purity of drug substances and drug
products a scheme is proposed for profiling drug impurity. Finally analytical methods
based on analytical Instrumentation must be employed to quantitate drug substance
1. 1 ANALYTICAL CHEMISTRY (Devala rao G.,2008; Khare R.P.,2007)
Analytical chemistry may be defined as the science and art of determining the
composition of materials in terms of the elements (or) compounds contained. In
analytical chemistry it is prime importance to gain information about the qualitative
and quantitative composition of substances and chemical species
Introduction to analytical methods brought a drastic change, in which physical
property of a substance is measured to determine its chemical composition. An
analysis instrument is a device (or) a set of devices that acquires the desired
information regarding the chemical composition (or) the physical properties of a
given sample (or) the process. This information may be required for a variety of
purposes, eg: testing of materials, maintenance of standards, verification of physical
phenomena, monitoring the process stream, controlling product quality safety
management and so on. Analysis instrumentation is the science of technology of
developing such measuring devices. Analytical chemistry including quantitative
analysis is of enormous importance in science and industry. Chemical analysis is a
most important method of investigation and it is widely used in all branches of
sciences which are related to chemistry. At present no material is taken into
production or released into the market without analytical data which characterize its
quality and suitability for various purposes. Analysis of intermediate products is of
enormous importance. The qualitative analysis gives us the information about the
Aims and objectives of analytical chemistry(kellner R., 2004)
Analytical chemistry has two main aims (intrinsic and extrinsic). The intrinsic
aim is the achievement of the metrological activity i.e ensuring full consistency
between the analytical results delivered and the actual value of the measured
parameters. The extrinsic aim is solving the analytical problems derived from the
(bio)chemical information needs posed by a variety of ‘clients’(eg private companies,
social agents, research centers) or, in other words, providing client satisfaction.
Broadly speaking the principle objective of the analytical chemistry is to obtain as
much (bio)chemical information and of as high quality as possible from objectives
and systems by using as little material, time human resources as possible and with
minimal costs and risks.
APPLICATIONS OF ANALYTICAL CHEMISTRY TO VARIOUS BRANCHES
Analytical chemistry theory practice R.M. Verma
Analytical chemistry plays a very significant role in chemical research as every
chemist uses directly data obtained by applying techniques. Apart from applications to
chemical research, analytical techniques are frequently employed in industry in
connection with problems such as, quality control and in ascertaining most
appropriate experimental conditions for obtaining maximum yield of a particular
product. It should be noted that techniques of analytical chemistry find wide
application not only in different branches of chemistry but also in other physical and
biological sciences and in many fields of engineering.
Geologists are analytical procedures for analyzing ground water, minerals,
rocks, ores etc... In agriculture, chemical analysis is used to determine the
Medical and biological research programmes depend on chemical analysis which
helps in developing medicines to cure various diseases.
In order to safeguard public health there is constant checking of foods, drugs,
cosmetics, water supplies etc., and this is done in analytical laboratories. Waste
disposals and the composition of air in industrial areas are analysed to know the
extent of harm they would cause to public health, so that necessary preventive steps
can be taken.
Analytical methods (P C Kamboj, 2003. Annees A. Siddiqui, 2006)
The pharmaceutical analysis defined as “the branch of practical chemistry
which deals with the resolution, separation, identification, determination and
purification of a given sample of a medicine, the detection and estimation of
impurities, which may be present in drug substance (or) given sample of medicine”.
The substance may be a single compound or a mixture of compounds and may
be in the form a tablet, pill, capsule, ampoule, liquid, mixture or an ointment.
The quality control tests involve methods which embrace chemicals,
physio -chemical/ instrumental, microbiological (or) biological procedures.
The pharmaceutical analysis deals with the subject of determining the
composition of material in terms of the elements or compound (drug) present in the
system.
Any type of analysis involves two steps
Identification (qualitative)
Estimation (quantitative)
In qualitative analysis, a reaction is performed in such a way as to indicate the
formation of a precipitate, a change of a colour, the dissolution of a precipitate/
Quantitative analysis is performed ordinarily through five steps. They are
sampling, dissolution, precipitation, measurement and calculation.
Method of assay
It indicates the quantitative determination of principal ingredients of the
official substances and in preparations.
Qualitative analysis
T his is practiced in order to establish the composition of a naturally occurring or
artificially synthesized/ manufactured substance.
Qualitative analysis
I. Chemical Methods
a) Titrimetric analysis
b) Gravimetric analysis
c) Gasometric analysis
II. Physio - Chemical Methods (Instrumental Methods)
III. Microbiological Procedures
IV. Biological Procedures
I. Chemical Methods
a. Titrimetric Analysis
The analysis based on the fact that in all balanced chemical reactions utilized
for the purpose. Equivalent weight of one substance reacts quantitatively with the
equivalent weight of the other substance. The difference types of titration are as
follows
Acid base titrations (neutralization titrations)
Non- aqueous titrations
Precipitation titrations
Complexometric titrations
b. Gravimetric Analysis
This method involves the conversion of the element or a radical to be
determined into a pure stable compound readily convertible into a form suitable for
weighing.
c. Gasometric Analysis
This type of analysis involves the measurement of the volume of gases. The
volume of a gas set free in a given chemical reaction under the conditions similar to
those described in the process. It may be noted that the volume of gas is taken at
normal conditions and pressure or standard temperature and pressure (NTP/ STP)
which is a temperature of 00C (273.09oK) and the pressure of a column of 760mm/
Hg at 00C. If the reaction is taken place under different temperature and pressure the
volume is adjusted to standard conditions. A decrease in the volume of gas when a
suitable reagent is placed to absorb one of the gases present. This decrease in volume
is also reduced to STP.
The gases cyclopropane, CO2, NO2, oxygen, octyl nitrite, Nitrogen,
amyl nitrite, ethylene and helium are determined by gasometric analysis. The
measurement of volume of gases is usually done by means of gas burettes or
nitrometers.
II. Physio - Chemical Methods (Instrumental Methods)
Initially analytical methods were depending on extraction procedure,
volumetric and gravimetric methods. All these methods are nearly replaced by
advanced instrumental methods. These methods are more sensitive, specific and
backs. Various instrumental methods are classified depending on the property
analyzed.
Shows different Instrumental methods with basic principle
Sr. N0. METHOD BASIC PRINCIPLE
A ELECTROANALYTICAL METHODS
1 Potentiometry
Concerned with change in electrical properties of the system measures the change in electrode potential during a chemical reaction of the system
2 Conductometry Measures the change in electrical conductivity during a chemical reaction
3 Polarography
Measure the current at various applied potential indicating the polarization at indicator electrode
4 Amperometry Measure the change (or decrease) in current at a fixed potential during addition of titrant
B SPECTROSCOPIC METHODS
1
Absorption Spectroscopy (Ultraviolet-Visible and Infrared)
Measure the absorbance or percent transmittance during the interaction of monochromatic radiation (or particular wavelength) by the same
2 Fluorimetry
Measure the intensity of fluorescence caused by emission of electromagnetic radiation due to absorption of UV radiation
3 Flame Photometry
4 Turbidimetry Measure the turbidity of a system by passing light beam in a turbid media
5 Nephlometry Measure the opalescence of the medium by reflection of light by a colloidal solution
6 Atomic Absorption Spectrometry
Measure the intensity of absorption when atoms absorbs the monochromatic radiation
7 X-Ray Spectroscopy
Measure the position and intensity of spectral lines during emission of X ray spectrum by atoms under influence of X rays
8 Refractometry Measure the refractive index by causing refraction of light by matter
9 Polarimetry Measure optical reaction by causing the rotation of plane polarized light
C Mass Spectroscopy
Observe the position and intensity of signals in mass spectrum by causing the ionization of molecules
D NMR Spectroscopy
Observe the position and intensity lines in NMR spectrum when proton interact with electromagnetic radiation in radio frequency region
E Thermal Methods
Measure the physical parameters of the system as a function of temperature. It includes thermo gravimetry, derivative gravimetry, differential thermal analysis
III. Microbiological Methods
`In a microbiological assay, a comparison of inhibition of the growth of
bacteria by a measured concentration of the antibiotic, which is to be examined, is
made with that produced by known concentration of the standard preparation of an
antibiotic having known activity.
IV. Biological Methods
When the potency of a drug or its derivative cannot be properly determined by
physical or chemical methods and where it is possible to observe the biological effects
of the drug on some type of living matter. The biological assays are carried out. The
basis of such assay is to determine how much of the sample gives the same biological
effect as a given quantity of the standard preparation. The sample and standard
preparation are tested under identical conditions in all respect. In a typical bio – assay,
a stimulus is applied to a subject is referred to as the dose and is indicated by a weight
or in terms of the concentration of the preparation. The application of stimulus on a
subject produces some observable effect and this is called the response. The response
may be measured by the total weight or weight of some organ of the subject, blood
sugar concentration, and diameter of inhibition zone or by some other physiological
1.2 ULTRAVIOLET SPECTROSCOPY (Beckett A.H and stenlake J.B., 2002)
Ultraviolet spectroscopy deals with the measurement of energy absorbed when
electrons are promoted to higher energy state. On passing electromagnetic radiation in
the ultraviolet and visible regions through the compound with multiple bonds, a
portion of the radiation is normally absorbed by the compound. The amount of
absorption depends on the wavelength of the radiation and the structure of the
compound. Absorption of the electromagnetic radiation in the visible and ultraviolet
region of spectrum results in changes of electronic structure of ions and molecules.
Diagram of an Analytical instrument showing the stimulus and
QUANTITATIVE SPECTROPHTOMETRIC METHODS
(Beckett and Stenlake, 2002)
The assay of an absorbing substance may be quickly carried out by preparing a
solution in a transparent solvent and measuring its absorbance at a suitable
wavelength. The wavelength normally selected is a wavelength of maximum
absorption (max), where small errors in setting the wavelength scale have little effects on the measured absorbance.
a. Assay of substances in single component samples
Absorption spectroscopy is one of the most useful tools available to the
chemist for quantitative analysis. The most important characteristics of photometer
and spectrophotometric method are high selectivity and ease of convenience.
Quantitative analysis (assay of an absorbing substance) can be done using following
methods.
- Use of values
- Use of calibration graph (multiple standard method)
- By single or double point standardization method.
i) Use of values
This method can be used for estimation of drug from formulations or raw
material, when reference standard not available. The use of standard value
avoids the need to prepare a standard solution of the reference substance in order to
determine its absorptivity, and is of advantage in situations where it is difficult or
ii. Use of calibration graph
In this procedure the absorbances of a number (typically 4-6) of standard
solutions of the reference substance at concentrations encompassing the sample
concentrations are measured and a calibration graph is constructed. The concentration
of the analyte in the sample solution is read from the graph as the concentration
corresponding to the absorbance of the solution. Calibration data are essential if the
absorbance has a non-linear relationship with concentration, or if the absorbance or
linearity is dependent on the assay conditions. In certain visible spectrophotometric
assays of colourless substances, based upon conversion to coloured derivatives by
heating the substance with one or more reagents, slight variation of assay conditions,
e.g. PH, temperature and time of heating, may rise to a significant variation of
absorbance, and experimentally derived calibration data are required for each set of
samples.
iii. Single or double point standardization
The single point procedure involves the measurement of the absorbance of a
sample solution and of a standard solution of the reference substance. The standard
and the sample solution are prepared in similar manner; ideally the concentration of
the standard solution should be close to that of the sample solution. The concentration
of the substance in the sample is calculated using following formula.
Ctest= Atest× Cstd/ Astd
Where,
Ctest and Cstd are the concentration in the sample and standard solutions
respectively.
Atest and Astd are the absorbance of the sample and standard solutions
In double point standardization, the concentration of one of the standard solution
is greater than that of the sample while the other standard solution has a lower
concentration than the sample. The concentration of the substance in the sample
solution is given by
(Atest– Astd1)(Cstd1-Cstd2) +Cstd1(Astd1-Astd2)
Ctest =
Astd1-Astd2
Where,
Cstdis the concentration of the standard solution.
Atest and Astd are the absorbance of the sample and standard solution
respectively.
Std1 and std2 are the more concentrated standard and less concentrated
standard respectively.
b. Assay of substances in multi component samples
The spectrophotometric assay of drugs rarely involves the measurement of
absorbance of samples containing only one absorbing component. The pharmaceutical
analyst frequently encounters the situation where the concentration of one or more
substances is required in samples known to contain other absorbing substances which
potentially interfere in the assay. Unwanted absorption from these sources is termed
irrelevant absorption and if not removed, imparts systematic errors to the assay of the
drug in the sample. A number of modifications to the simple spectrophotometric
procedure for single-component samples are available to the analyst, which may
eliminate certain sources of interferences and permit the accurate determination of
The basis of all the spectrophotometric technique for multicomponent samples
is the property that at all wavelengths:
a) The absorbance of a solution is the sum of absorbances of the
individual components; or
b) The measured absorbance is the difference between the total
absorbance of the solution in the sample cell and that of the solution
in the reference (blank) cell.
The determination of the multi-component samples can be done by using the
following methods,
Simultaneous equation method Absorbance ratio method
Geometric correction method
Orthogonal polynomial method Difference spectrophotometry
Derivative spectrophotometry Chemical derivatisation
1.2.1 Methods carried out
i. SIMULTANEOUS EQUATION METHOD
ii. AREA UNDER THE CURVE METHOD
i. SIMULTANEOUS EQUATION METHOD
If a sample contains two absorbing drugs (X and Y) each of which absorbs at
λ maxof the others it may be possible to determine both drugs by the technique of
simultaneous equation (Vierodt’s method) provided that criteria apply.
Information required is
1. The absorptivities of X at λ1 and λ2 are ax1 and ax2, respectively
2. The absorptivities of Y at λ1 and λ2 are ay1 and ay2, respectively
3. The absorbances of the diluted sample at λ1 and λ2, A1 and A2 respectively.
Let cxand cybe the concentrations of X and Y respectively in the diluted sample.
Two equations are constructed based upon the fact that at λ1 and λ2
2 1
1 1 2
1 2
2
y x y x
y y
x a a a a
a A a A c
2 1 2 2 1 2 1 2 y x y x x x
y a a a a
a A a A c
Criteria for obtaining maximum precision, based upon the absorbance ratios,
have been suggested (Glenn, 1960) that place limits on the relative concentrations of
the components of the mixture. The criteria are the ratios.
1 2 1 2 1 2 / / / / 1
2 A A
a a and a a A
A y y
x x
Should lie outside the range 0.1-2.0 for the precise determination of X and Y
respectively. These criteria are satisfied only when the λmaxof the two components is
reasonably dissimilar. An additional criterion is that the two components do not
interact chemically, there by negating the initial assumption that the total absorbance
is equal to sum of the individual absorbances.
ii. AREA UNDER THE CURVE METHOD (Telekone et al.,2010)
The area under curve method is applicable where there is no sharp peak or
when broad spectra are obtained. It involves the calculation of integrated value of
absorbance with respect to the wavelength between the two selected wavelengths λ1
and λ2. Area calculation processing item calculates the area bound by the curve and
the horizontal axis. The horizontal axis is selected by entering the wavelength range
over which area has to be calculated. This wavelength area is selected on the basis of
repeated observation so as to get the linearity between area under curve and
concentration. In combination drugs λ1and λ2denotes the wavelength ranges of the
drugs are substituted in the simultaneous equation to get the concentration of the drugs. 2 1 1 1 2 1 2 2 y x y x y y
x a a a a
a A a A c And 2 1 2 1 1 2 1 2 y x y x x x
y a a a a
a A a A c
iii. DERIVATIVE SPECTROSCOPIC METHOD
This method involves the conversion of the normal spectrum into first, second or
higher derivative spectrum. The transformation that occurs in the derivative spectrum
is understood by reference to a Gaussian band which represents an ideal absorption
band.
The first derivative (D1) spectra is a plot of the ratio of change of absorbance with
wavelength against wavelength, i.e a plot of slope of the fundamental spectrum
against wavelength or a plot of dA/dλ Vs λ1. At λ2and λ4, the maximum positive and
maximum negative slope respectively in the D°. Spectrum corresponds with
maximum and minimum respectively in the D1 spectrum. The λmax at λ3is a
wavelength of zero slope and gives dA/dλ, i.e a cross-over point, in the D1
spectrum.
The first order derivative spectrum of absorption band is characterized by a
maximum, a minimum and a cross-over at a λmax of the absorption band. These
spectral transformations confer two main advantages on derivative
spectrophotometry. Firstly an even order spectrum is of narrower spectral band width
than its fundamental spectrum.
individual bands. Secondly, derivative spectroscopy discriminates in favours of the
substances of narrow spectral bandwidth against broad band width substances.
The absorption laws (Y.R. Sharma, 2009)
There are two laws which govern the absorption of light by the molecules.
These are,
(1) Lambert’s Law
(2) Beer’s Law
Lambert’s Law
When a beam of monochromatic radiation passes through a homogenous
absorbing medium, the rate of decrease of intensity of radiation with thickness of
absorbing medium is proportional to the intensity of incident radiation.
I = I0e-kt
Where, I0= Intensity of incident light
I = Intensity of emerged light
t = Thickness of the medium
Beer’s Law
When a beam of monochromatic radiation is passed through a solution of an
absorbing substance, the rate of decrease of intensity of radiation with concentration
of the absorbing solution is directly proportional to the intensity of incident radiation.
I = I0e-kc
Where, I0= intensity of incident light
I = Intensity of emerged light
c = concentration of the absorbing species
From these laws, the following empirical expression of Beer - Lambert’s Law was
Log (I0/IT) = Єct =A
Where, A= Absorbance or optical density or extinction co-efficient
Є = Molecular extinction co-efficient
c = Concentration of drug
t = Path length
Limitations of Beer Lambert’s Law
1. When different forms of the absorbing molecules are in equilibrium as in
keto-enol tautomers.
2. When fluorescence compounds are present.
1.3 INTRODUCTION TO HPLC METHODS OF ANALYSIS OF DRUGS IN
COMBINED DOSAGE FORM (Chatwal R Gurdeep, et al., 2008)
High performance liquid chromatography [HPLC] was developed in the late
1960’s and 1970’s it is widely accepted separation technique for both sample analysis
and purification in a variety of areas including the pharmaceutical, biotechnological,
environmental polymer and food industries.
HPLC instrumentation is made up of eight basic components they are
mobile phase reservoir, solvent delivery system, sample introduction device, column,
detector, waste reservoir, connective tubing and a computer, integrator (or) recorder.
Chromatography is defined as a method of separating a mixture of
components into individual components through equilibrium distribution between two
phases. Chromatography technique is based on the difference in the rate at which the
components of a mixture move through a porous medium (stationary phase) under the
influence of some solvent or gas (mobile phase).
The chromatographic method of a separation in general involves the following
steps:
Adsorption or retention of a substance or substance on the stationary phase.
Separation of the adsorbed substance by the mobile phase.
Recovery of the separated substance by a continuous flow of the mobile phase. The method being called elution.
1.3.1 Introduction to HPLC (Sharma B K., 2006)
HPLC is a form of liquid chromatography to separate compounds that are
dissolved in solution. HPLC instrument consists of four basic parts
The column
Detector
Injection system
Mobile-phase pump system
A schematic diagram of HPLC equipment
1.3.2 Principle of separation in HPLC (Willard et al., 1986)
The principle of separation in normal phase and reverse phase mode is the
adsorption. When a mixture of components is introduced in to a HPLC column, they
travel according to their relative affinities towards the stationary phase. The
component which has more affinity towards the adsorbent travels slower. The
no two components have the same affinity towards the stationary phase the
components are separated.
1.3.3 Modes of chromatography
i. Normal phase mode
ii. Reverse phase mode
i. Normal phase chromatography
In normal phase mode, the stationary phase (silica gel) is polar in nature and
the mobile phase is non-polar. In this technique non-polar compounds travel faster
and eluted first. The silica structure is saturated with silicon groups at the end and
‘OH’ groups attached to silicon atoms are the active binding sites.
ii. Reverse phase chromatography
In reverse phase technique, a non polar stationary phase is used. The mobile
phase is polar in nature hence polar components get eluted first and non-polar
compounds are retained for a longer time. Since most of the drugs and pharmaceutical
are polar in nature, they are not retained for a longer and eluted faster, which is
advantageous. Different columns used are ODS (octadecyl silane) or C18, C8 and C4
1.4ICH GUIDELINES FOR ANALYTICAL METHOD VALIDATION
(Code Q2A; Q2B. ICH Guidelines1994 and 1996)
Method validation is the process to confirm that the analytical procedure
employed for a specific test is suitable for its intended use. Methods need to be
validated or revalidated. The International Conference of Harmonization (ICH) of
technical requirements for the registration of pharmaceutical for human use has
developed a consensus text on validation of analytical procedures. The document
includes definition for eight validation characterstics.
The parameters as defined by the ICH and by other organizations
Specificity
Selectivity
Precision
Repeatability
Intermediate precision
Reproducibility
Accuracy
Linearity
Range
Limit of detection
Limit of quantification
Robustness
1.4.1 SPECIFICITY
Specificity is the ability to assess unequivocally the analyte in the presence of
components which may be expected to present. An investigation of specificity should
be conducted during the validation of identification tests, the determination of
impurities and assay.
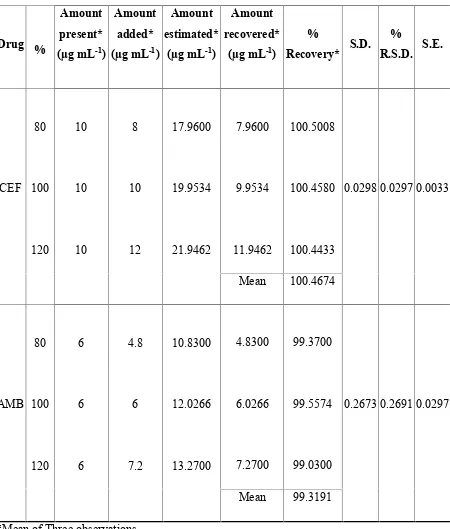
1.4.2 ACCURACY
The accuracy of an analytical procedure expresses the closeness of
agreement between the value which is accepted either as a conventional true value or
on an accepted reference value and the value found.
1.4.2.1 Assay
- Assay of Active substances
- Assay of Medicinal products
Several methods are available to determine the accuracy
a) Application of an analytical procedure to an analyte of known purity
b) Comparision of the results of the proposed analytical procedure
c) Application of the analytical procedure to synthetic mixtures
1.4.2.2 Impurity (Quantification)
Accuracy should be assessed on sample spiked with known amounts of
impurities. It should be clear how the individual or total impurities are to be
determined.
1.4.3 PRECISION
The precision of an analytical procedure expresses the closeness of the
agreement between a series of measurements obtained from multiple sampling of
same homogeneous sample under the prescribed conditions. Validation of tests for
assay and for quantitative determination of impurities includes an investigation of
precision.
1.4.3.1 Repeatability(intra- assay precision)
Express the precision under small operating conditions over a short interval of
time. It should be assessed using a minimum of nine determinations.
1.4.3.2 Intermediate Precision
The extent to which intermediate precision should be established depends on
the circumstances under which the procedure is intended to be used. Typical
validation to be studied includes days, analysts, equipments, etc.
1.4.3.3 Reproducibility
Reproducibility is assessed by means of an inter-laboratory trail.
Reproducibility should be considered in case of the standardization of an analytical
procedure, for insistence inclusion of procedure in pharmacopoeias.
1.4.4 LINEARITY
Linearity of an analytical procedure is its ability (with in a given range) to
obtain test results which are directly proportional to the concentration (amount) of
1.4.5 RANGE
Range of an analytical procedure is the interval between the upper and lower
concentration of analyte in the sample including these concentrations for which it has
been demonstrated that the analytical procedure has a suitable level of precision,
accuracy and linearity.
1.4.6 LIMIT OF DETECTION
The detection limit is determined by the analysis of samples with known
concentration of analyte and by establishing that minimum level at which the analyte
can reliably detected.
a. Based on visual evaluation
b. Based on Signal-to-Noise ratio
c. Based on the standard deviation of the response and the slope
Based on the standard deviation of blank Based on the calibration graph
S 3.3σ DL
Where,
σ = standard deviation of the response
S= slope of the calibration curve (of the analyte)
1.4.7 LIMIT OF QUANTIFICATION
The quantification limit is generally determined by the analysis of samples
with the known concentrations of analyte and by establishing the minimum value at
which the analyte can be quantified with acceptable accuracy and precision
a. Based on visual evaluation
b. Based on Signal-to- Noise ratio
c. Based on the standard deviation of the response and the slope
Based on the standard deviation of blank
Based on the calibration graph
The quantification limit may be expressed as,
S 10σ QL
Where,
σ = standard deviation of the response
1.4.8 ROBUSTNESS
The evaluation of robustness should be considered during the development
phase and depends on the type of procedure under study. It shows the reliability of an
analysis with respect to deliberate variations in the method parameters.
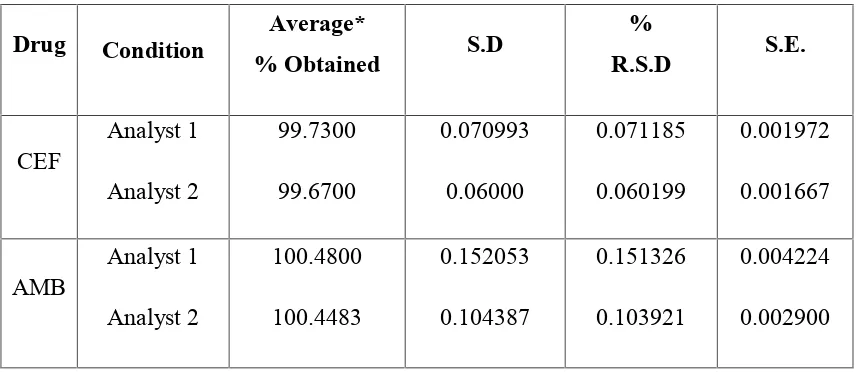
1.4.9 RUGGEDNESS
The united states of pharmacopoeia (USP) define ruggedness as the degree of
reproducibility of test results obtained by the analysis of the same sample under a
variety of normal test condition such as different labs, different analysis, different lots
of reagents etc. Ruggedness is a measure of reproducibility of test results under
normal expected operational conditions from laboratory to laboratory and from
analyst to analyst.
1.5 SYSTEM SUITABILITY PARAMETERS
(anonymous. USP, 1995; Sethi 2001)
System suitability test are an integral part of gas and liquid chromatography.
They are used to verify that the resolution and reproducibility of the chromatographic
system are adequate for the analysis to be done. These tests are based on the concept
that the equipment, electronics, analytical operations and samples to be analysed
constitute an integral system that can be evaluated as such. FDA guidelines on
“validation of chromatographic methods” the following acceptance limits are
System suitability parameters and recommendations
S.No. Parameters Recommendations
1 Theoritical plates (N) >2000 2 Tailing factor (T) ≤ 2 3 Assymetric factor ≤ 2
3 Resolution (Rs) > 2 between peak of interest and the closest eluting potential interference
4 Repeatability RSD ≤ 1% for N ≥5 is desirable 5 Capacity factor (k1) > 2.0
6 Relative retention Not essential as long as the resolution is stated
1) Capacity Factor (or) Retention (KA)
The retention of a drug with a given packing material and eluent can be
expressed as retention time or retention volume, but both of these are dependent on
flow rate, column length and column diameter. The retention is best described as a
column capacity ratio (K), which is independent of these factors. The column capacity
ratio of a compound (A) is given as
0 0 A 0 0 A A t t t V V V
K
2) Resolution (RS)
The resolution, Rs of two neighboring peaks is defined by the ratio of the
distance between the two peak maxima. It is the difference between the retention
times of two solutes divided by their average peak width. For baseline separation, the
ideal value of Rsis 2.0. It is calculated by using the formula,
Where,
Rt1and Rt2are the retention times of components 1 and 2
W1and W2are peak widths of components 1 and 2
3) Selectivity ()
The selectivity (or separation factor) , is a measure of relative retention of
two components in a mixture. The ideal value of selectivity is 2. It can be calculated
by using the formula,
0 1 0 2 V V V V
Where, V0 is the void volume of the column and V2 and V1 are the retention
volumes of the second and the first peak, respectively.
4) Column efficiency
Efficiency, N, of a column is measured by the number of theoretical plates per
meter. It is a measure of band spreading of a peak. Smaller the band spread, higher is
the number of theoretical plates, indicating good column and system performance.
Columns with N ranging from 5,000 to 1,00,000 plates/meter are ideal for a good
system. Efficiency is calculated by using the formula,
2 2 16 W Rt N
Where, Rt is the retention time and W is the peak width.
5) Peak asymmetry factor (As)
Peak asymmetry factor, Ascan be used as a criterion of column performance.
The peak half width b of a peak at 10 % of the peak height, divided by the
1.6 PHARMACEUTICAL STATISTICS
Linear regression
Linear regression a statistical technique that defines the functional relationship
between two variables by best-fitting straight line. Once a linear relationship has been
shown to have a high probability by the value of the correlation coefficient ‘r’, then
the best straight line through the data points has to be estimated. This can often be
done by visual inspection of the calibration graph, but in many cases it is far more
sensible to evaluate the best straight line by linear regression (the method of least
squares)
The equation of straight line is
y = mx + c
Where, y the dependent variable is plotted as result of changing x, the independent
variable.
To obtain the regression line ‘y on x’ the slope ‘m’ of the line and the intercept
‘c’ on the y axis are given by the following equation.
Correlation coefficient (r)
It is a procedure commonly used to characterize quantitatively the relationship
between variable. Correlation is related to linear regression. To establish whether
there is a linear relationship between two variables x1 and y1, use Pearson’s
correlation coefficient ‘r’.
Where n is the number of data points.
The value of ‘r’ must lie between +1 and -1, the nearer it is to +1, the greater
the probability that a definite linear relationship exists between the variables x and y,
values close to +1 indicate positive correlation and values close to -1 indicate negative
correlation values of ‘r’ that tend towards zero indicate that x and y are not linearly
related (they made be related in a non-linear fashion).
Standard deviation (SD)
It is commonly used in statistics as a measure of precision statistics and is
more meaningful than is the average deviation. It may be thought of as a
root-mean-square deviation of values from their average and is expressed mathematically as
Where,
S is standard deviation.
If N is large (50 or more) then of course it is immaterial whether the term in
the denomination is N -1 or N
Σ = sum
x = Mean or arithmetic average.
x
-x = deviation of a value from the mean
N = Number of observations
Percentage relative standard deviation (%RSD)
It is also known as coefficient of variation (CV). It is defined as the standard
deviation (S.D) expressed as the percentage of mean.
C 100 x S.D RSD % or
V
Where,
S.D is the standard deviation,
x = Mean or arithmetic average.
The variance is defined as S2 and is more important in statistics than S itself.
However, the latter is much more commonly used with chemical data.
Standard error of mean (SE)
Standard error of mean can be defined as the value obtained by division of
standard deviation by square root of number of observations. It is mathematically
expressed as
n S.D. S.E.
2. LITETRATURE REVIEW
2.1 DRUG PROFILE (The Indian pharmacopoeia 2007)
2.1.1 AMBROXOL HYDROCHLORIDE
Molecular structure
Chemical name
trans-4-[(2-Amino-3,5-dibromobenzyl)amino] cyclohexanol hydrochloride.
Molecular formula
C13H18Br2N2O.HCl
Molecular weight
414.6
Category
Mucolytic expectorant.
Description
A white or yellow crystalline powder.
Solubility
Storage
Protect from light. Following reconstitution, aliquot and freeze at -20oC. This
product is stable for 2 years as supplied. Stock solutions are stable for 4 months at -200C.
Identification
i) Melting point
Standard value Observed average value*
233 ºC -236ºC 234.66ºC
*Average of six observations
ii) Infra red spectrum
iii) Thin layer chromatography
Test solution – dissolve 50mg of the substance to be examined in methanol and dilute to 5ml with the same solvent.
Reference solution – dissolve 50mg of Ambroxol HCl in methanol & dilute to 5ml with the same solvent.
Plate – TLC silica gel F254plate.
Mobile phase – con.ammonia, 1-propanol, ethyl acetate, hexane. Drying in air.
Detection – examine in UV at 254nm.
Results – the principle spot in the chromatogram obtained with the test solution is similar in position and size to the principle spot in the chromatogram obtained with the reference solution.
PH
Mechanism of Action
The substance is a mucoactive drug with several properties including secretolytic and secretomotoric actions that restore the physiological clearance mechanisms of the respiratory tract which play an important role in the body’s natural defense mechanisms. It stimulates synthesis and release of surfactant by type II pneumocytes. Surfactants acts as an anti-glue factor by reducing the adhesion of mucus to the bronchial wall, in improving its transport and in providing protection against infection and irritating agents. Ambroxol HCl enhances penetration power of antibiotics. Administration of Ambroxol together with antibiotics leads to higher antibiotic concentration in the lung tissue. It also act as a scavenger of hypochlorous and hydroxyl radicals, it blocks nitric oxide stimulated activation of guanylate cyclise.
Contraindications
Ambroxol should not be used in patients known to be hypersensitive to Ambroxol or other components of the formulation
Ambroxol side effects
Occasional gastro intestinal side effects may occur but these are normally mild.
Overdosage
2.1.2 CEFPODOXIME PROXETIL
Molecular structure(The Merck index 2006, 14thedition)
Chemical name
[6R-[6α,7β(z)]]-7-[[(2-amino-4-thiozolyl)(methoxyimino)acetyl]amino]-3- (methoxy-methyl)-8-oxo-5-thia-1-azabicyclo[4.2.0]oct-2-ene-2-carboxylicacid1-[[(1-methyl ethoxy)carbonyl]oxy]ethyl ester.
Molecular formula
C21H27N5O9S2
Molecular weight
557.61
Category
Antibiotic:Used for treating respiratory track infection and urinary track infection.
Description
It is white to light brownish powder,odourless or bitter in taste.
Storage
Solubility
Freely soluble in methanol and ethanol, slightly soluble in ether, very slightly soluble in water and practically insoluble in chloroform.
Identification
i) Melting point
Standard value Observed average value*
111 ºC - 113ºC 111ºC
*Average of six observations
ii) Infra red spectrum
Mechanism of action
It is a orally administered THIRD generation cephalosporin’s class of antibacterial agent more active against enterobacteriaceae,streptococcus aureus and β-lactamase producing H.influenzae,M.catarrhalis,N.gonorrhoeae & less active against gram +ve cocci. It binds to one or more of the penicillin binding proteins (PBPs) which inhibits the final transpeptidation step of peptidoglycon synthesis in bacterial cell wall, thus inhibiting biosynthesis and arresting cell wall assembly resulting in bacterial cell death.
Absorption
Decreased absorption in conditions of low gastric acidity. Bioavailability 50%.
Half life 2.2hrs.
Distribution
Cefpodoxime proxetil distributed in respiratory and GU tract in therapeutic concentration.
Enters in breast milk in low concentrations.
Interactions
2.2 REPORTED METHODS
REPORTED METHODS FOR AMBROXOL HYDROCHLORIDE
1. Umadevi. B et al., (2011), reported “Development and Validation of UV
Spectrophotometric determination of Doxofylline and Ambroxol HCl in bulk
and combined tablet formulation”. The method employs simultaneous equation
using the absorbance at 274 and 244.5nm for Doxofylline and Ambroxol. For
absorbance correction method 274nm for Doxofylline and 308nm for Ambroxol were
Doxofylline shows nil absorbance.
2. Nagavalli. D et al., (2011), reported “Validated HPLC method for the
Simultaneous estimation of Gemifloxacin Mesylate and Ambroxol HCl in bulk
and tablet dosage form”. The method has been developed with mobile phase
acetonitrile, methanol and trifluro acetic acid at the ratio of (25:20:55 % v/v) detected
in 248nm observed retention time were 2.69 mins and 3.43 mins.
3.Jain P.S.1et al.,(2010), reported “Stability-Indicating HPTLC determination of
Ambroxol Hydrochloride in bulk drug and pharmaceutical dosage form”. The
method employed HPTLC aluminium plates precoated with silica gel 60F-254 as the
stationary phase. The solvent system consisted of methanol-triethylamine (4:6, v/v).
Densitometric analysis of Ambroxol hydrochloride was carried out in the absorbance
mode at 254 nm.
4.Prathap. B et al.,(2010),reported “Simultaneous determination of Gatifloxacin
and Ambroxol Hydrochloride from tablet dosage form using RP-HPLC”. A
Reversed-Phase High Performance Liquid Chromatography (HPLC) method was
developed, validated, and used for the quantitative determination of Gatifloxacin
Chromatographic separation was performed on a Thermo Hypersil Keystone ODS
C18 column (250 mm × 4.6 mm, 5 μm), with a mobile phase comprising of a mixture
of phosphate buffer and acetonitrile (60:40, v/v), and pH adjusted to 3 with ortho
phosphoric acid, at a flow rate of 1 mL/min, with detection at 250 nm.
5. Deshpande et al., (2010), reported “Application of HPLC and HPTLC for the
Simultaneous determination of Cefixime Trihydrate and Ambroxol HCl in
pharmaceutical dosage form”. The HPTLC method involves desitometric
measurements at 254nm, the separation was on aluminium sheets of Silica gel 60 F
254 using acetonitrile : methanol : triethylamine (8.2:1:0.8,v/v/v) as mobile phase.
The HPLC method was carried on column C18 at ambient temperature using mobile
phase acetonitrile: methanol (50:50, v/v) UV detection at 254nm.
6. Senthil Raja. M et al., (2010), reported “RP-HPLC method Development and
validation for the simultaneous estimation of Azithromycin and Ambroxol
Hydrochloride in Tablets”. The separation was carried out using a mobile phase
consisting of acetonitrile and mono basic potassium phosphate buffer of pH 8.5 in the
ratio of 65:35 v/v. The column used was C18 phenomenex Gemini 5m, 250cm x
4.6mm id with flow rate of 2ml/min using PDA detection at 220nm.
7. Makarand Avhad et al., (2009), reported “Develoment and validation of
Simultaneous UV- spectrophotometric method for the determination of
Levofloxacin and Ambroxol in tablets”. The method involves Q-absorbance
equation at 219nm isoabsorptive point and at 287nm using distilled water as a solvent.
8. Krishna Veni Nagappan et al., (2008), reported “A RP-HPLC Method for Simultaneous Estimation of Ambroxol Hydrochloride and Loratidine in