A STUDY ON PULMONARY FUNCTION
TESTS IN TYPE 2 DIABETES MELLITUS
Dissertation submitted in partial fulfillment of
the requirements for the degree of
M.D. (GENERAL MEDICINE)
BRANCH – I
DEPARTMENT OF GENERAL MEDICINE
KILPAUK MEDICAL COLLEGE,
CHENNAI
–
600 010.
THE TAMIL NADU
DR. M.G.R. MEDICAL UNIVERSITY CHENNAI
BONAFIDE CERTIFICATE
This is to certify that “A STUDY ON PULMONARY FUNCTION TESTS IN TYPE 2 DIABETES MELLITUS” is a
bonafide work performed by Dr.MANOJ KUMAR., P., post graduate student, Department of Internal Medicine, Kilpauk Medical College, Chennai-10, under my guidance and supervision in fulfilment of regulations of the Tamil nadu Dr. M.G.R Medical university for the award of M.D. Degree Branch I (General Medicine) during the academic period from May 2010 to April 2013.
Prof. Dr. Gunasekaran M.D., DTCD Prof. Dr.D.Surendran M.D., D.Ch
Professor and Head Professor of medicine, Unit chief
Dept. of Medicine Department of Medicine
Kilpauk Medical College, Kilpauk Medical College Chennai- 10 Chennai-10
Prof. P. Ramakrishnan M.D., D.L.O The DEAN
DECLARATION
I solemnly declare that this dissertation “A STUDY ON PULMONARY FUNCTION TESTS IN TYPE 2 DIABETES
MELLITUS” was prepared by me at Government Kilpauk Medical College and Hospital, Chennai, under the guidance and supervision of Dr.D. Surendran M.D., D.Ch., Professor of internal medicine and Unit
chief, Kilpauk Medical College and Hospital, Chennai.
This dissertation is submitted to The Tamil Nadu Dr. M.G.R. Medical University, Chennai in partial fulfilment of the University regulations for the award of the degree of M.D. Branch I (General Medicine).
Place: Chennai
ACKNOWLEDGEMENT
At the outset, I would like to thank my bellowed Dean, Kilpauk Medical College Prof. Dr. P. Ramakrishnan, M.D., D.L.O., for his kind permission to conduct the study in Kilpauk Medical College. I would like to express my special thanks to former medical superintendent Prof. Dr. Jayaraman, M.S., Mch., for permitting to conduct this study in Kilpauk
Medical College Hospital.
It gives me immense pleasure to express my sincere and deep gratitude to Prof. Dr. Gunasekaran M.D.,DTCD., Professor and Head of the Department of Medicine, Kilpauk Medical College and Hospital for rendering permission to do this dissertation.
I would like to thank wholeheartedly, Prof. Dr. Surendran M.D., D.Ch., my unit chief and Professor of Medicine for his encouragement
and guidance during the study.
I also express my special thanks to Prof. Dr. G.Balan., Prof. Dr. S. Usha Lakshmi M.D., Prof. Dr. Ravindran M.D., DNB., Dip
Diabetology.
I am extremely thankful to Assistant Professor of Medicine Dr. Venkateswaralu M.D., D.Ch for their assistance and guidance.
I would always remember with extreme sense of thankfulness for the co-operation and criticism shown by my fellow post graduate colleague and friends.
I would like to take this opportunity to show gratitude to my mentor and my dear Father and Mother, my bellowed brother P.Raj mohan, my friends Dr. Ganesh Aravind, Dr. M.Dhanasekar & Dr.Deepa avadhani for their never ending support in finishing this thesis and Almighty God for all his blessings.
Finally, I wholeheartedly thank all my patients for their active co-operation in this study, without which this would not have become a reality.
CONTENTS
Page No.
1. Introduction 1
2. Aim of study 3
3. Review of literature 4
4. Materials and methods 48
5. Results and Analysis 56
6. Discussion 75
7. Conclusions 79
8. Limitations and recommendations.
APPENDIX
Bibliography
Abbreviations
Questionnaire
Master chart
LIST OF TABLES
TABLES TOPIC
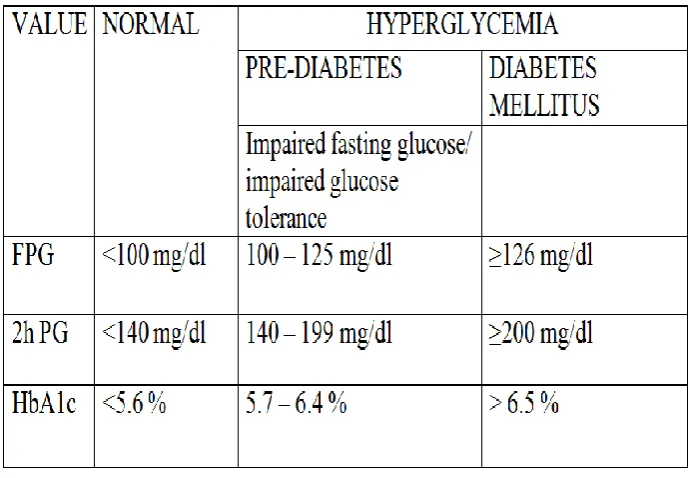
1. Diagnostic criteria for Diabetes Mellitus
2. Etiological Classification of Diabetes Mellitus
3. Glucose Homeostosis
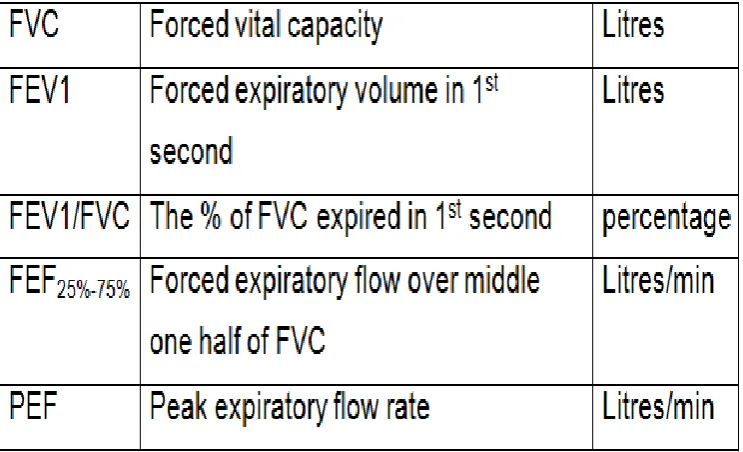
4. Spirometric parameters
5. Sex distribution in Case & Control groups
6. Comparison of Spirometric values of 2 groups
7. % prediction of recorded values in diabetic group
8. Distribution of spirometric pattern in Type2 DM
9. Correlation of PFT values with duration of DM
10. Correlation of PFT values with FBS values
11. Correlation of PFT values with PPBS values
LIST OF FIGURES
FIGURES TOPIC
1. Structure of Proinsulin
2. Mechanism of Insulin secretion 3. Fuel metabolism & Insulin actions 4. Glucose metabolism
5. Pathophysiological basis of uncontrolled DM 6. Fundus picture of Diabetic retinopathy
7. Screening for Microalbuminuria
8. Various presentations of Diabetic neuropathy 9. Alveolar structure
10. Bronchopulmonary tree with its vasculature 11. Normal Spirometric Flow Curve
12. Patterns of Spirometric curves
13. Flow chart to interpret spirometric curves 14. Spirometer
LIST OF CHARTS
CHARTS TOPIC
1. Comparing spirometric values between 2 groups
2. Comparing % prediction values between 2 groups
3. Pattern of lung function in diabetic group
INTRODUCTION
Diabetes mellitus as we all know is a systemic disorder which affects many organs by causing pathological changes in them. It is considered as a leading cause of increasing morbidity and deaths in todays world.
Many theories have been suggested to explain the end organ damage induced by hyperglycaemia. These are : 1
1.Formation of advanced glycosylation end products
2.Glucose metabolism via sorbitol pathway
3.Activation of protein kinase C and
4.Increase in flux via hexosamine pathway.
The vascular complications of DM remains the main cause of mortality & morbidity. It includes macrovascular and microvascular ie.., retinopathy, neuropathy and nephropathy. Generally the microvascular complications occur early in the course of diabetes ie.., 5 to 10 years and it takes 10 to 15 years for macrovascular complications to develop5. Eventhough respiratory tract infections like tuberculosis is increased in incidence in patients with diabetes mellitus, attention is only minimally given to respiratory system.
This study is aimed to detect the abnormalities in pulmonary functions in Type 2 DM patients. The presence of abundant connective tissue and microvascular circulation in lung raises the possibility that in diabetic patients, lung could also be a “target organ”.Chronic hyperglycaemia causes many histopathological changes in the lungs of diabetics. These are thickening of alveolar epithelium and the basal lamina of pulmonary capillaries. These changes ultimately results in reduction in elastic recoiling capacity and the lung volume. The reason would probably be the non-enzymatic glcosylation induced connective tissue alteration in lung parenchyma. 6
AIM OF THE STUDY
1. To record the Pulmonary function tests in Type 2 DM group as well as in the control group.
2. To compare the pulmonary functions between the 2 groups.
REVIEW OF LITERATURE
INTRODUCTION :
The group of metabolic disorders which share the phenotype of hyperglycaemia is referred as DIABETES MELLITUS. Complex interaction of various factors including environmental & genetic is the cause for several distinct types diabetes mellitus.
The factors contributing to hyperglycaemia are decrease in insulin secretion, decrease in utilization of glucose, and increase in glucose production. This dysregulation causes secondary changes in various organ systems and imposing burden on the person with diabetes and also on the health care system.7
EPIDEMIOLOGY:
The prevelance of Type 2 DM in asia is increasing rapidly and more importantly, the diabetes phenotype appears to be different from the united states – onset at a lower BMI, greater visceral adiposity, younger age and decreased capacity of insulin secretion7. People of south asia have a very high rate of diabetes and they too have highest rates of premature CVD ( cardiovascular disease ). in the world8.
India, china along with middle east countries are now the 'hot spots' according to diabetes data, since the incidence of disease in next 20 years is likely to double9. A rough estimation of prevelance of diabetes is about 12% in india and it is expected to increase in next coming years10.
According to data from International diabetes federation, 4.6 million people of the age group 20-79 years died in 2011 due to diabetes. This number equals the magnitude of combined deaths from various major infectious diseases. Highest numbers being from india, china & united states of america11.
DIAGNOSIS7 :
Symptoms of diabetes include :
Fatigue
polyuria
polydypsia
CLASSIFICATION 7 :
INSULIN : BIOSYNTHESIS, SECRETION AND ACTION
BIOSYNTHESIS:
[image:19.595.179.446.441.613.2]The beta cells of the islets of pancreas produces insulin. The preproinsulin is the initial component which is synthesized as a precursor polypeptide having single chain 86- amino acid. Thereafter undergoes proteolysis to give rise to proinsulin, which is related to IGF 1 & 2 structurally. Further cleavage from proinsulin gives rise to A & B chains of insulin and the C peptide. The beta cells store them together & in secretory granules which are then co secreted7.
SECRETION:
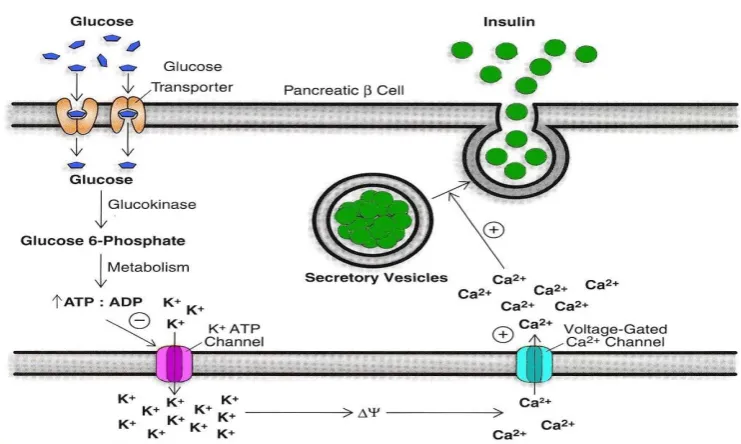
[image:20.595.122.493.483.705.2]Insulin secretion by beta cells of pancreas is influenced by many factors like, amino acids, nutrients, ketones, and gastrointestinal peptides. The most important key regulator being glucose. Insulin synthesis is stimulated when glucose levels are above 70mg/dl and primarily due to the enhancement of protein translation and its processing. The rate limiting step which controls the insulin secretion related to glucose regulation is glucokinase mediated glucose phosphorylation. Insulin secretion is stimulated when voltage gated calcium channels open due to depolarization of beta cell membrane induced by potassium channel inhibition7.
GLUT-2 mediates intracellular transport of glucose. glucose undergoes oxidation to yield ATP which inhibits potassium channel receptor on B cell. thereby causing membrane depolarisation, Ca2 ion influx followed by release of stored insulin.
Gastrointestinal tract also plays a role by releasing incretins from the neuroendocrine cells when food is ingested and thereby amplifies insulin secretion and suppresses secretion of glucagon. The L- cells of the small intestine release GLP-1 which stimulates secretion usually when blood glucose is more than the fasting level.
ACTION:
Figure 3. Metabolic pathway showing fuel metabolism & insulin
actions 14:
( + ) ---> stimulation by insulin
( - ) ---> inhibition by insulin
BLOOD GLUCOSE REGULATION :
Blood glucose regulation is very important for the survival of human beings. Glucose level has to be finely regulated so as to supply glucose to brain which does not have the capacity to store glucose. Glucose also acts as fuel for kidney and RBCs.
Figure 4. showing glucose metabolism( Glycogenolysis & Glycolysis )
GLUCOSE
G-6-P
GLYCOGENPYRUVATE
ACETYL coA
CITRIC ACID
CYCLE
FATTY ACIDS GLYCEROL
FAT
GLYCO
LY
SIS
Dietary carbohydrates are finally converted to glucose.15 Dietary or cellulose protein catabolism results in carbon atoms which are used in glucose synthesis, a process called gluconeogenesis. Tissues other than liver which oxidise glucose incompletely provide lactate which can be converted to glucose through gluconeogenesis15.
When blood glucose levels are low, there is no uptake of glucose by the liver. Conversely when there is high blood glucose, there will be increased blood glucose uptake by the liver and conversion of glucose to glycogen, stored for future needs.
Whenever there is high blood glucose, there will be high liver glucose. Under such conditions glucokinase activity is increased G6P is rapidly converted to GIP by the enzyme, phosphoglucomutase, which is then incorporated into glycogen15.
METABOLISM OF GLUCOSE IN DM2:
Glucose acts as an osmotic diuretic and its loss is accompanied by water and electrolyte loss causing polyuria. Polyuria stimulates thirst mechanism causing polydipsia16. Glycosuria, tissue catabolism and impairment of hypopthalamic regulation cause increased appetite and intake of food (Polyphagia)16.
TYPE 2 DIABETES MELLITUS:
[image:26.595.125.472.426.665.2]Type 2 DM is characterised by insulin resistance and deficient insulin secretion. The primary defect is still controversial. This systemic disorder has a very strong genetic component7.
TABLE 3 : GLUCOSE HOMEOSTASIS7
RISK FACTORS FOR TYPE 2 DM 7:
1. Family h/o DM
2. Obesity ( body mass index > 25 Kg/m2) 3. Race or ethnicity
a. African American b. Native American c. Asian American d. Latin
4. Presence of impaired fasting glucose, impaired glucose tolerance or HbA1c of 5.7 – 6.4%
5. Systemic hypertension ( BP > 140 mm of Hg ) 6. HDL cholesterol < 35 mg/dl
7. Triglycerides > 250 mg/dl
8. Polycystic ovarian syndrome or acanthosis nigricans 9. History of cardiovascular disease.
PATHOPHYSIOLOGY:
Initially the beta cells compensate for the insulin resistance in the early stages by increasing insulin output. As this progresses, the beta cells fail to sustain the hyperinsulinemic state. Impaired glucose tolerance develops i.e., elevation in post prandial glucose. Later occurs fasting hyperglycemia due to decline in secretion of insulin and increase in glucose production by liver. Finally there ensues beta cell failure7.
COMPLICATIONS OF TYPE 2 DIABETES MELLITUS :
ACUTE COMPLICATIONS:
Diabetic keto acidosis : it results from insulin deficiency which may be relative or absuolute, in combination with excess amount of counter regulatory hormones like cortisol, glucagon,
catecholamines, and growth hormone. There occurs promotion of glycogenolysis, gluconeogenesis along with ketone body
formation7.
Hyperglycaemic hyperosmolar state : this usually occurs in an elderly patient with Type 2 DM with history of polyuria and weight loss for several weeks. The patient finally ends up in mental confusion and lethargy, or coma.7 Acutemyocardial infarction and Acute cerebrovascular accident being the common cause which precipitates it.
Marked hyperglycemia ( >1000 mg/dl )
Hyper osmolality ( >350 mosmol/L )
Pre renal azotemia,
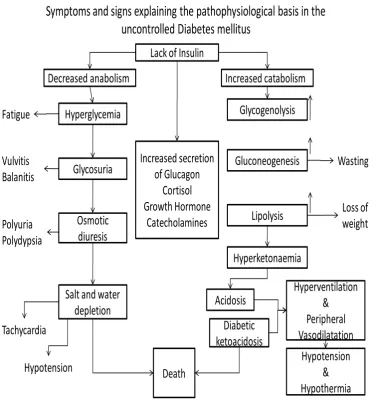
Symptoms and signs explaining the pathophysiological basis in the uncontrolled Diabetes mellitus
Lack of Insulin
Decreased anabolism Increased secretion of Glucagon Cortisol Growth Hormone Catecholamines Increased catabolism Hyperglycemia Glycosuria Osmotic diuresis Fatigue Vulvitis Balanitis Polyuria Polydypsia Glycogenolysis Gluconeogenesis Lipolysis Hyperketonaemia Acidosis Hyperventilation & Peripheral Vasodilatation Hypotension & Hypothermia Diabetic ketoacidosis Death Salt and water
[image:30.595.122.497.80.487.2]depletion Tachycardia Hypotension Wasting Loss of weight
Figure 5. pathophysiological basis for uncontrolled diabetes mellitus.
CHRONIC COMPLICATIONS7 :
MICROVASCULAR :
1. Eyes – retinopathy ( non proliferative/proliferative), macular edema 2. Nerves – neuropathy ( sensory/motor, autonomic )
3. Kidneys – nephropathy
1. Coronary heart disease 2. Cerebrovascular disease 3. Peripheral arterial disease
OTHERS :
1. Gastroparesis, diarrhea
2. Sexual dysfunction/ uropathy 3. Dermatological
4. Infections 5. Cataract 6. Glaucoma
7. Periodontal disease 8. Hearing loss
MECHANISM OF COMPLICATIONS :
There are atleast four theories, which can explain the chronic complications induced by hyperglycemia.
atherosclerosis, decrease synthesis of nitric oxide. It also causes endothelial & glomerular dysfunction and alters the extracellular matrix structure & its composition7.
The second theory states that hyperglycemia in increase glucose metabolism via a special pathway called sorbitol pathway. Metabolism of intracellular glucose predominantly takes place by phosphorylation and glycolysis subsequently. When glucose level increases, some is converted to sorbitol by the action of enzyme aldose reductase. Increase in sorbitol concentration can alter the redox potential therby increasing cellular osmolality, generating reactive oxygen species7.
The third one states that hyperglycemia activates protein kinase C. This can alter the gene transcription for fibronectin, contractile proteins, type 4 collagen and matrix protein in endothelial cells and neurons7.
The fourth theory states that there occurs an increase in flux via hexosamine pathway induced by hyperglycemia. It causes function alteration by protein glycosylation or by changing gene expression of TGF beta ie.., transforming growth factor- B or PAI-1 ie.., plasminogen activator inhibitor-1.(7)
The famous DCCT ie.., diabetes control and complications trial was a land mark study which emphasised on the concept that prompt control of chronic hyperglycemia would prevent many complications in case of type1 DM. More than 1400 members were randomized to either conventional diabetes management or intensive management. They were evaluated prospectively for the development of retinopathy, neuropathy or nephropathy.( 17,18,19,20 )
This study demonstrated that intensive glycemic control can slow down the progression of early complications in diabetes mellitus. Intensive treatment was in the form of multiple administrations of insulin each day along with educational & medical support. Conventional being twice daily insulin injections and quartenary clinical evaluation. (19,20 )
Results were: 1. Reduction in NPDR & PDR by 47%
2. Reduction in microalbuminuria by 39%
3. Reduction in clinical nephropathy by 54% & neuropathy by 60%.
Multiple treatment regimens were utilized for this randomized study ie.., one group with insulin & oral hypoglycaemic agents( sulfonylurea or metformin) and the other group were given conventional pharmacotherapy just to prevent symptoms.21
HbA1c of 7% was achieved with intensive treatment arm and 7.9% was in the standard treatment arm. Conclusion was for each percentage reduction in HbA1c there was 35% reduction in microvascular complications.21,22,23
Kumamoto study was a small trial study on japanesee with Type2 DM who were lean individuals. Results were reduction in risks of microvascular complications in them. These studies finally gives is an idea about the value of metabolic control in view of reducing the complications24.
OPHTHALMOLOGIC COMPLICATIONS OF TYPE 2DM:
vasculatures, retinal blood flow alteration. These finally lead to retinal ischaemia14.
Progressing retinal hypoxemia causes neovascularisation which is the hallmark of PDR. These new vessels appearing very near to optic nerve or/and macula can rupture easily causing vitreous haemorrhage and ultimately lading to retinal detachment. If NPDR is severe, it can evolve into PDR within 5 years. Macula edema is clinically significant oly when NPDR is present. Macula edema can be detected by fluorescien
angiography. Thereafter moderate visual loss will ensue in few years14.
Clinical features 14:
1. MICROANEURYSMS : this is the earliest detected abnormality in most cases. These are tiny and discrete looking circular red dots near to the vessels in retina. These microaneurysms look like
haemorrhagic spots and they arise from the venous end of capillaries.
2. HAEMORRHAGES : These are round & regular shaped which occur in deeper layers of retina and are called as blot haemorrhages
4. COTTON WOOL SPOTS : seen in rapidly progressing retinopathy due to arterial occlusions leading to retinal ischaemia.
5. VENOUS CHANGES : venous dilatation is an early abnormality due to increase in blood flow. Increased tortuosity and beading represents severe form of pre-proliferative retinopathy.
6. NEOVASCULARISATION : New vessels are formed in response to wide spread ischaemia. They arise from the venous circulation
forming arcades of tufts of vessels on the retinal surface. They can easily rupture and can cause pre retinal or vitreous haemorrhage. In severe cases causes sudden visual loss.
7. RUBEOSIS IRIDIS : these are new vessels forming on the anterior surface of iris. Its a sign of proliferative retinopathy. Obstruction at the angle of eye can cause secondary glaucoma.
DIABETIC NEPHROPATHY :
Diabetic retinopathy is a leading cause of morbidity and mortality related to diabetes mellitus. The risk of cardiovascular disease also increases in the presence of micro or macroalbuminuria. It is commonly associated with diabetic retinopathy7,37.
Chronic hyperglycemia leading to ESRD involves7,38 :
Effects of soluble factors like AGEs,
angiotensin 2, endothelin and growth factors.
Glomerular hyperfiltration by change in renal microcirculation.
Change in glomerular structure
Mesangial expansion & fibrosis.
Some of the effects are mediated through angiotensin 2 receptors. The main risk factors is positive family history of diabetes nephropathy. Smoking also causes decline in renal function. The sequential events which are predictable in the natural history of diabetic nephropathy in Type 2 DM appears to be similar to that of Type 1 DM7.
During the first years after the onset of diabetes , for example in Type 1 DM there occurs an increase in glomerular filtration rate due glomerular hyperperfusion. Over the first 5 years successive changes occur such as glomerular basement membrane thickening along with hypertrophy. Also there occurs expansion of the mesangium. After 5 to 10 years, microalbuminuria sets in and progresses to macroalbuminuria. This proceeds to ESRD in 7 o 10 years 7.
The nephropathy which develops in patients wih Type 2 DM differs from Type 1 in the following ways7 :
1. Albuminuria ( micro or macro ) may be present when the diagnosis of Type 2 DM is made.
4. Heart failure, hypertension , infections can also cause microalbuminuria which are actually secondary causes.
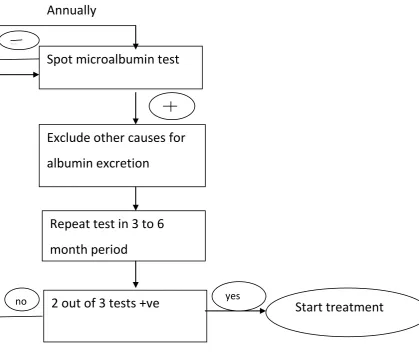
SCREENING FOR MICROALBUMINURIA:
It should be detected at an early stage when therapies can be institueted effectively. Microalbuminuria is an cardiovascular risk factor. Prompt glycemic control can reduce the rate of urine albumin excretion.
The effective interventions for preventing the progression of microalbuminuria to macroalbuminuria are7:
1. Glycemic control to normal levels. 2. Very strict control of blood pressure.
Figure 7. SCREENING FOR MICROALBUMINURIA
DIABETIC NEUROPATHY
The prevelance of DM in india is 4.3%25, whereas in west its around 1 – 2%26. The reason may be the insulin resistance which is more pronounced in asian Indians27. A recent study done in south india revealed 19.1% incidence rate of peripheral neuropathy in Type 2 DM28. it is one of the most commonest causes of peripheral neuropathy. Autonomic neuropathy due to diabetes causes death in 25%-50% within a period of 5-10 years29,30. In an another study, an increase in incidence of
Spot microalbumin test
Exclude other causes for
albumin excretion
Repeat test in 3 to 6
month period
2 out of 3 tests +ve Start treatment
--
yes no
neuropathy from 7.5% to 50% at 25 years follow up has been documented31.
CLINICAL CLASSIFICATION OF DIABETIC NEUROPATHY32 :
SYMMETRIC :
1. Polyneuropathy
2. Painful autonomic neuropathy
3. Painful distal neuropathy with loss of weight known as “diabetic cachexia”
4. Insulin neuritis
5. Polyneuropathy after DKA 6. CIDP with diabetes mellitus
ASYMMETRIC :
1. Radiculoplexoneuropathies ( lumbosacral, thoracic, cervical ) 2. Mononeuropathies
3. Median neuropthy ( wrist ) 4. Ulnar neuropathy (elbow )
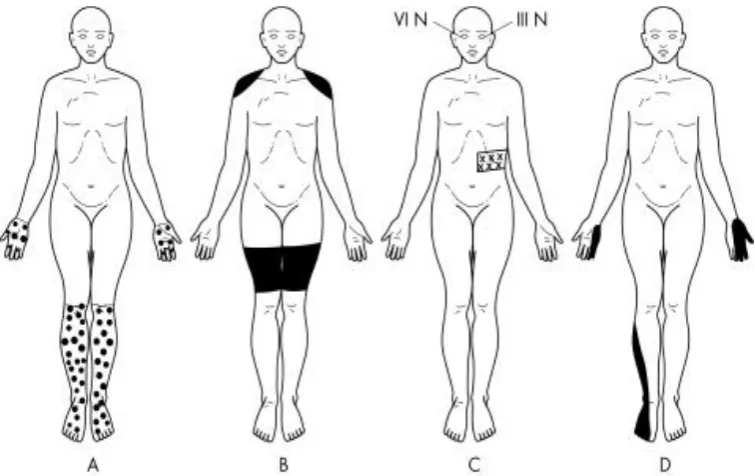
Figure 8. showing various presentations of diabetic neuropathy A. Distal symmetrical polyneuropathy
B. Proximal neuropathy C. Cranial neuropathy
D. Mononeuropathy multiplex
Various clinical features of diabetic autonomic neuropathy are :
resting tachycardia
orthostatic hypotension
bladder emptying abnormalities
sympathetic nervous system dysfunction ( hyperhidrosis, anhidrosis )
PATHOGENESIS OF DIABETIC NEUROPATHY :
Hyperglycemia causes increased endothelial vascular resistance and reduce the nerve blood flow. It also decreases the level of myoinositol in nerve fibres. Accumulation of fructose and sorbitol in nerve leads to non-enzymatic glycosylation of nerve proteins. Protein kinase C activation also plays a major role in vascular damage to nerve resulting in defective axonal transport7.
DIAGNOSIS :
It includes assessment of power of muscle, assessment of posterior column and temperature sensations. Tuning fork of 128 Hz is used for testing vibration sense and microfilament of 1 gm for testing touch sensation33. The tests based on blood pressure and heart rate response to specific manoeuvres are used to assess autonomic functions. Nerve biopsy is useful just to exclude other causes of neuropathy34.
CARDIOVASCULAR MORBIDITY AND MORTALITY
The very famous FRAMINGHAM HEART STUDY concluded saying increase in the incidence of heart failure, coronary heart disease, peripheral arterial disease and sudden death in diabetes patients. DM has been considered as “CHD risk equivalent” by American heart association. Synergism of increased glucose level with other cardiac risk factor, is the likely the cause of increase in cardiovascular morbidity and mortality rates. The other risk factors include hypertension, obesity, dyslipidemia, physical inactivity, and smoking. Type 2 DM patients have increased levels of PAI-1 (plasminogen activator inhibitor-1) & fibrinogen, which impairs fibrinolysis and enhance the coagulation process7.
GASTROINTESTINAL AND GENITOURINARY DYSFUNCTION
The genitourinary abnormalities includes, erectile dysfunction,
decreased sexual desire, decreased vaginal lubrication, dyspareunia. Diabetic cystopathy is defined as inability to sense the fullness of bladder
& difficulty to void urine comple ely. Later progresses to symptoms like urinary hesitancy and incontinence7.
INFECTIONS
Diabetic patients have increased frequency and severity of infections. The factors responsible include, defective cell mediated immunity & phagocyte dysfunction due to hyperglycemia, along with decreased vascularization. Some rare infections like rhinocerebral mucormycosis, emphysematous pyelonephritis & gall bladder, malignant otitis externa are excluding seen in Type 2 DM7.
DERMATOLOGICAL MANIFESTATIONS
Defective wound healing and ulcerations of skin are common skin manifestations of DM. The pigmented pretibial papules starts with an area of erythema and evolving into circular hyperpigmentation. These results from minor trauma in the pretibial region.7
The other specific skin disorders includes7
a. Bullosa diabeticorum
b. Necrobiosis lipoidicum diabeticorum c. Granuloma annularae
d. Sclerederma.
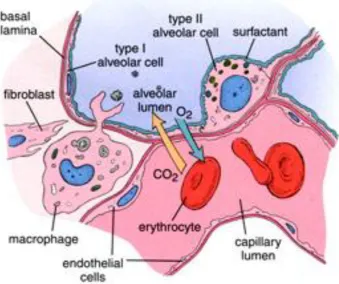
EFFECT OF DIABETES ON RESPIRATORY SYSTEM:
microangiopathy which leads to decreased diffusing capacity and endurance of respiratory musculature.
Figure 9. showing alveolar structure
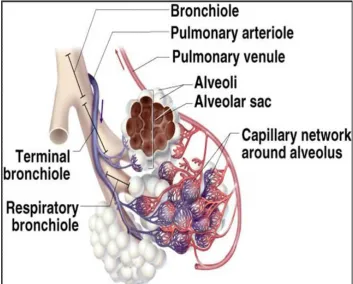
PULMONARY FUNCTION TEST:
ventillation, diffusion, oxygen transport and its utilisation. Lungs also play a vital role in maintaining the acid base balance in our body39.
Figure 10 . showing the bronchopulmonary tree with its vasculature
Assessment of pulmonary functions has a wide range of applications39 :
1. Characterising the type of dysfunction to aid diagnosis 2. Preoperative evaluation
Spirometer is a simple instrument which is used to diagnose and manage patients with pulmonary disorders. The interpretation is challenging as it is mainly dependent on patients effort and the interpreter's knowledge about the reference values as per age, sex and weight. A stepwise method is recommended. Determining the validity of the test should be the first step. Next being the determination of ventillatory pattern ie., normal, obstructive or restrictive39.
Spirometry Measurements
Spirometry records and measures the rate of lung volume changes during forcefull breathing. It begins with a full inhalation, followed by rapid emptying of the lungs by forced exhalation, continuing till a plateau in exhaled volume is attained. These efforts are finally recorded and graphed.
figure 11. normal spirometric flow curve
.
Diagram showing normal spirometric flow
(A) Flow-volume curve
(B) Volume-time curve extending
Figure 12. patterns of spirometric curves
Interpreting Spirometry Results
At least 3 acceptable spirograms should be obtained to determine the validity of results. Every time, patient should exhale for at least 6 secs and stop when no volume change occurs for 1 second. The session is over when the difference between 2 largest FVC values and between the 2 largest FEV1 values is within 0.2 L. If both these are not met even after three times, interpretation is not recommended. Tests should be repeated till the criteria are met44.
When there is decrease in FVC and FEV1 , it could be obstructive or restrictive but the distinction will depend on the absolute FEV1/FVC ratio. If ratio is normal or increased, a restrictive defect may be present. However, to confirm restrictive lung disease, the patient should assessed with respect to his lung volumes. If the TLC is<80%, the pattern is restrictive.
A reduced FEV1 and absolute FEV1/FVC ratio suggests an obstructive ventilatory pattern. The mid-expiratory flow rate (FEF 25–75%)
is the average forced expiratory flow rate recorded over the middle 50 % of the FVC. It helps in diagnosing an obstructive ventilatory pattern.usually the reduction in FEF 25–75% of <60 % of the predicted
and low to normal FEV1/FVC ratio may confirm airway obstruction 45
testing is necessary to further define the detected abnormality by spirometry. Static lung volume measurement is required to make a definitive diagnosis of restrictive type of lung disorder.
HISTORICAL REVIEW ON WORKS RELATED TO PFT IN TYPE 2 DM
P.Lang et al documented the possible associations between Diabetes mellitus, plasma glucose and the spirometric values like FVC & FEV1. They did a cross sectional study covering about 11,763 subjects of Copenhagen city. It showed slight impairement in lung function which was more prominent in diabetic subjects, who were taking insulin than those taking oral hypoglycaemic agents. They finally concluded saying that both
IDDM & NIDDM were having reduced lung functions since they had decreased FVC & FEV1.46
There are many studies which have reported decreased pulmonary capacity in DM patients due to changes in elastic properties of lungs.47,48,49,50
Davis.A.Wendy et al studied and explained about the concept of reduced pulmonary function test in Type 2 DM in association with their glycemic exposure. This study included 495 patients with Type 2 DM and were studied between 1993 to 1994 by cohort study and 125 were restudied after 7 years. They found a decrease in mean % predicted values and annual decline of FVC, FEV1, PEF and Vital capacity.52
Is lung a “target organ” in diabetes mellitus was popular study carried out by Malcolm Sander. There is evidence of lung involvement in diabetic patients which is histopathologically proven ie.., by the process of alveolar epithelial thickening and thickening in the basal lamina of pulmonary capillaries highly suggesting the phenomenon of pulmonary microangiopathy. Probably the alteration in lung tissue is due to the non-enzymatic glycosylation, which thereby causes decreased elastic recoiling of lung tissues. These changes finally leading to reduced lung volumes in diabetes mellitus.53
spirometric measures, but there was a correlation with respect to duration of diabetes mellitus.54
Sreeja C.K et al studied lung function on 20 subjects with Type 2 DM, 20 with Type 1 DM and 40 control subjects. It showed significant reduction in FEV1/FVC, total lung capacity and lung volumes in both diabetic groups compared to control. They also suggested alteration in collagen tissue of lungs & loss its of recoiling capacity.55
Mohan kumar et al studied on pulmonary complications in diabetics of elderly age group. Total lung capacity, lung volume and compliance of lung are decreased. Diffusion capacity of carbon monoxide was also reduced in them. They attributed the presence of increased non-enzymatic glycosylation which interferes with connective tissue cross linkages56.
Dharwadkar AR et al studied 40 type 2 DM patients with age above 30 years and duration of 1 to 20 years. He showed reduction in lung parameters like FEV1, FEV1% and demonstrated negative correlation with respect to glycemic status57
Hsin-chieh et al did a cross sectional study in diabetic patients & prospectively analysed the association with declining lung functions. The diabetic group showed significant reduction in FVC and FEV1.59
MATERIALS AND METHODOLOGY
45 Type 2DM patients were selected for this study of age more than 35 years and with duration of diabetes > 5 years. These patients were selected from Dr.Ambedkar Institute Of Diabetology, KMCH (kilpauk medical college hospital ) who were getting treated as out patients. 45 healthy volunteers were assigned as control group, most of them being staffs of kilpauk medical college hospital.
This study was a randomised case control study carried out from January 2011 to December 2011,in collaboration with departments of Diabetology, Respiratory medicine, & Department of ophthalmology. The exclusion criterias were Smokers, history of hypertension, obesity, previous history of lung disease (COPD, PTB, PT SEQULAE ), Subjects with signs & symptoms of respiratory infection at the time of test, Subjects having history of admission for respiratory illness during past 6months & Subjects with cardiovascular illness.
DESCRIPTION OF THE DEVICE :
[image:60.595.107.534.414.673.2]“SPIROLAB” is a new generation spirometer. It facilitates the total valuation of lung functions. This apparatus can measure FVC(forced vital capacity), VC(slow vital capacity), MVV(maximum voluntary ventilation test) and breathing pattern tests and calculates an index of test acceptability and a measure of reproducibility , and also gives functional interpretation following the latest American thoracic society classification.
Figure 14 showing SPIROMETER:
Display
Flow sensor
Mouth piece
Key board
This apparatus is supplied with an RS-232 opto-isolated serial communication port. The core of the system is a flow meter which is a bi-directional digital turbine flow meter which is connected through the serial port RS-232 to a data elaboration device that use electronic and mechanical procession components.
The spirometric parameters are measured and displayed after each test. The flow/volume curve is shown in real time. Each time can be repeated several times. The best parameters are used for interpretation. After each test session, the results are compared to the relevant predicted values and the percentage ratio between measured and predicted is shown for each parameter. The predicted values are selected as recommended by ERS (European Respiratory Society).
% predicted = measured/predicted × 100
MEASURING HbA1c :
HbA1c is a measure of the quantity of glucose which is attached to the haemoglobin present in red blood cells. The higher the A1c, the higher was the blood glucose levels over the last two to three months. HbA1c was measured for the study group using “BIO-RAD” method.
MEASURING FOR MICROALBUMINURIA :
Microalbuminuria was measured in a spot urine sample collected from the patient. The interpretation about the presence was made on basis of ADA recommendations. The method used was NEPHALOMETRY.
NORMAL < 30 mg/g creatinine
MICROALBUMINURIA 30-299 mg/g creatinine
NEPHROPATHY >300 mg/g creatinine
STATISCAL ANALYSIS: The SPSS software was used to analyse the
SELECTION OF GROUPS :
The diabetics were selected from diabetology out patient clinic. All were of age more than 35 years and with more than 5 years duration of diabetes. An elaborate medical history was obtained through a questionnaire which covered patients general details, smoking history, family history, treatment history to rule out the exclusion criterias. Height, weight and BMI, waist circumference was recorded. They were screened for hypertension as per JNC 7 blood pressure guidelinesJNC 7. Blood sample for measuring FBS, ECG to rule out ischaemic heart disease, chest xray to rule out COPD and other respiratory illness like tuberculosis (new or old) were taken. Volunteers for the control group were selected in the same above said way.
BMI:
BMI was calculated as weight( in kgs ) / height 2 (in meters).
BMI>30 were excluded from the study.
BLOOD PRESSURE :
diabetic group, the measurement in standing position was also made to find out postural hypotension.
WAIST CIRCUMFERENCE :
The waist circumference was measured from the midpoint between the lower ribs measured at the sides and the iliac crest. This was done using a measuring tape.
PROCEDURE OF LUNG FUNCTION TESTING :
The procedure of spirometry test was demonstrated to both the groups and the test was done for them after obtaining written consent from them. The test was done using a RS 232-C spirometer. It was repeated 3 times at an interval of 15 minutes. The following values were recorded:
FVC
FEV1
FEV1/FVC
PEF
FEF 25%-75%
PROCEDURE :
Figure 15. showing how spirometry is done
The best of 3 values were taken and interpretation was made.
After 2 hours, blood sample was taken for measuring PPBS and HbA1c levels. Urine was tested for the diabetic group for the presence of albumin. The diabetic patients were shown to an expert ophthalmologist in KMCH to check for the presence of diabetic retinopathy.
1. Student ‘t’ test which was used to find out the significant
difference of pulmonary functions between the study and control group.
RESULTS AND ANALYSIS
Spirometry was done in 45 Type 2 DM patients & 45 healthy volunteers. The aim was to find out the effect of diabetes mellitus on lung functions.
The basis characters of both the groups are shown in Table. 6. The results of the spirometry test for both the groups are shown in Table- & Table-. Rearrangements of the master charts were done according to the requirements to find out the relationship of variables like duration of DM, FBS, PPBS, HbA1c on the pulmonary functions.
Student ‘t’test was used to analyse the statistical difference of the spirometric values between the 2 groups.
Table 5. showing sex distribution in case & control groups
Group Sex Frequency %
Case
Male 15 33.3
Female 30 66.7
Control
Male 15 33.3
Female 30 66.7
Both the groups ( CASE & CONTROL ) had 15 males and 30 females. They were of age more than 35 years with a BMI of less than 30.
Male
Female
Male
Female
Table 6. showing comparison of spirometric values of the 2 groups
Parameters
Case Control 'p' value
Mean Range SD Mean Range SD
FVC 2.09
1.41-3.21 0.55 2.8
1.72-3.93 0.63
0.000
FEV1 1.87
0.95-3.33 0.54 2.6
1.67-5.35 0.7
0.000
FEV1/FVC 87.38
50.3-96.1 7.16 90.58
77.9-94.1 2.77
0.006
PEF 3.96 1.6-7.81 1.6 5.1
2.43-8.34 1.76
0.002
FEF
25-75% 2.41
1.03-5.62 1.04 3.63
1.94-5.36 1.02
0.000
Impact of Type 2DM on Pulmonary functions
0 10 20 30 40 50 60 70 80 90 100
FVC FEV1 FEV1/FVC PEF FEF 25-75%
Case
Control Graph 1.showing difference in spirometric values between 2 groups
Type 2DM and FVC :
Table - & graph – reveals that the FVC in Type 2 DM is decreased when compared to the control group. Type 2 DM patients having a mean at 2.09±0.55 with a range of 1.41-3.21 compared to controls having a mean of 2.80±0.63 with a range of 1.72-3.93.
[image:70.595.101.491.126.404.2]Type 2DM and FEV1 :
Table - & graph – reveals that the FEV1 in Type 2 DM is decreased when compared to the control group. Type 2 DM patients had a mean at 1.87±0.54 with a range of 0.95-3.33 compared to controls having a mean of 2.60±0.70 with a range of 1.67-5.35.
This result also favours the concept of Timothy’s study who showed an average of 9.5% decrement of FEV1 in diabetic patients.
Type 2 DM and FEV1/FVC :
Table - & graph- shows that there is little difference in FEV1/FVC in the form of decrement when compared to the controls, which is of statistical significance.
Type 2 DM patients had a mean at 87.38±7.16 with a range of 50.3-96.1 compared to controls having a mean of 90.58±2.77 with a range of 77.9-94.1.
Type 2 DM and PEF :
at 3.96±1.60 with a range of 1.6-7.81 compared to controls having a mean of 5.10±1.76 with a range of 2.43-8.34.
Type 2 DM and FEF 25-75% :
[image:72.595.117.528.395.654.2]Table - & graph – reveals that the FEF25-75% in Type 2 DM is decreased when compared to the control group. Type 2 DM patients having a mean at 2.41±1.04 with a range of 1.03-5.62 compared to controls having a mean of 3.63±1.02 with a range of 1.94-5.36.
Table 7. showing the difference in % prediction between 2 groups
Parameters Group Mean S.D 'p' value
FVC% Case 84.84 17.05 0.000
Control 95.87 9.47
FEV1% Case 90.24 16.62 0.000
Control 102.91 10.63
FEV1/FVC% Case 110.69 8.87 0.034 Control 113.8 3.89
PEF% Case 58.96 18.43 0.001
Control 70.76 13.72
0 20 40 60 80 100 120
Case Control Case Control Case Control Case Control Case Control
FVC% FEV1% FEV1/FVC% PEF% FEF 25-75%
Graph 2. showing the difference in % prediction between 2 groups
Type 2 DM and FVC%
Type 2 DM and FEV1%
FEV1% is decreased in diabetic group when compared to the controls. The mean in diabetic group being 90.24±16.62 when compared 102.91±10.63 in control group.
Type 2 DM and FEV1/FVC%
FEV1/FVC% is decreased in diabetic group when compared to the controls. The mean in diabetic group being 110.69 ±8.87 when compared to 113.80 ±3.89 in control group.
Type 2 DM and PEF%
PEF% is decreased in diabetic group when compared to the controls. The mean in diabetic group being 58.96 ±18.43 when compared to70.76 ±13.72 in control group.
Type 2 DM and FEF 25-75%
Table 8. DISTRIBUTION OF SPIROMETRIC
PATTERN IN TYPE 2 DM
Spirometric
pattern Case Control
Normal
Count 25 45
% within
interpretation 35.70% 64.30%
Mild restriction
Count 14 0
% within
interpretation 100% 0 Moderate
restriction
Count 6 0
% within
interpretation 100% 0
Graph 3. showing pattern of lung function in diabetic group
0 5 10 15 20 25 30 35 40 45
case control case control case control
31% of the diabetics had mild restriction of pulmonary functions
13% of the diabetics had moderate restriction of pulmonary functions.
[image:76.595.142.477.346.603.2] These collectively had long duration of DM compared to rest of the diabetics who underwent spirometry test.
TABLE 9. CORRELATION OF PFT VALUES WITH
DURATION OF DIABETES
FVC
FVC-R -0.280
FVC% -0.445**
FEV1
FEV1-R -0.259 FEV1% -0.498**
FEV1/FVC
FEV1/FVC-R -0.253 FEV1/FVC% -0.209
PEF
PEF-R -0.296*
PEF% -0.471**
FEF 25-75%
FEF 25-75%-R -0.297* FEF 25-75%(%) -0.461**
FVC & Duration of Diabetes
FVC-R has a weak negative correlation with respect to duration of diabetes. FVC% has more strong negative correlation with respect to duration of diabetes, which is more significant, ie.., FVC decreases with increasing duration of diabetes.
FEV1 & Duration of Diabetes
FEV1-R has a weak negative correlation with respect to duration of diabetes. FEV1 % has more strong negative correlation with respect to duration of diabetes, which is more significant, ie.., FEV1 decreases with increasing duration of diabetes
FEV1/FVC & Duration of Diabetes
FEV1/FVC-R has a weak negative correlation with respect to duration of diabetes ie..,FEV1/ FVC decreases with increasing duration of diabetes. FEV1/ FVC% also has a weak negative correlation with respect to duration of diabetes.
PEF & Duration of Diabetes
diabetes. PEF% has more strong negative correlation with respect to duration of diabetes, which is more significant.
FEF 25-75% & Duration of Diabetes
FEF 25-75%-R has a moderate negative correlation with respect to duration of diabetes ie.., FEF 25-75% decreases with increasing duration of diabetes.
Table 10. CORRELATION OF FBS WITH PFT VARIABLES
FVC
FVC-R -0.49**
FVC% -0.691**
FEV1
FEV1-R -0.271 FEV1% -0.477**
FEV1/FVC
FEV1/FVC-R -0.088 FEV1/FVC% -0.087
PEF
PEF-R -0.287
PEF% -0.58**
FEF 25-75%
FEF 25-75%-R -0.525** FEF 25-75%(%) -0.644**
**. Correlation is significant at the 0.01 level (2-tailed).
Effect of FBS on FVC
Both FVC & FVC% have a strong negative correlation with fasting blood sugar values, ie.., FVC & FVC% decreases as the FBS increases.
Effect of FBS on FEV1
Effect of FBS on FEV1/FVC
Both FEV1/FVC & FEV1/FVC% have no significant relationship with respect to the FBS values.
Effect of FBS on PEF
PEF has a weak negative correlation than the PEF% which has a strong negative correlation, ie., PEF% decreases as FBS value increases.
Effect of FBS on FEF25-75%
Table 11. CORRELATION OF PPBS WITH PFT VARIABLES
FVC
FVC-R -0.548**
FVC% -0.742**
FEV1
FEV1-R -0.319*
FEV1% -0.527**
FEV1/FVC
FEV1/FVC-R -0.093 FEV1/FVC% -0.088
PEF
PEF-R -0.307*
PEF% -0.577**
FEF 25-75%
FEF 25-75%-R -0.606** FEF 25-75%(%) -0.713**
**. Correlation is significant at the 0.01 level (2-tailed).
Effect of PPBS on FVC
Effect of PPBS on FEV1
FEV1 has a moderate negative correlation than the FEV1% which has a strong negative correlation, ie., FEV1 & FEV1% decreases as PPBS value increases.
Effect of PPBS on FEV1/FVC
Both FEV1/FVC & FEV1/FVC% have no significant relationship with respect to the PPBS values.
Effect of PPBS on PEF
PEF has a moderate negative correlation than the PEF% which has a strong negative correlation, ie., PEF% decreases as PPBS value increases
Effect of PPBS on FEF25-75%
Table 12.CORRELATION OF HbA1c WITH PFT VARIABLES
FVC
FVC-R -0.301*
FVC% -0.45**
FEV1
FEV1-R -0.288
FEV1% -0.483**
FEV1/FVC
FEV1/FVC-R -0.211 FEV1/FVC% -0.191
PEF
PEF-R -0.329*
PEF% -0.515**
FEF 25-75%
FEF 25-75%-R -0.339* FEF 25-75%(%) -0.453**
**. Correlation is significant at the 0.01 level (2-tailed).
Effect of HbA1c on FVC
Effect of HbA1c on FEV1
FEV1 has a weak negative correlation than the FEV1% which has a strong negative correlation, ie., FEV1 & FEV1% decreases as HbA1c value increases.
Effect of HbA1c on FEV1/FVC
FEV1/FVC has a weak negative correlation & FEV1/FVC% has no significant relationship with respect to the HbA1c values.
Effect of HbA1c on PEF
PEF has a moderate negative correlation than the PEF% which has a strong negative correlation, ie., PEF% decreases as HbA1c value increases
Effect of HbA1c on FEF25-75%
Graph 4. showing association of restrictive lung function with other
diabetic complications
Out of the 20 diabetic patients who had restrictive pattern lung function, 10 had diabetic nephropathy & 6 had retinopathy changes.
9 had family history of diabetes mellitus.
DISCUSSION
This study was done to find out the impact of diabetes or the pulmonary functions. Two Groups namely the study & control groups were assigned with equal sex distribution along with fulfilment of inclusion and exclusion criteria already mentioned.
All the Spirometric values namely FVC, FEV1, FEV1/FVC, PEF, FEF 25-75% were having a mean decrease in diabetic group compared to the control group which was statistically proven by getting a P value of <0.05.
The % prediction of the Spirometric parameters also showed a decrease in diabetic group compared to the controls.
Among the 45 patients in diabetic groups, 14 had mild restrictive and 6 of their had moderate Spirometric pattern when analysed individually.
EFFECT OF DURATION OF DM-2 ON PULMONARY
FUNCTIONS:
duration of DM-2. ie., they tend to decrease with respect to increase in duration of DM-2. FEV1/FVC had only a weak negative correlation with the duration of DM-2
This Outcome was in favourable with the concept of Davis Timothy et al’s study. They too showed a negative correlation of Spirometric values with the duration of Diabetes.
EFFECT OF FBS ON PULMONARY FUNCTION:
This study showed a strong negative correlation of FVC & %, FEV1%, PEF%, FEF 25-75% & its % with respect to FBS values, ie., these parameters tend to decrease with respect to increase in FBS values. But, the FEV1/FVC did not show any significant correlation.
EFFECT OF PPBS ON PULMONAY FUNCTION:
This was similar to the results of “P.Lang et al” study who showed negative correlation of spirometric values with respect of Spirometric values with respect to the glycemic status.
EFFECT OF HbA1c ON PULMONARY FUNCTION:
This study showed a strong negative correlation of FVC%, FEV1%, PEF% and FEF 25-75% with respect to the HbA1c level. ie., They tend to decrease with respect to increase in HbA1c levels which means that the Spirometric parameters decrease more in the poorly controlled diabetes patients.
5 out of 45 in the diabetic group were having mild NPDR, and they showed also mild restriction pattern in spirometry. 1 had PDR in fundus and moderate restriction in spirometry.
Out of the 20 diabetic patients who had restrictive pattern lung function, 10 had diabetic nephropathy & 6 had retinopathy changes. Which suggested the presence of microvascular complications.
CONCLUSION
1. The spirometric parameters in general were consistently lower in the diabetic group compared to the non diabetic group.
2. All the 5 parameters ie.., FVC, FEV1, FEV1/FVC, PEF, FEF 25-75% which were planned for the comparison showed statistically
significant difference in form of decrement in diabetic group compared to the non-diabetics.
3. The pattern of spirometric parameters in diabetic group suggested the prevelance of restriction pattern in lung functions, which can be attributed to the non-enzymatic glycosylation of connective tissue resulting in the same
4. Patients with diabetic retinopathy invariably had restriction pattern in spirometry.
5. All these points to a conclusion that DIABETES MELLITUS causes decrement in lung functions in the form of restriction which is more seen in patients with longer duration of DM & patients with uncontrolled glycemic status.
LIMITATIONS AND RECOMMENDATIONS
1. The study population was too small, it needs a bigger population and extensive datas to define the significant difference in a more accurate way.
2. Smoking and hypertension were the exclusion criterias., so it was difficult to collect male diabetics who were non smokers and without hypertension. Smoking was ruled out based on patients history, and there is a question of reliability.
3. Cardiac disease was ruled out on the basis of history and
electrocardiogram. Echocardiogram was not done for the diabetics, so silent ischaemia in diabetics was not ruled out confidently.
4. There may be other confounding factors too which could have affected the result of this tudy, since patients were selected only based on a simple history taking and clinical examination.
BIBLIOGRAPHY
1. Kasper, Braunwald, Fauci, 2004, Harrisons principles of internal medicine 17th edition vol 2, page 2286-2290
2. Marvisi M, Lino Bartolini L, del Borrello P, Brianti M, Marrani G, Guariglia A, et al. Pulmonary Function in non-insulin-dependent diabetes mellitus. Respiration 2001; 68;268-72.
3. Ljubic s, Metelko z, car N, Roglic G, Drazic Z. Reduction of diffusion capacity for carbon monoxide in diabetic patients. Chest 1998; 114:1033-5
4. King H, Albert R, Herman W. Global burden of diabetes 19952025: prevalence numerical estimates and projections. Diabetes care 1998; 21:1414-31.
5. Benbassat Carlos A, Ervin Stern, Mordechai Kramer, Joseph Lebzelter, Ilana Blum, Gershon Fink. Pulmonary function in patients with Diabetes Mellitus. The Am J Med Sci 2001; 322(3):127-132.
6. Sandler Malcom. Is the Lung a Target Organ in Diabetes Mellitus. Arch Intern Med.1990;150: 1385-1388.
8. Gupta R, Joshi P, Mohan V, et al. Epidemiology and causation of coronary heart disease and stroke in india. Heart 2008; 94: 16-26.
9. International Diabetes Federation Website. President of International Diabetes Federation calls for concerted action to stop Diabetes epidemic. http://www.idf.org/president-interna.
10. Ramachandran A, Mary S, Yamuna A, et al. High prevalence of diabetes of diabetes and cardiovascular risk factors associated with urbanization in India Diabetes care. 2008; 31:893-898.
11. http://www.idf.org/diabetes atlas/ 5th edition/mortality.
12. International Diabetes Federation. The IDF Diabetes Atlas. 4th edition. Brussels : International Diabetes Federation; 2009
13. Roglic G, Unwin N. Mortality attributable to diabetes: estimate for the year 2010. Diabetes Res clin Pract 2010; 87(1) : 15-19.
14. B.M.Frier, M.Fisher; Davidsons’s Principles & Practice of Medicine.Chapter 21:Diabetes Mellitus.
15. Robert B Tattersall. History of diabetes mellitus, Picket and Williams Text book of Diabetes mellitus: Blackwell Scientific; 3rd edition(1) : 1-20; 2003.
17. The Diabetes Control and Complications Trial Research Group. The effect of intensive treatment of diabetes on the development and progression of long-term complications in insulin-dependent diabetes mellitus. New Engl J Med 1993;329: 683-9.
18. DCCT Research Group. Effect of intensive diabetes management on macrovascular events and risk factors in the Diabetes Control and Complications Trial. Am J Cardiol 1995;5:894-903.
19. The Diabetes Control And Complications Trial.The Epidemiology of Diabetes Interventions and Complications (EDIC) study. JAMA
2003;290:2159-67.
20. DCCT Research Group. Implementation of treatment protocols in the Diabetes Control and Complications Trial. Diabetes Care
1995;18:361-76.
21. UK Prospective Diabetes Study Group: Intensive blood-glucose control with sulphonylureas or insulin compared with conventional treatment and risk of complications in patients with type 2 diabetes (UKPDS 33). Lancet352:837–853, 1998
23. UK Prospective Diabetes Study Group: Tight blood pressure control and risk of macrovascular and microvascular complications in type 2 diabetes (UKPDS 38). BMJ317:703–713, 1998
24. Ohkubo Y, Kishikawa H, Araki E, Miyata T, Isami S, Motoyoshi S, Kojima Y, Diabetes Res Clin Pract 28:103–117, 1995 Furuyoshi N, Shichiri M:
25. Sadikot S M, Nigam A, Das S. et al The burden of diabetes and impaired glucose tolerance in India using the WHO 1999 criteria: prevalence of diabetes in India study (PODIS). Diabetes Res Clin Pract 2004. 66301–307.307.
26. Pickup J, Wilham G. Epidemiology of diabetes. In: Guikshank K, ed. Textbook of diabetes. New York: Blackwell Science, 1991.
27. Bajaj M, Banerji M A. Type 2 diabetes in South Asians: a pathophysiologic focus on the Asian Indian epidemic. Curr Diab Rep 2004. 4213–218.218.
28. Ashok S, Ramu M, Deepa R. et al Prevalence of neuropathy in type 2 diabetes patients attending diabetes center in South India. J Assoc Physicians India 2002. 50546–550.550.
30. Rathmann W, Ziegler D, Jahnke M. et al Mortality in diabetic patients with cardiovascular autonomic neuropathy. Diabet Med 1993. 10820–824.824.
31. Pirart J. Diabetes mellitus and its degenerative complications: a prospective study of 4400 patients observed between 1947 and 1973 (third and last part). Diabetes Metab 1977. 3245–256.256.
32. Dyck P J B, Sinnreich M. Diabetic Neuropathies. Continuum 2003. 919–34.34.
33. Shy M E, Frohman E M, So Y T. et al Quantitative sensory testing. Neurology 2003. 602898–906.906.
34. Kennedy W R, Wendelschafer‐Crabb G, Johnson T. Quantitation of epidermal nerves in diabetic neuropathy. Neurology 1996. 471042–1048.1048.
35. Consensus statement Report and recommendations of the San Antonio conference on diabetic neuropathy. American Diabetic association, American Academy of Neurology. Diabetes Care 1988. 11592–597.597.
36. Arezzo J C. The use of electrophysiology for the assessment of diabetic neuropathy. Neurosci Res Comm 1997. 2113–22.22.
38. Parving H, Mauer M, Fioretto P, Rossing P, Ritz E. Diabetic Nephropathy. Brenner and Rector's The Kidney. 9th ed. Philadelphia, Pa: Saunders Elsevier; 2011: chap 38.
39. Timothy J. Barriero, D.O., and Irene Perillo, M.D., University of Rochester School of Medicine and Dentistry, Rochester, New York) Am Fam Physician. 2004 Mar 1;69(5):1107-1115
40. Colp CR. Interpretation of pulmonary function tests. Chest. 1979;76:377–8.
41. Crapo RO. Pulmonary-function testing. N Engl J Med. 1994; 331:25–30.
42. Petty T L. Simple office spirometry. Clin Chest Med. 2001; 22:845–59.
43. Margolis ML, Montoya FJ, Palma WR Jr. Pulmonary function tests: comparison of 95th percentile-based and conventional criteria of normality. South Med J. 1997;90:1187–91.
44. Crapo RO, Morris AH. Pulmonary function testing: sources of error in measurement and interpretation. South Med J. 1989;82:875–9.
46. P.Lange, S.Groth, J.Kastrup, M.Appleyard, J.Jansen, P.Schnohr Diabetes mellitus, plasma glucose & lung function in a cross sectional population study, Eur Resp J 1989,2.14-19.
47. Sandler M et al. Pulmonary function in IDDM with limited joint mobility. Chest 90;670,1986.
48. Uchida K et al. The findings of ventilation & perfusion scintigrams in patients with DM Resiper res.7:345,1988.
49. Schenthaner G et al. Lung elasticity in juvenile onset DM. Am Rev Respire Dis, 1977,113,37-41.
50. Jensen G et al. Epidemiology of chest pain & angina pectoris (thesis) Acta Med Scand ; 1984,suppl.682.
51. Walter.E.Robert, Alexa Beiser, Rachel J, Givelber, George T, O’Connor et al. Association between glycemic state & lung function. Am J Respir Crit Care Med 2003; 167:911-916.
52. Davis A Wendy, Mathhew knuiman, Peter kendell, Valerie Grange. Timothy M.E.Davis; Glycemic exposure is associated witj reduced pulmonary function in type 2 DM. Diabetes care 2004: 27:752-757.
53. Sandler Malcom. Is the Lung a ‘Target organ’ in Diabetes mellitus. Arch Intern Med.1990; 150: 1385-1388.