0022-538X/10/$12.00 doi:10.1128/JVI.01890-09
Copyright © 2010, American Society for Microbiology. All Rights Reserved.
Estimation of the Size of Genetic Bottlenecks in Cell-to-Cell Movement
of
Soil-Borne Wheat Mosaic Virus
and the Possible Role of the
Bottlenecks in Speeding Up Selection of Variations in
trans
-Acting Genes or Elements
䌤
§
Shuhei Miyashita
1,2,3* and Hirohisa Kishino
1Graduate School of Agricultural and Life Sciences1and Asian Natural Environmental Science Center (ANESC),2University of Tokyo, 1-1-1 Yayoi, Bunkyo-ku, Tokyo 113-8657, Japan, and PRESTO, Japan Science and Technology Agency (JST),
4-1-8 Honcho Kawaguchi, Saitama 332-0012, Japan3
Received 6 September 2009/Accepted 20 November 2009
Genetic bottlenecks facilitate the fixation and extinction of variants in populations, and viral populations are no exception to this theory. To examine the existence of genetic bottlenecks in cell-to-cell movement of plant RNA viruses, we prepared constructs forSoil-borne wheat mosaic virus RNA2 vectors carrying two different fluorescent proteins, yellow fluorescent protein (YFP) and cyan fluorescent protein (CFP). Coinoculation of host plant leaves with the two RNA2 vectors and the wild-type RNA1 showed separation of the two vector RNA2s, mostly within seven to nine cell-to-cell movements from individual initially coinfected cells. Our statistical analysis showed that the number of viral RNA genomes establishing infection in adjacent cells after the first cell-to-cell movement from an initially infected cell was 5.97ⴞ0.22 on average and 5.02ⴞ0.29 after the second cell-to-cell movement. These results indicate that plant RNA viruses may generally face narrow genetic bottlenecks in every cell-to-cell movement. Furthermore, our model suggests that, rather than suffering from fitness losses caused by the bottlenecks, the plant RNA viruses are utilizing the repeated genetic bottlenecks as an essential element of rapid selection of their adaptive variants in trans-acting genes or elements to respond to host shifting and changes in the growth conditions of the hosts.
Plant RNA viruses change their genomes so rapidly that variant viruses with altered biological properties are often found after prolonged growth of infected plants or after serial mechanical inoculations (26, 33). Furthermore, inoculation of less-fit artificial mutants produces revertants or pseudo-rever-tants even after short infection times (12, 14). The rapid evo-lution of plant RNA viral genomes is achieved not only by high mutation rates due to error-prone replication by the nonproof-reading viral RNA-dependent RNA polymerase (19) but also by rapid selection and strong genetic drift. Generally, narrow genetic bottlenecks facilitate the fixation and extinction of vari-ants in populations (15), and viral populations are no exception to this theory.
Plant RNA viruses are known to face many narrow genetic bottlenecks during their life cycles (23). The life cycles of most plant RNA viruses are as follows: After replicating in cells, viruses move from cell to cell through plasmodesmata, which connect the cytoplasms of adjacent cells separated by cell walls in plant tissue. Following the establishment of infection in cells and cell-to-cell movements, the viruses expand their infected regions, spreading to the veins and moving through the vascu-lar system and infecting the plant systemically. Some plant RNA viruses are transmitted through the seeds or via
mechan-ical injuries, but most are transmitted from plant to plant by biological vectors such as insects, nematodes, and fungi. Pre-vious studies have found that genetic bottlenecks occur during the transfer from lower leaves to upper leaves in systemic infections ofWheat streak mosaic virus(WSMV) (11),Tobacco
mosaic virus(TMV) (24), andCucumber mosaic virus(CMV)
(18) and during the transfer from one tiller to another tiller of WSMV (11). Vector transmissions were also shown to act as genetic bottlenecks for WSMV (11), CMV (1, 3), andPotato
virus Y (PVY) (20). With the exception of PVY, the typical
method for detecting genetic bottlenecks has been to observe the spatial separation of closely related strains or artificial synonymous mutants inoculated as mixed populations: the nar-rower the genetic bottleneck, the more frequently the spatial separation should be observed. Using this idea with mathemat-ical analyses, WSMV was estimated to infect a new tiller start-ing with four genomes (9), TMV was estimated to infect the upper leaves starting with 10 genomes (24), and CMV was estimated to infect a new plant starting with one to two parti-cles after aphid transmission (3). Studies of PVY using sets of host plant cultivars with or without resistance genes and mixed strains of viruses with or without resistance-breaking abilities also estimated the number of virus particles transmitted by an aphid vector to be 0.5 to 3.2 on average (20).
However, genetic bottlenecks in cell-to-cell movement of viruses have not been well characterized, although these oc-currences are likely (11) and have been expected to be impor-tant for understanding the life cycle and population dynamics of plant RNA viruses. The size of genetic bottlenecks in cell-to-cell movement can be referred to as “multiplicity of
infec-* Corresponding author. Mailing address: Asian Natural Environ-mental Science Center (ANESC), University of Tokyo, 1-1-1 Yayoi, Bunkyo-ku, Tokyo 113-8657, Japan. Phone and fax: 81-3-5841-8036. E-mail: [email protected].
§ Supplemental material for this article may be found at http://jvi .asm.org/.
䌤Published ahead of print on 2 December 2009.
1828
on November 8, 2019 by guest
http://jvi.asm.org/
tion (MOI) in plant tissue colonization,” and only a recent study showing that the estimated MOI of TMV is between 6 and 1 to 2 (10) indicates the occurrence and the size of genetic bottlenecks in cell-to-cell movement of a plant RNA virus. In this paper, we also show the occurrence of narrow genetic bottlenecks during cell-to-cell movement of a plant RNA virus,
Soil-borne wheat mosaic virus(SBWMV, type species of the
genusFurovirus), by observing the spatial separation of RNA2 vectors carrying different fluorescent proteins, yellow fluores-cent protein (YFP) and cyan fluoresfluores-cent protein (CFP). Both of the fluorescent proteins were expressed as fusion proteins to the N-terminal nuclear localization signal (NLS) peptide from
Simian virus 40(SV40) large T antigen, which enabled us to
observe and count the infected cells accurately using nuclear fluorescence. Numerical data were analyzed to estimate the size of bottlenecks. We also carried out a simulation to show that, due to the narrow genetic bottlenecks, rapid selection occurs even ontrans-acting elements in plant RNA virus ge-nomes, overcoming the negative effect of complementation among adaptive and defective genomes in each intracellular population. We discuss the possible roles of the bottlenecks in the life cycle and evolution mechanisms of plant RNA viruses.
MATERIALS AND METHODS
Plants.Fully expanded leaves ofChenopodium quinoawere used for inocula-tion after growth at 22°C for 4 to 6 weeks after sowing. Wheat (cv. Fukuho) leaves were used for inoculation after growth at 17°C for 2 weeks after sowing.
C. quinoais a local lesion host ofSoil-borne wheat mosaic virus(SBWMV) used in this study, and wheat is a natural systemic host of SBWMV.
Viral cDNA constructs.Infectious cDNA constructs for a Japanese Tochigi strain of SBWMV (SBWMV-JT), pJS1 for RNA1 and pJS2 for RNA2, were described by Yamamiya and Shirako (35). pJS2 was used as a parental vector construct for fluorescent protein gene expression. The N-CP-RT region was replaced with fluorescent protein gene sequences. YFP-coding cDNA was pre-pared by introducing variations in SYFP2 (17) into a SuperGlo GFP (sgGFP) gene sequence derived from pQBI25 (TaKaRa BIO, Japan). CFP-coding cDNA was prepared by introducing variations in SCFP3A (17) into the sgGFP gene
sequence. The NLS coding sequence fromSimian virus 40(SV40) large T antigen
and the franking sequence (translated into MDKAELIPEPPKKKRKVEL; un-derlined sequence indicates NLS) were derived from the pGAD-c1 vector (13) and added upstream of each fluorescent protein coding sequence. The resulting cDNA constructs were named pJS2.NLS-YFP.p19 and pJS2.NLS-CFP.p19.
In vitro transcription and inoculation.In vitro transcription of pJS1- and pJS2-derived constructs were done in the presence of a cap analog using SP6 RNA polymerase (TaKaRa BIO). For reverse transcriptase PCR (RT-PCR) analysis, template DNA was digested with DNase (Promega) prior to inocula-tion. Transcripts were quantified by a Qubit fluorometer (Invitrogen) and added to inoculation buffer (0.1 M NaCl, 0.1 M Tris-HCl pH 8.5) at the concentrations
of 7.5 ng/l of RNA1 and 5.0 ng/l of RNA2s unless otherwise noted and were
rubbed onto the surface of assay plant leaves using carborundum as an abrasive. Inoculated plants or leaves were rinsed with water and placed in the dark at 17°C.
Fluorescent light microscopy observations.YFP and CFP fluorescence was observed using a fluorescent light microscope (Olympus IX70 and IX-FLA, Japan) with NIBA and U-MCFPHQ filter sets (Olympus), respectively. The images were captured using a charge-coupled-device (CCD) camera (KEY-ENCE VB-7010, Japan). Photoshop Element Ver 4.0 (Adobe) was used for converting the color of CFP fluorescence images into magenta and merging with YFP fluorescence images.
Total RNA extraction, RT-PCR, and cloning.Total RNA was extracted using QuickGene 800 (FUJIFILM) after grinding of the frozen leaf samples by a Mixer Mill MM300 (Qiagen). SBWMV RNA2 in total RNA or RNA2 transcripts were amplified by a PrimeScript One Step RT-PCR kit (TaKaRa BIO) using two sets
of primers: TP292 (5⬘-AACGTGCGACGTTGAGA-3⬘) and TP41 (5⬘-CTGCT
GTGTAATAGCAG-3⬘) for amplifying almost the entire RNA2 transcript;
TP292 and TP290 (5⬘-CACTGTGACGATACTTA-3⬘) for amplifying the YFP
or CFP coding region (see Fig. 3A). DNA fragments amplified using TP292 and TP290 were cloned into a pGEM-T TA-cloning vector (Promega) for se-quencing.
Nucleotide sequence accession numbers. The nucleotide sequences for pJS2.NLS-YFP.p19 and pJS2.NLS-CFP.p19 are available from the DNA Data Bank of Japan (DDBJ) (accession numbers AB499725 and AB499726, respec-tively).
RESULTS
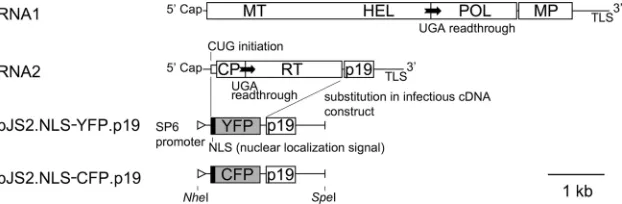
Observation of spatial separation between SBWMV vectors carrying different fluorescent proteins. Soil-borne wheat mo-saic virus(SBWMV), a positive-strand plant RNA virus, has a bipartite genome consisting of two RNA molecules, RNA1 and RNA2 (27, 28). RNA1 encodes replication proteins and a movement protein (MP) for cell-to-cell movement (2). RNA2 encodes the capsid protein (CP) and two CP-containing pro-teins: CP-RT, produced by readthrough of a stop codon, and N-CP, initiated from an upstream CUG codon (25). RNA2 also encodes a cysteine-rich protein, p19, with RNA silencing suppressor activity (29). As CP and the two CP-containing proteins are not required for replication or cell-to-cell move-ment (35; M. Miyanishi and Y. Shirako, unpublished data), we replaced their open reading frames (ORFs) in the infectious cDNA clone of RNA2 (pJS2) with YFP or CFP sequences fused to N-terminal NLS sequences to prepare virus vectors for YFP or CFP expression (Fig. 1). The YFP and CFP genes used in this study differ by 10 nucleotides, resulting in six differing amino acids. Transcripts from these cDNA clones, named RNA2.NLS-YFP.p19 and RNA2.NLS-CFP.p19, were mixed with the wild-type RNA1 transcripts and inoculated onto
Che-nopodium quinoa leaves. Leaves were placed in the dark at
17°C and observed under a fluorescent microscope at
appro-FIG. 1. Genome structure of SBWMV and cDNA constructs for fluorescent protein vector RNA2s used in this study. ORFs are indicated by rectangles. MT, methyltransferase domain of replicase; HEL, helicase domain of replicase; POL, RNA polymerase domain of replicase; MP, cell-to-cell movement protein; TLS, tRNA-like structure; CP, capsid protein; RT, readthrough region translated by readthrough of UGA stop codon for CP; p19, 19-kDa protein with RNA silencing suppressor activity.
on November 8, 2019 by guest
http://jvi.asm.org/
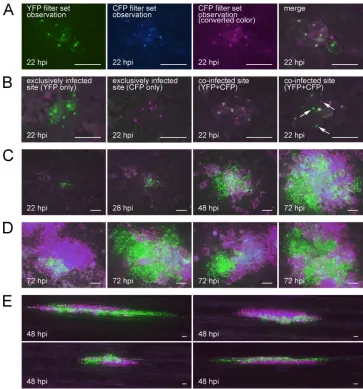
[image:2.585.137.448.69.171.2]priate time points. YFP and CFP fluorescence images were taken separately and merged after the color of CFP fluores-cence images was converted to magenta (an example of prep-aration of merged images is shown in Fig. 2A). YFP and CFP proteins were confirmed to mature at similar time points by inoculating barley protoplasts with the transcripts (data not shown). Inoculation without RNA1 or inoculation of template DNA did not show any fluorescence, indicating that fluores-cent protein expression requires replication of RNA2 by an RNA1-encoded viral replicase (data not shown).
At 22 hours post inoculation (hpi), most of the infected sites already consisted of several infected cells. Although some of the infected sites showed only YFP or CFP fluorescence (Fig. 2B, first and second panels; Table 1), most of the infected sites showed both YFP and CFP fluorescence (Fig. 2B, third and fourth panels; Table 1), indicating that coinfection of initial
[image:3.585.109.472.67.456.2]cells with both the YFP.p19 and RNA2.NLS-CFP.p19 vector viruses occurred frequently. Increasing the concentration of RNA transcripts used for inoculation did not change the number of infected sites or the frequency of coin-fection (Table 2). This result indicates that the concentration of inoculated RNA was high enough to saturate all the possible infection sites. Within coinfected sites, most of the cells showed coinfection, but some of the cells showed exclusive infection by YFP or CFP vector virus (Fig. 2B; exclusively infected cells can be found in the fourth panel and are indi-cated by white arrows). This spatial separation between YFP and CFP vector viruses progressed corresponding to the ex-pansion of the infected regions (Fig. 2C), and at 72 hpi, most of the infected sites showed absolute separation of the YFP and CFP vector in newly infected frontier cells by 7 to 9 cell-to-cell movements (Fig. 2D). The occurrence of spatial
FIG. 2. Observation of the spatial separation between SBWMV vectors carrying different fluorescent proteins in local lesion hostC. quinoa (rows A to D) and natural host wheat (row E) leaves. (A) An example of preparation of a merged image. The YFP image (first panel) and CFP image (second panel) were taken separately, and the CFP image was converted to magenta (third panel). Then, the YFP image and converted CFP image were merged (fourth panel). Rows B to D show merged images. (B) Infected sites at 22 hpi. The first and second panels show sites exclusively infected by the YFP vector and CFP vector, respectively. The third and fourth panels show coinfected sites, and the white arrows in the fourth panel indicate the cells showing exclusive infection by one of the two vectors. (C) Time course observation of a coinfected site at 22, 28, 48, and 72 hpi. (D) Coinfected sites at 72 hpi. (E) Coinfected sites in wheat at 48 hpi. All the bars represent 100m.
on November 8, 2019 by guest
http://jvi.asm.org/
separation was also observed when wheat leaves were used as a host (Fig. 2E).
Mutation frequency of the fluorescent protein genes.In or-der to check whether mutation causes loss of fluorescence in the above experiments, we carried out RT-PCR of RNA2 vectors. When total RNA samples extracted fromC. quinoa
leaves inoculated with RNA1 and RNA2.NLS-YFP.p19 at 28, 48, or 72 hpi were subjected to RT-PCR, neither the primer set for almost entire RNA2 vector (TP292 and TP41) nor that for fluorescent protein coding regions (TP292 and TP290) (Fig. 3A) detected a distinct amount of cDNA products shorter than the correct size (Fig. 3B), indicating that deletion mutation is not a frequent event. TA cloning and sequencing of the RT-PCR product of the 72-hpi total RNA sample using the latter primer set (TP292 and TP290) showed that, out of 23 clones, two clones had deletion mutations and eight clones had point mutations (i.e., nucleotide substitutions and single-nucleotide insertions) in the fluorescent protein coding region (Table 3). However, the frequency of point mutation was not higher than that found in the control experiments cloning the RT-PCR product of the inoculated RNA transcript or the PCR product of template DNA used for transcription (Table 3). These re-sults indicated that the point mutations detected occurred mainly in the PCR process, but deletion mutations occurred during virus infection and caused loss of fluorescence, although the frequency of deletion mutations is less than 10% until 72 hpi. We also tested the possibility of recombination during infection, but no recombination between YFP and CFP vectors was observed in 21 clones sequenced after cloning of the
RT-PCR products of total RNA samples isolated from coinocu-lated leaves collected at 72 hpi (data not shown).
[image:4.585.43.541.82.170.2]Numerical analysis of spatial separation of the two fluores-cent protein vectors.Because an NLS was added to the fluo-rescent proteins, we could observe the strong nuclear fluores-cence and carry out numerical analysis of the infected cells accurately using infectedC. quinoaleaf samples. To describe the spatial separation of the two fluorescent protein vectors corresponding to the development of the infected regions, we defined three classes of the cells by their distance from the initially infected cells: initially infected cells (Cell-0), adjacent cells (Cell-1), and following cells (Cell-2) (Fig. 4A). However, as it is difficult to tell which cell is Cell-0, Cell-1, or Cell-2 in actual observations, raw data were first collected as mixtures of two or three classes of cells, and after the data from each infected
TABLE 1. Number of infected sites and cells coinfected or exclusively infected by one of the virus vectors
Site/class of cells observed or
calculated Cells
Type of fluorescence observed
YFP only YFP⫹CFP CFP only
Infected sites at 22 hpi 14 179 10
Cell-0⫹Cell-1 (22 hpi) Total no. of cellsa 77 945 82
Cell-0⫹Cell-1⫹Cell-2 (28 hpi) 198 1163 232
Cell-0 No. (%) of cells per classb 0 (0.0%) 158 (100.0%) 0 (0.0%)
Cell-1 77 (8.1%) 787 (83.2%) 82 (8.7%)
Cell-2 140.2 (17.1%) 504.6 (61.6%) 174.2 (21.3%)
a
Total number of cells with coinfection or exclusive infection in coinfected sites. Data for Cell-0⫹Cell-1 were collected from 158 sites with 5 to 9 infected cells at
22 hpi. Data for Cell-0⫹Cell-1⫹Cell-2 were collected from 86 coinfected sites with 10 to 30 infected cells at 28 hpi.
b
[image:4.585.315.524.423.613.2]Number and percentage of cells with coinfection or exclusive infection in coinfected sites. Numbers for Cell-1 and Cell-2 were obtained by simple calculation as described in the text.
TABLE 2. Number of infected sites and frequency of coinfection in decreased or increased concentrations of inoculated
RNA transcriptsd
Concn of transcripts
(ng/l)e No. of infected
sites per cm2 Coinfection frequency
(%)
3.75⫹1.25⫹1.25a 14⫾3 75⫾8
7.5⫹2.5⫹2.5b 30⫾8 85⫾5
15⫹5⫹5c 25⫾8 86⫾6
a
Decreased (0.5⫻) concentration of the RNA transcripts.
b
Usual (1⫻) concentration of the RNA transcripts.
c
Increased (2⫻) concentration of the RNA transcripts.
d
Both the number of infected sites and the coinfection frequency were
cal-culated on the basis of observations at 48 hpi. Means⫾standard deviations of
three replicated leaves are shown.
e
RNA1⫹RNA2.NLS-YFP.p19⫹RNA2.NLS-CFP.p19.
FIG. 3. RT-PCR and PCR amplifications of RNA2 vector and con-trol templates. (A) Primers used for RT-PCR and PCR amplification. (B) RT-PCR (left halves) and PCR (right halves) products of RNA or DNA templates using primer sets TP292 and TP41 (upper panel) and TP292 and TP290 (lower panel). Templates (lanes): 1, total RNA isolated at 28 hpi; 2, total RNA isolated at 48 hpi; 3, total RNA isolated at 72 hpi; 4, total RNA isolated from healthy plant; 5, inocu-lated RNA transcript; 6, template DNA used for transcription. M,
DNA/HindIII marker with 23.1, 9.4, 6.6, 4.4, 2.3, and 2.0 kbp from the top. Arrowheads indicate the expected RT-PCR or PCR product sizes, 1,854 bp (upper panel, white arrowhead) and 1,070 bp (lower panel, black arrowhead).
on November 8, 2019 by guest
http://jvi.asm.org/
[image:4.585.42.284.611.667.2]site were summed up, total cell numbers were divided into the classes by simple calculation (Table 1). Detailed calculation pro-cedures were as follows (for schematic explanation, see Fig. S1 in the supplemental material). We assumed that the number of cells classified as Cell-1 is 8 per infected site from our observation. At 22 hpi, most of the infected sites showed 5 to 9 fluorescent cells, and these 158 sites with coinfection were regarded as Cell-0⫹Cell-1. The number of Cell-0 cells equals the number of the infected sites, and all the Cell-0 cells should be coinfected cells. Thus, the infection status of Cell-1 cells was estimated by sub-tracting the number of sites (i.e., 158) from the number of YFP⫹CFP cells (i.e., 945), resulting in 77 YFP-only cells, 787 YFP⫹CFP cells, and 82 CFP-only cells. Similarly, at 28 hpi, most of the infected sites showed 10 to 30 infected cells, and these 86 sites with coinfection were regarded as Cell-0⫹Cell-1⫹Cell-2. Cell-2 infection status was estimated by subtracting the number of the sites (i.e., 86) of Cell-0 cells from the YFP⫹CFP number (i.e., 1,163) and subtracting the number of the sites⫻8 (i.e., 86⫻8⫽ 688) of Cell-1 cells from the YFP-only, YFP⫹CFP, or CFP-only numbers at the proportion calculated from the Cell-1 calculation result [i.e., (77 ⫹ 82)/2:787:(77 ⫹ 82)/2 ⫽ 0.084:0.832:0.084], respectively. Our calculation showed that starting from coin-fected Cell-0 cells, 83.2% of Cell-1 and 61.6% of Cell-2 cells continuously showed coinfection, and others showed exclusive infection by only one of the two vector viruses (Table 1).
Model and idea for estimating of the size of genetic bottle-necks. We speculated that the spatial separation occurs be-cause only limited numbers of virus vector genomes can estab-lish infection in newly infected cells, and this limitation should be working as a genetic bottleneck for the intracellular popu-lations. In order to estimate the number of founder viral ge-nomes to establish infection in adjacent cells (i.e., the size of bottlenecks), we built a model as follows. First, settlement of founder genomes was regarded as a stochastic event described by the binominal distribution between two alleles, YFP and CFP: whenkgenomes are extracted from the mixture of YFP and CFP vectors mixed at the ratio ofr:(1⫺r), occupation of extractedkgenomes by YFP vectors (i.e., exclusive infection by YFP vector) will be observed at the probability ofrk,
occupa-tion by CFP vectors (i.e., exclusive infecoccupa-tion by CFP vector) at (1⫺r)k, and mixed genomes (i.e., coinfection) at 1⫺rk⫺(1⫺r)k
(Fig. 4B). The fundamental idea was to find the most likely
value forkby comparing this expected ratio with the observed ratio of exclusive infection to coinfection using the maximum-likelihood method. Second, variations in the size of bottleneck
kwere described by the Poisson distribution, with the mean0,
1and2, respectively, for establishment of infection in Cell-0,
Cell-1, and Cell-2 cells (Fig. 4C). Third, we assumed that infection of a single cell occurs by founder genomes from an adjacent single infected cell, not from multiple cells.
Estimation of the size of genetic bottlenecks.By the above model, the overall probability of coinfected sites (i.e., coin-fected initial cells: Cell-0) [Pmix(site)] was described by two pa-rameters:r0, the ratio of YFP vector in inocula, and0, the
mean size of the bottleneck in initial cell infection, as follows:
Pmix共site兲⫽p0䡠0⫹p1䡠0⫹
冘
k0⫽2
⬁
pk0䡠
冋
1⫺r0k0⫺共1⫺r0兲k0册
⫽
冘
k0⫽1
⬁
冋
1⫺r0k0⫺共1⫺r0兲k0册
0k0 k0!
e⫺0
⫽e⫺0
冋
e0⫺1⫺共e0r0⫺1兲⫺共e0共1⫺r0兲⫺1兲册
⫽1⫹e⫺0⫺e共r0⫺1兲0⫺e⫺r00
where the probability of establishment of infection by k ge-nomes (pk) was described by Poisson distribution as pk ⫽
0k k! e
⫺0. Note thatk
0⫽1 was included in the summation in the
second line because this makes the result in the square brack-ets zero. The likelihood of the numbers of coinfected sites (i.e., 179) and exclusively infected sites (i.e., 24) by one of the two vectors was described by the binomial distribution
L0⫽203C179䡠Pmix共site兲179共1⫺P
mix共site兲兲24
[image:5.585.312.527.224.342.2]The likelihood of coinfection of adjacent cells (Cell-1 cells) is a little more complicated, because infection of Cell-1 cells is affected by the proportion of YFP and CFP vectors in each
FIG. 4. Fundamental ideas and definitions in this work. (A) Sche-matic representation of classification of cells by distance from initially infected cell. (B) Settlement of founder genomes was regarded as stochastic event described by a binominal distribution between two alleles, YFP and CFP. (C) Average numbers of genomes to establish infection in Cell-0, Cell-1, and Cell-2 were defined as0,1, and2,
respectively. TABLE 3. Mutations detected after cloning of RT-PCR or PCR
product of infecting RNA2 vector and control templates
RT-PCR or PCR template
No. of clones with result/total no. of clones
Frequency of point
mutationd
Without nucleotide
change
Without amino acid
change With deletion mutation
With point
mutation(s)c
Total RNA at
72 hpia
14/23 16/23 2/23 7/23 (5/23) 8/16,422
Inoculated RNA
transcripta 14/22 17/22 0/22 8/22 (5/22) 11/15,708
Template cDNA used for
transcriptionb
10/24 14/24 0/24 14/24 (10/24) 24/17,136
aRT-PCR product of total RNA at 72 hpi or inoculated RNA transcript.
bPCR product of template DNA used for transcription.
cNumbers of clones with nucleotide substitution(s) or single-nucleotide
inser-tion(s) are shown. Numbers in parentheses show clones with amino acid changes.
dNumber of total point mutations/total number of sequenced nucleotides.
on November 8, 2019 by guest
http://jvi.asm.org/
[image:5.585.317.523.521.660.2]Cell-0 [i.e.,r1: (1⫺r1)]. Defining the number of founder YFP vectors that established infections in Cell-0 asl0and the mean
size of the bottleneck for adjacent cell infection as1, and assum-ing that final proportion of YFP and CFP vectors in Cell-0 follows the initial ratio of founder YFP and CFP vector [i.e.,r1: (1⫺r1)⫽
l0: (k0⫺l0)], the overall probability of coinfection of Cell-1
[Pmix(Cell-1)] in coinfected sites was described as follows:
Pmix共Cell⫺1兲⫽
冘
k0⫽1⬁
冘
l0⫽1
k0⫺1
冘
k1⫽1
⬁
pk0l0
共1兲 䡠
冋
1⫺r1k1⫺共1⫺r1兲k1
册
䡠1k1 k1!
e⫺1
⫽
冘
k0⫽1
⬁
冘
l0⫽0
k0
冘
k1⫽1
⬁
pk0l0
共1兲 䡠
冋
1⫺冉
l0 k0冊
k1
⫺
冉
1⫺l0k0
冊
k1
册
䡠1k1 k1!e⫺1
⫽
冘
k0⫽1
⬁
冘
l0⫽0
k0 pk0l0
共1兲䡠e⫺1
冋
e1⫺1⫺冉
e1l0
k0⫺1
冊
⫺
冉
e1冉
1⫺l0
k0
冊
⫺1冊册
wherepk共10兲l0 ⫽ 1
Pmix共site兲䡠
0k0 k0!
e⫺0䡠
k0Cl0䡠r0
l0共1⫺ r
0兲k0⫺l0. Noting the
binomial formula, it was further simplified as
Pmix共Cell⫺1兲⫽
冘
k0⫽1⬁
1
Pmix共site兲䡠
0k0 k0!e⫺
0䡠e⫺1
冋
e1⫹1⫺
冉
r0e1
k0⫹1⫺r0
冊
k0
⫺
冉
r0⫹e1
k0共1⫺r0兲
冊
k0
册
⫽
冘
k0⫽1
⬁
1
Pmix共site兲䡠
0k0 k0!
e⫺0䡠
冋
1⫹e⫺1⫺
冉
r0⫹e⫺1
k0共1⫺r0兲
冊
k0
⫺
冉
r0e⫺1
k0⫹1⫺r0
冊
k0
册
The likelihood of the estimated number of coinfected Cell-1 cells (i.e., 787) and the estimated number of exclusively in-fected Cell-1 cells by one of the two vectors (i.e., 159) was described as
L1⫽946C787䡠Pmix共Cell⫺1兲787共1⫺Pmix共Cell⫺1兲兲159.
Similarly, defining the mean size of the bottleneck for follow-ing-cell infection as2, the overall probability of coinfection of the following cells (i.e., Cell-2) in coinfected sites [Pmix(Cell-2)]
was described as follows:
Pmix共Cell⫺2兲⫽
冘
k1⫽1⬁
冘
l1⫽0
k1 pk1l1
共2兲 䡠e⫺2
冋
e2⫺1⫺冉
e2l1
k1⫺1
冊
⫺
冉
e2冉
1⫺l1
k1
冊
⫺1冊册
where
pk1l1
共2兲 ⫽ 1
Pmix共site兲䡠
冘
k0⫽1
⬁
冘
l0⫽1
k0⫺1
0k0 k0!
e⫺0䡠
k0Cl0
䡠r0l0共1⫺r0兲k0⫺l0䡠
1
k1
k1! e⫺1䡠
k1Cl1䡠r1
l1共1⫺r 1兲k1⫺l1
⫽P 1 mix共site兲䡠k
冘
0⫽1
⬁
冘
l0⫽0
k0
0k0 k0!
e⫺0䡠
k0Cl0
䡠r0l0共1⫺r0兲k0⫺l0䡠
1
k1
k1! e⫺1䡠
k1Cl1䡠
冉
l0 k0冊
l1
冉
1⫺l0k0
冊
k1⫺l1
Using the binomial formula,Pmix(Cell-2)was reduced to
Pmix共Cell⫺2兲⫽
1
Pmix共site兲䡠
冘
k1⫽1
⬁
1
k1
k1!
e⫺1䡠
冘
k0⫽1
⬁
0k0 k0!
e⫺0䡠
冘
l0⫽0
k0
k0Cl0
䡠r0l0共1⫺r0兲k0⫺l0
冋
1⫹e⫺2⫺冉
l0 k0⫹e⫺ 2
k1
冉
1⫺ l0 k0冊冊
k1
⫺
冉
l0 k0e⫺ 2
k1⫹1⫺ l0 k0
冊
k1
册
and the likelihood was described as
L2⫽819C505䡠Pmix共Cell⫺2兲505共1⫺P
mix共Cell⫺2兲兲314
based on the estimated number of coinfected Cell-2 cells and the estimated number of Cell-2 cells exclusively infected by one of the two vectors.
Then, substituting 0.5 forr0, we simultaneously estimated0,
1, and2by maximizing the total log likelihood
logL⫽logL0⫹logL1⫹logL2
Calculation was done using statistical computing software R (22), and we obtained the mean bottleneck sizes0⫽5.59⫾ 0.40, 1 ⫽ 5.97 ⫾ 0.22, and 2 ⫽ 5.02 ⫾ 0.29 (maximum likelihood estimates⫾standard errors).
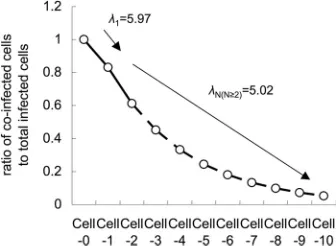
These results indicate that only around 5 to 6 founder ge-nomes establish infection in adjacent cells after cell-to-cell movement. The expected size of bottlenecks for the second cell-to-cell movement (2) was slightly smaller than that for first cell-to-cell movement (1).
Evaluation of the model and the estimated bottleneck sizes by comparing simulation and observation results.The esti-mated bottleneck sizes were used to simulate the decrease in coinfected cells corresponding to the development of infected regions. Assuming that the mean number of viral genomes that establish infection in Cell-N (N, Nⱖ3) equals2, the overall probability of coinfected cells in Cell-N [Pmix(Cell-N), Nⱖ3] in coinfected sites was simulated by recurrence relation as follows:
Pmix共Cell⫺N兲⫽
冘
kN⫺1⫽1
⬁
冘
lN⫺1⫽0
kN⫺1
pk共N兲N⫺1lN⫺1䡠e⫺2
冋
e2⫺1⫺冉
e2lN⫺1
kN⫺1⫺1
冊
⫺
冉
e2冉
1⫺klN⫺1N⫺1
冊
⫺1冊册
where
on November 8, 2019 by guest
http://jvi.asm.org/
pk共N兲N⫺1lN⫺1⫽
冘
kN⫺2⫽1
⬁
冘
lN⫺2⫽0
kN⫺2
pk共N⫺N⫺21lN兲⫺2䡠 2
kN⫺1 kN⫺1!
e⫺2䡠
kN⫺1ClN⫺1䡠
冉
lN⫺2 kN⫺2冊
lN⫺1
䡠
冉
1⫺ lN⫺2kN⫺2
冊
kN⫺1⫺lN⫺1
and
pk1l1
共2兲 ⫽ 1
Pmix共site兲䡠
冘
k0⫽1
⬁
冘
l0⫽0
k0
0k0 k0!
e⫺0䡠
k0Cl0
䡠r0l0共1⫺r0兲k0⫺l0䡠
1
k1
k1! e⫺1䡠
k1Cl1䡠
冉
l0 k0冊
l1
冉
1⫺l0k0
冊
k1⫺l1
wherePmix(site)⫽179/203,r0⫽0.5,0⫽5.59,1⫽5.97, and
2⫽5.02. The simulation result showed that fewer than 10%
of coinfected cells would be observed in Cell-8 cells (Fig. 5). This simulation result is consistent with our actual observations at 72 hpi, when most of the infected sites show absolute spatial separation by 7 to 9 cell-to-cell movements (Fig. 2D), indicat-ing that our model and the estimated sizes of the bottlenecks are reliable.
Simulation of enhanced selection ontrans-acting elements caused by narrow genetic bottlenecks.As we observed, rapid spatial separation occurs between two artificial vector genomes during the development of locally infected regions by a plant virus. This phenomenon can be explained by the idea that rapid fixation of an allele occurs in bottlenecked populations (15). We extended this idea to model the rapid selection of
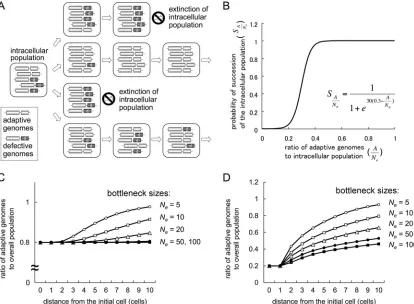
trans-acting genes or elements in plant RNA viral genomes. Some of the sources of genetic information in RNA viral genomes, such as 5⬘and 3⬘untranslated regions (UTRs), work incisto the viral genomes, while others, such as MP and p19 of SBWMV expressed from subgenomic RNAs, work intrans. Thesetrans-acting elements or gene products should be shared among intracellular populations of viral genomes. Thus, the selection of trans-acting genes or elements should be slow compared to the selection ofcis-acting genes or elements be-cause of complementation by adaptive genomes for defective ones in intracellular populations. We speculated that narrow genetic bottlenecks would solve this problem by stochastically isolating adaptive genomes from defective genomes, allowing
adaptive genomes to benefit exclusively from the mutations in their genomes (Fig. 6A). Therefore, we investigated how bot-tleneck sizes affect the speed of selection ontrans-acting genes or elements by modeling the competition between intracellular populations, among which narrow bottlenecks create variety in the ratios of adaptive genomes to defective genomes.
Competition between intracellular populations was modeled by different probabilities of establishment of infection in adja-cent cells: the probabilities of succession of intracellular pop-ulations (S).Swas described by logistic curve with respect to the proportion of adaptive genomes in the intracellular popu-lation
冉
ANe
冊
SA Ne⫽
1 1⫹ec
冉
a0⫺A Ne
冊
HereNe(effective population number) is the size of the bot-tleneck (i.e., the number of viral genomes that establish infec-tion, MOI) andAis the number of adaptive genomes in total
Ne genomes. We assumed a0 ⫽ 0.3 and c ⫽ 30; a0 and c
determine the inflection point and inclination of the logistic curve, respectively. We used a0 ⫽ 0.3 because an SBWMV RNA2 mutant with⬃30% transcription efficiency of p19 sub-genomic RNA compared to that of wild-type virus could infect plants but showed irregular formed lesions (34), indicating that the virus can infect some cells but not others. With these parameter values, the succession probability of intracellular probability is very low if the frequency of the adaptive genome is below 0.2, while it is close to 1 if the frequency is over 0.4 (Fig. 6B).
The ratio of cells infected byAadaptive genome andNe⫺A
defective genomes in Cell-N共r共Cell⫺N兲NeAN兲was described as
fol-lows:
r共Cell⫺N兲N
eAN⫽
冘
AN⫺1⫽0
Ne
SAN⫺1
Ne 䡠
r共Cell⫺N⫺1兲NeAN⫺1䡠NeCAN⫺1
䡠
冉
AN⫺1 Ne冊
AN
冉
1⫺AN⫺1Ne
冊
Ne⫺AN冘
AN⫺1⫽0
Ne
SAN⫺1
Ne 䡠
r共Cell⫺N⫺1兲NeAN⫺1
.
Assuming that there are abundant cells to receive intracellular populations, the ratio of adaptive genomes to the total popu-lation of Cell-N cells共R共Cell⫺N兲Ne兲was described as follows:
R共Cell⫺N兲Ne⫽
冘
AN⫽0
Ne
AN
Ne䡠
r共Cell⫺N兲NeAN
Using the above model, exclusion of defective mutant ge-nomes was tested. Starting from a mixed virus population with 80% adaptive genomes and 20% defective genomes (i.e., r共Cell⫺1兲NeA1 ⫽ 0.8), rapid exclusion of the defective
[image:7.585.79.247.70.193.2]ge-nome was observed for smallerNevalues (e.g., 5 or 10), while almost no change was observed for largerNevalues (e.g., 50 or 100) in 10 cell-to-cell movements (Fig. 6C). Similarly, selection of an adaptive mutation was tested. Starting from a mixed virus population with 20% adaptive genomes and 80% defective
FIG. 5. Simulation of the decrease of coinfected cells correspond-ing to the development of locally infected regions. The dashed line represents simulated results, while the solid line represents observed results.
on November 8, 2019 by guest
http://jvi.asm.org/
genomes (i.e.,r共Cell⫺1兲NeA1⫽0.2), rapid occupation by the
adap-tive genome was observed for smallerNevalues (e.g., 5 or 10), while a slower change was observed for largerNevalues (e.g.,
50 or 100) (Fig. 6D). On the other hand, a similar simulation modeling selection of cis-acting elements between adaptive genomes and less-adaptive genomes with 1:0.5 replication ef-ficiencies showed that selection would rapidly occur almost independently of the size of bottlenecks (data not shown). We also confirmed that the simulation results are not largely af-fected by changinga0andc(data not shown).
DISCUSSION
By observing the spatial separation of virus vectors carrying two different fluorescent proteins, we have shown that narrow genetic bottlenecks occur during cell-to-cell movement of a plant RNA virus in the leaves of the natural host and local lesion host. The estimated size of bottlenecks was surprisingly small, with averages of 5.97⫾0.22 for first cell-to-cell move-ment and 5.02⫾0.29 for second cell-to-cell movement. The underestimation effect of deletion mutations in fluorescent protein coding regions should be around 3 to 4% at the time points we carried out estimations (i.e., 22 and 28 hpi), because
[image:8.585.84.498.69.373.2]only fewer than 10% of deletion mutants were observed at 72 hpi. The estimated sizes of the bottlenecks are similar to those in the recent report by Gonzalez-Jara et al. (10), which showed that the MOI in plant tissue colonization (i.e., the size of bottlenecks) decreases from 6 to 1 to 2, corresponding to the expansion of the TMV-infected regions. The similarity of their and our estimated sizes indicates that narrow genetic bottle-necks in cell-to-cell movements are generally occurring with plant RNA viruses that infect mesophyll cells. However, we consider it difficult to say that decreases in the size of bottle-necks are generally occurring phenomena, because the estima-tions are affected by how we model the plant tissues. For example, we carried out our estimation assuming that the num-ber of Cell-1 cells per an infected Cell-0 cell is eight and obtained1⫽5.97⫾0.22 and2⫽5.02⫾0.29; however, if we assumed the number is six or seven, we would obtain 1 ⫽ 5.86⫾0.29 and2⫽5.72⫾0.38 or1⫽6.02⫾0.25 and2⫽ 5.19 ⫾ 0.30, respectively, indicating that there are negative relationships between the estimated sizes of the latter bottle-neck and the assumed ratios of newly infected cells to source cells. Gonzalez-Jara et al. (10) carried out their estimations assuming that the ratio is always 6.5, but according to our
FIG. 6. Idea and simulation results of effective selection ontrans-acting elements due to narrow genetic bottlenecks. (A) Schematic represen-tation of a mechanism for effective selection ontrans-acting elements. Narrow genetic bottlenecks in cell-to-cell movements stochastically isolate adaptive genomes from defective genomes, resulting in rapid selection for adaptive genomes. (B) Modeling of competition among intracellular populations by describing their probabilities of succession (S) with respect to the proportion of adaptive genomes in the intracellular population
冉
ANe
冊
. (C) Simulation of the exclusion of defective genomes with different bottleneck sizes (Ne). Note that initial ratios of adaptive and defective
genomes are 80% and 20%, respectively. (D) Simulation of the selection of adaptive genomes with different bottleneck sizes (Ne). Initial ratios of
adaptive and defective genomes are 20% and 80%, respectively.
on November 8, 2019 by guest
http://jvi.asm.org/
understanding, as this ratio will rapidly decrease to almost 1 corresponding to the expansion of the infected regions (for two models to suggest the decrease in the ratio, see Fig. S2 in the supplemental material), they may have underestimated the sizes of bottlenecks at later time points. Accumulation of deletion mutations may also cause an underestimation of the sizes of bottlenecks at later time points. On the other hand, our model may slightly overestimate the sizes of bottlenecks be-cause of the simplification that infection of a single cell occurs by founder genomes from an adjacent single infected cell. Thus, the changes in the sizes of bottlenecks during host col-onization should be discussed further, especially with more attention paid to the way to model plant tissues, accumulation of deletion mutants, and spread of virus infection.
We do not know the mechanisms of the occurrence of the bottlenecks during cell-to-cell movement. However, we specu-late that the bottleneck may not be a physical matter in cell-to-cell movement, because the number of plasmodesmata con-necting two mesophyll cells is estimated to be 26, on average, using spinach leaves (31), which belong to the same family with
C. quinoa, Chenopodiaceae, indicating that there are enough plasmodesmata for the virus to go through. Studies of replica-tion complexes of hepatitis C virus (HCV) (32) and virus-induced mini-organelles, in which viral replication occur, of Flock House virus (FHV) (16) have shown that several hun-dred replication complexes and around 11 thousand virus-induced mini-organelles are formed when the viruses infect a host cell. Comparing the estimated bottleneck sizes with these results, it is reasonable to consider that the bottleneck event (i.e., the settlement of the founder virus) occurs prior to the formation of replication complexes or virus-induced mini-or-ganelles. From this viewpoint, competition for resources re-quired for genome replication or protein expression can be also excluded from the mechanisms of the bottleneck, because the bottleneck events seem to occur before the viral replication and protein expression become vigorous. As demonstrated by previous research on WSMV bottlenecks in systemic move-ment (11), bottlenecks during cell-to-cell movemove-ment may also occur due to sequence homology, probably via an RNA silenc-ing mechanism to refuse additional infection by a virus with sequence homology. This idea can explain the fact that SBWMV does not suffer from narrow genetic bottlenecks in spite of its bipartite genome, because only a limited bottleneck effect between RNA1 and RNA2 will be expected. Further studies of the mechanisms and the timing of the occurrence of genetic bottlenecks are required.
Previous research on bacteriophage (4, 6) and animal (7, 8, 36) and plant (5) RNA viruses showed that repeated bottle-neck events, caused by transferring plaques or lesions, resulted in fitness losses for viral genomes because of the mechanism known as Muller’s ratchet (21). Our observations and estima-tions showed that intracellular populaestima-tions of a plant virus face narrow genetic bottlenecks in every cell-to-cell movement, and, following this idea, bottlenecks should cause extinction or very low mean fitness of the populations. This may be the case for the history of an intracellular population traveling from one cell to another cell. However, because there are abundant cells and spaces for local infection in a host plant to receive viral intracellular populations, stochastically adaptive genomes per-sist or appear, and survival of the viral population as a whole
will be achieved. Why have plant viruses not evolved to avoid bottlenecks? We speculate that the plant viruses are actually utilizing the bottlenecks as an essential element of their evo-lution mechanisms. In this study, we focused on viral elements working in trans to their genomes, which would not receive selection pressure as effectively ascis-acting elements because of the complementation in intracellular populations. Simulat-ing this situation by describSimulat-ing competition among intracellular populations, our model implied that narrow genetic bottle-necks during cell-to-cell movement help the selection pressure to work ontrans-acting genes or elements by rapidly isolating the adaptive genomes from defective genomes. This system may counteract the negative effect of bottlenecks (i.e., fitness losses), and, furthermore, it may enable the plant RNA virus to rapidly respond to changes such as temperature shift, condi-tion changes in different organs of a host, host shifting and so on. Interestingly, a study of 6, a lytic RNA bacteriophage, showed that repeated large population transfers with broad-ened bottlenecks result in occupation of the viral population by “selfish” genomes, each of which cannot effectively replicate by itself but can replicate well only among the intracellular pop-ulation because of complementation (30). A similar situation could occur in plant RNA virus infection of a host plant if the bottleneck sizes in cell-to-cell movement were large, resulting in ineffective plant-to-plant transmission because of the bottle-necked transmission of selfish genomes, each of which cannot replicate well by itself. Thus, roughly constant but variable bottleneck sizes in cell infection through their life cycles (i.e., cell-to-cell movement, vascular to mesophyll cell invasion, and so on) may be favored for plant RNA virus evolution.
In conclusion, we demonstrated narrow genetic bottlenecks and their estimated sizes during cell-to-cell movement of a plant virus, and we created a simple model to explain why plant RNA viruses do not suffer from the bottlenecks. We believe this work provides a new insight into survival strategies and population dynamics of plant RNA viruses.
ACKNOWLEDGMENTS
We thank Yukio Shirako (ANESC, Univ. of Tokyo) for providing us with infectious cDNA constructs for SBWMV, pJS1 and pJS2, used in this study. We also thank anonymous reviewers for critical and con-structive comments, which improved the manuscript significantly.
S.M. was supported by the Japan Society for the Promotion of Sciences (JSPS) Research Fellowships for Young Scientists (20-5665) and the Japan Science Technology Agency (JST) PRESTO program. H.K. was supported by a Grant-in-Aid for Scientific Research (B-19300094) from JSPS.
REFERENCES
1.Ali, A., H. Li, W. L. Schneider, D. J. Sherman, S. Gray, D. Smith, and M. J. Roossinck.2006. Analysis of genetic bottlenecks during horizontal
transmis-sion of cucumber mosaic virus. J. Virol.80:8345–8350.
2.An, H., U. Melcher, P. Doss, M. Payton, A. C. Guenzi, and J. Verchot-Lubicz.
2003. Evidence that the 37 kDa protein of soil-borne wheat mosaic virus is
a virus movement protein. J. Gen. Virol.84:3153–3163.
3.Betancourt, M., A. Fereres, A. Fraile, and F. Garcia-Arenal.2008. Estima-tion of the effective number of founders that initiate an infecEstima-tion after aphid
transmission of a multipartite plant virus. J. Virol.82:12416–12421.
4.Chao, L.1990. Fitness of RNA virus decreased by Muller’s ratchet. Nature
348:454–455.
5.de la Iglesia, F., and S. F. Elena.2007. Fitness declines in tobacco etch virus
upon serial bottleneck transfers. J. Virol.81:4941–4947.
6.de la Pena, M., S. F. Elena, and A. Moya. 2000. Effect of deleterious mutation-accumulation on the fitness of RNA bacteriophage MS2.
Evolu-tion54:686–691.
7.Duarte, E., D. Clarke, A. Moya, E. Domingo, and J. Holland.1992. Rapid
on November 8, 2019 by guest
http://jvi.asm.org/
fitness losses in mammalian RNA virus clones due to Muller’s ratchet. Proc.
Natl. Acad. Sci. U. S. A.89:6015–6019.
8.Escarmis, C., M. Davila, N. Charpentier, A. Bracho, A. Moya, and E. Do-mingo.1996. Genetic lesions associated with Muller’s ratchet in an RNA
virus. J. Mol. Biol.264:255–267.
9.French, R., and D. C. Stenger.2003. Evolution of wheat streak mosaic virus: dynamics of population growth within plants may explain limited variation.
Annu. Rev. Phytopathol.41:199–214.
10.Gonzalez-Jara, P., A. Fraile, T. Canto, and F. Garcia-Arenal.2009. The multiplicity of infection of a plant virus varies during colonization of its
eukaryotic host. J. Virol.83:7487–7494.
11.Hall, J. S., R. French, G. L. Hein, T. J. Morris, and D. C. Stenger.2001. Three distinct mechanisms facilitate genetic isolation of sympatric wheat
streak mosaic virus lineages. Virology282:230–236.
12.Ishikawa, M., T. Meshi, F. Motoyoshi, N. Takamatsu, and Y. Okada.1986. In vitro mutagenesis of the putative replicase genes of tobacco mosaic virus.
Nucleic Acids Res.14:8291–8305.
13.James, P., J. Halladay, and E. A. Craig.1996. Genomic libraries and a host strain designed for highly efficient two-hybrid selection in yeast. Genetics
144:1425–1436.
14.Kawakami, S., K. Hori, D. Hosokawa, Y. Okada, and Y. Watanabe.2003. Defective tobamovirus movement protein lacking wild-type phosphorylation sites can be complemented by substitutions found in revertants. J. Virol.
77:1452–1461.
15.Kimura, M., and T. Ohta.1969. The average number of generations until
fixation of a mutant gene in a finite population. Genetics61:763–771.
16.Kopek, B. G., G. Perkins, D. J. Miller, M. H. Ellisman, and P. Ahlquist.
2007. Three-dimensional analysis of a viral RNA replication complex reveals
a virus-induced mini-organelle. PLoS Biol.5:e220.
17.Kremers, G. J., J. Goedhart, E. B. van Munster, and T. W. Gadella, Jr.2006. Cyan and yellow super fluorescent proteins with improved brightness,
pro-tein folding, and FRET Forster radius. Biochemistry45:6570–6580.
18.Li, H., and M. J. Roossinck.2004. Genetic bottlenecks reduce population
variation in an experimental RNA virus population. J. Virol.78:10582–
10587.
19.Malpica, J. M., A. Fraile, I. Moreno, C. I. Obies, J. W. Drake, and F. Garcia-Arenal.2002. The rate and character of spontaneous mutation in an
RNA virus. Genetics162:1505–1511.
20.Moury, B., F. Fabre, and R. Senoussi.2007. Estimation of the number of virus particles transmitted by an insect vector. Proc. Natl. Acad. Sci. U. S. A.
104:17891–17896.
21.Muller, H. J.1964. The relation of recombination to mutational advance.
Mutat. Res.106:2–9.
22.R Development Core Team.2005. R: a language and environment for
sta-tistical computing. R Foundation for Stasta-tistical Computing, Vienna, Austria. http://www.R-project.org.
23.Roossinck, M. J., and W. L. Schneider.2006. Mutant clouds and occupation of sequence space in plant RNA viruses. Curr. Top. Microbiol. Immunol.
299:337–348.
24.Sacristan, S., J. M. Malpica, A. Fraile, and F. Garcia-Arenal.2003. Estima-tion of populaEstima-tion bottlenecks during systemic movement of tobacco mosaic
virus in tobacco plants. J. Virol.77:9906–9911.
25.Shirako, Y.1998. Non-AUG translation initiation in a plant RNA virus: a forty-amino-acid extension is added to the N terminus of the soil-borne
wheat mosaic virus capsid protein. J. Virol.72:1677–1682.
26.Shirako, Y., and M. K. Brakke.1984. Spontaneous deletion mutation of
soil-borne wheat mosaic virus RNA II. J. Gen. Virol.65:855–858.
27.Shirako, Y., and M. K. Brakke.1984. Two purified RNAs of soil-borne wheat
mosaic virus are needed for infection. J. Gen. Virol.65:119–127.
28.Shirako, Y., and T. M. Wilson.1993. Complete nucleotide sequence and organization of the bipartite RNA genome of soil-borne wheat mosaic virus.
Virology195:16–32.
29.Te, J., U. Melcher, A. Howard, and J. Verchot-Lubicz.2005. Soilborne wheat mosaic virus (SBWMV) 19K protein belongs to a class of cysteine rich
proteins that suppress RNA silencing. Virol. J.2:18.
30.Turner, P. E., and L. Chao.1998. Sex and the evolution of intrahost
com-petition in RNA virus phi6. Genetics150:523–532.
31.Warmbrodt, R. D., and W. J. VanDerWoude.1990. Leaf of Spinacia oleracea (spinach): ultrastructure, and plasmodesmatal distribution and frequency, in
relation to sieve-tube loading. Am. J. Bot.77:1361–1377.
32.Wolk, B., B. Buchele, D. Moradpour, and C. M. Rice.2008. A dynamic view
of hepatitis C virus replication complexes. J. Virol.82:10519–10531.
33.Xin, H. W., and S. W. Ding.2003. Identification and molecular character-ization of a naturally occurring RNA virus mutant defective in the initiation
of host recovery. Virology317:253–262.
34.Yamamiya, A., M. Miyanishi, and Y. Shirako.2005. Stable deletions arising in the readthrough region of soil-borne wheat mosaic virus RNA2 define the
5⬘ limit of the functional promoter for the p19 subgenomic RNA. Arch.
Virol.150:1871–1884.
35.Yamamiya, A., and Y. Shirako. 2000. Construction of full-length cDNA clones to soil-borne wheat mosaic virus RNA1 and RNA2, from which infectious RNAs are transcribed In vitro: virion formation and systemic infection without expression of the N-terminal and C-terminal extensions to
the capsid protein. Virology277:66–75.
36.Yuste, E., S. Sanchez-Palomino, C. Casado, E. Domingo, and C. Lopez-Galindez.1999. Drastic fitness loss in human immunodeficiency virus type 1
upon serial bottleneck events. J. Virol.73:2745–2751.
on November 8, 2019 by guest
http://jvi.asm.org/