City, University of London Institutional Repository
Citation: Conway, M. L., Hosking, L. S., Zhu, H. and Cubbidge, P. R. (2014). Does the
Swedish Interactive Threshold Algorithm (SITA) accurately map visual field loss attributed to vigabatrin?. BMC Ophthalmology(14), 166 - ?. doi: 10.1186/1471-2415-14-166This is the draft version of the paper.
This version of the publication may differ from the final published
version.
Permanent repository link: http://openaccess.city.ac.uk/7402/
Link to published version: http://dx.doi.org/10.1186/1471-2415-14-166
Copyright and reuse: City Research Online aims to make research
outputs of City, University of London available to a wider audience.
Copyright and Moral Rights remain with the author(s) and/or copyright
holders. URLs from City Research Online may be freely distributed and
linked to.
City Research Online: http://openaccess.city.ac.uk/ [email protected]
Does the Swedish Interactive Threshold Algorithm
(SITA) accurately map visual field loss attributed to
vigabatrin?
Miriam Conway1*
*
Corresponding author
Email: [email protected]
Sarah L Hosking2
Email: [email protected]
Haogang Zhu1
Email: [email protected]
Robert P Cubbidge3
Email: [email protected]
1
Department of Optometry and Visual Science, City University London, Northampton Square, London EC1V OHB, UK
2
Centre for Eye Research Australia, Department of Ophthalmology, University of Melbourne, 32 Gisborne Street, East Melbourne, VIC 3002, Australia
3
Optometry & Vision Sciences, School of Life & Health Sciences, Aston University, Aston Triangle, Birmingham B4 7ET, UK
Abstract
Purpose
Vigabatrin (VGB) is an anti-epileptic medication which has been linked to peripheral constriction of the visual field. Documenting the natural history associated with continued VGB exposure is important when making decisions about the risk and benefits associated with the treatment. Due to its speed the Swedish Interactive Threshold Algorithm (SITA) has become the algorithm of choice when carrying out Full Threshold automated static perimetry. SITA uses prior distributions of normal and glaucomatous visual field behaviour to estimate threshold sensitivity. As the abnormal model is based on glaucomatous behaviour this algorithm has not been validated for VGB recipients. We aim to assess the clinical utility of the SITA algorithm for accurately mapping VGB attributed field loss.
Methods
Results
SITA Standard was on average approximately twice as fast (7.6 minutes) and SITA Fast approximately 3 times as fast (4.7 minutes) as examinations completed using the Full Threshold algorithm (15.8 minutes). In the clinical environment, the visual field outcome with both SITA algorithms was equivalent to visual field examination using the Full Threshold algorithm in terms of visual inspection of the grey scale plots , defect area and defect severity.
Conclusions
Our research shows that both SITA algorithms are able to accurately map visual field loss attributed to VGB. As patients diagnosed with epilepsy are often vulnerable to fatigue, the time saving offered by SITA Fast means that this algorithm has a significant advantage for use with VGB recipients.
Keywords
Swedish interactive threshold algorithm, Vigabatrin, Visual field
Background
Vigabatrin (VGB) is the first purposely designed anti-epileptic medication. It is administered as a first line therapy to patients suffering from Infantile Spasms and as an adjunctive therapy to patients with complex partial seizures [1,2]. VGB was initially approved for use within the United Kingdom and several other European countries in 1989 however, it is now well established that VGB therapy can induce peripheral constriction of the visual field. Reports of the prevalence of this defect range between 17% [3] and 86% [4]. The risk of VGB attributed field loss appears to be lower in children less than 12 years old exposed to VGB when compared to adults and adolescents who receive VGB at a later age [5,6]. General consensus suggests that the visual field loss is permanent [7,8]. Positive relationships between the visual field loss and cumulative dosage [3,8-10] duration of vigabatrin therapy [6,8-11] and maximum daily dosage [12] have all been documented. Despite these known side effects, in the last few years VGB has become licensed in Canada, Mexico and the United States for the same uses as reported above.
Patients receiving VGB are frequently monitored using either kinetic perimetry or automated static perimetry [13]. Vigabatrin attributed visual field loss is two and a half times more common with automated static perimetry when compared to manual kinetic perimetry [14]. The authors attributed these findings to the fact that in general, static perimetry is more sensitive than kinetic perimetry for the detection of field loss [15]. Static perimetry is normally carried out using the Swedish Interactive Threshold Algorithms (SITA). These algorithms were developed with the specific aim of offering a significant reduction in examination time but without sacrificing any loss in the accuracy of threshold estimation when compared to the Full Threshold and FASTPAC algorithms [16,17].
normal threshold values, frequency-of-seeing curves, between-subject variability and inter-point correlations between thresholds [16]. The abnormal visual field model is based on a glaucomatous population and thus inter-point correlations of threshold values would be based upon the retinal nerve fibre arrangement [18]. VGB induced visual field loss however is thought to result from a toxic effect in the retina and as such may not precisely conform to the nerve fibre bundle. Consequently, SITA may map a response for VGB recipients which are artificially influenced by the glaucomatous model.
To date, the only study to have examined whether SITA was valid in patients with non-glaucomatous pathologies, such as optic neuropathies and hemianopias, reported that SITA Standard was at least as good as Full Threshold for the detection of visual loss in individual examinations [19]. For VGB recipients it is essential that we accurately document the natural progression associated with continued VGB exposure. This information is vital when making decisions on management as it allows the patient and practitioner an opportunity to weigh up the risks and benefits associated with continued treatment.
The aim of this investigation was to assess the clinical utility of the SITA algorithms for the investigation of patients receiving VGB. Firstly, by determining the threshold agreement between the different algorithms. Secondly, by determining the threshold agreement within the same algorithm across two successive visits. Thirdly, the agreement of the diagnostic outcome was assessed in terms of area and depth of defect.
Methods
Twenty-Two participants: 12 females and 10 males (mean age 38.54 years, SD 13.45, range 16 to 61 years) who were undergoing or who had previously undergone treatment with VGB were invited to take part in the study. Four participants were removed from the study as they had a visual field defect not attributed to VGB another two participants were removed because of poor reliability. The sample therefore consisted of 16 epilepsy patients; 10 females and 6 males (mean age 39.3, SD 14.52, range 18 to 61). Patients were recruited from National Health Service hospitals in the United Kingdom and written informed consent was obtained from each participant prior to commencement of the study. Approval for the study was given by the Aston University Human Sciences Ethical Committee and adhered to the tenets of the Declaration of Helsinki.
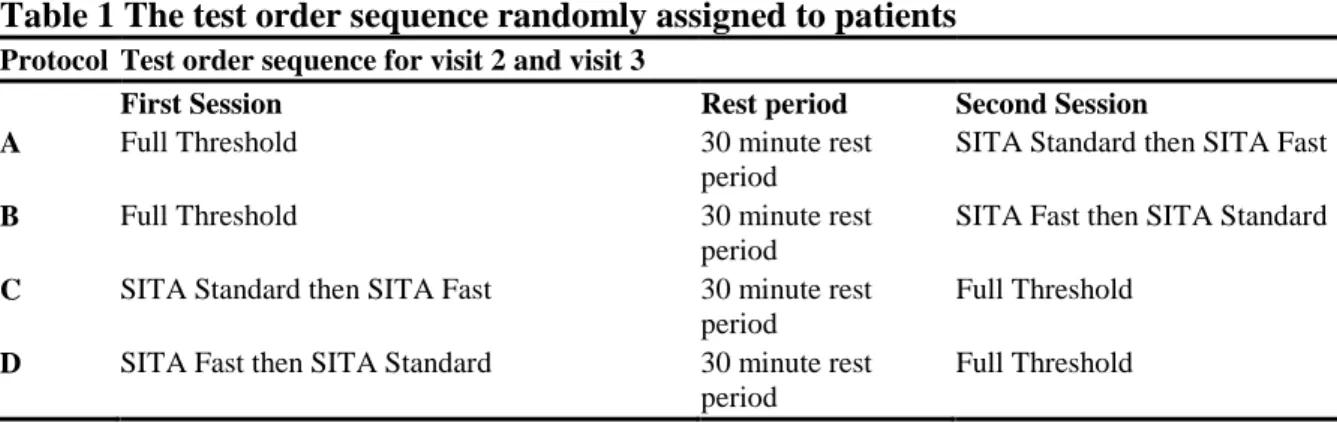
Table 1 The test order sequence randomly assigned to patients
Protocol Test order sequence for visit 2 and visit 3
First Session Rest period Second Session
A Full Threshold 30 minute rest period
SITA Standard then SITA Fast
B Full Threshold 30 minute rest period
SITA Fast then SITA Standard
C SITA Standard then SITA Fast 30 minute rest period
Full Threshold
D SITA Fast then SITA Standard 30 minute rest period
Full Threshold
Visual fields obtained from the left eye were changed to the right eye format and the stimulus locations immediately above and below the blind spot were removed from the analysis which was twofold. Firstly, threshold data was evaluated in terms of threshold agreement between algorithms (during visit 3) and threshold agreement within algorithm (between visit 2 and 3). The second analysis was in terms of the clinical status of the visual field both within and between threshold algorithms.
Results
Table 2 The epileptic medications of the patient group concomitant with vigabatrin and the seizure history
Patient number
Seizure history Carbamazepine Sodium Valporate
Clobazam Levetiracetam Topiramate Lamotrogine Phenytoin Gabapentin Other
1 Unknown X X
2 generalised X X X X X X
3 Complex partial partial/secondary generalised
X X
4 Complex partial
5 Simple/complex X X
6 Complex partial X X
7 Complex partial X X
8 Unknown X X
9 Generalised X
10 Complex partial X X
11 Complex partial X X
12 Unknown X
13 Generalised X X X X X
14 Complex partial partial/secondary generalised
X
15 Unknown X X X
16 Complex partial partial/secondary generalised
Threshold agreement between and within algorithms
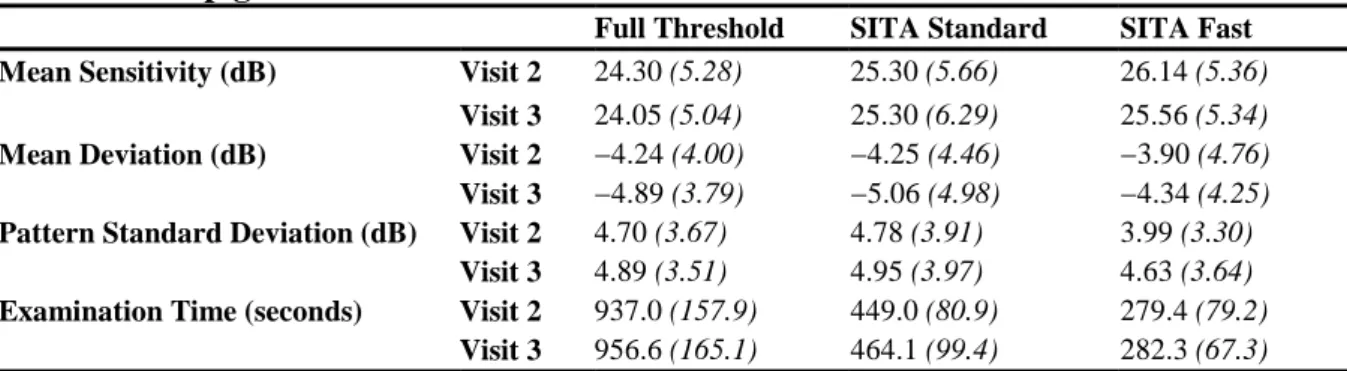
One-way analysis of variance (between-subject) was used to determine whether there was any significant difference between examination duration, mean sensitivity (MS) mean deviation (MD) and pattern standard deviation (PSD), in any of the three algorithms resulting from the various sequence options of perimetric examination. There was no significant difference between protocol and visual field index at the third visit indicating that the unconventional order protocol did not influence threshold sensitivities. The group mean values for MS, MD, PSD and test duration (±1 SD) for each algorithm at the second and third visits are illustrated in Table 3.
Table 3 Group global indices and examination times
Full Threshold SITA Standard SITA Fast Mean Sensitivity (dB) Visit 2 24.30 (5.28) 25.30 (5.66) 26.14 (5.36)
Visit 3 24.05 (5.04) 25.30 (6.29) 25.56 (5.34) Mean Deviation (dB) Visit 2 −4.24 (4.00) −4.25 (4.46) −3.90 (4.76) Visit 3 −4.89 (3.79) −5.06 (4.98) −4.34 (4.25) Pattern Standard Deviation (dB) Visit 2 4.70 (3.67) 4.78 (3.91) 3.99 (3.30)
Visit 3 4.89 (3.51) 4.95 (3.97) 4.63 (3.64) Examination Time (seconds) Visit 2 937.0 (157.9) 449.0 (80.9) 279.4 (79.2)
Visit 3 956.6 (165.1) 464.1 (99.4) 282.3 (67.3)
For MD and PSD, there was no difference between algorithms or visit order. The mean sensitivity of SITA Standard was 1.25 dB higher and 1.51 dB higher for the SITA Fast algorithm at the final visit compared to the Full Threshold algorithm SITA Standard (7 .6 minutes) and SITA Fast (4.7 minutes) were significantly faster than Full Threshold perimetry (15.8 minutes).
The threshold agreement within each algorithm across 2 successive visits was assessed by calculating the root mean square error (RMSE) for all test locations, participants and algorithms. The visual field was sectorised into outer, middle and inner zones of eccentricity; the outer zone comprised of 24 points from 25.8 to 28.5 degrees from fixation, the middle zone comprised 20 stimulus locations from 21.2 to 22.8 degrees from fixation and the inner zone comprised of 30 stimulus locations from 4.2 to 17.5 degrees from fixation (Figure 1). Figure 2 shows the 95% confidence intervals for the RMSE as a function of threshold algorithm for the whole field and the outer, middle and inner visual field regions. Within algorithm threshold variability was lowest in the inner ring for all threshold algorithms. As sectors increase in eccentricity from fixation, the group mean RMSE increased indicating less threshold agreement within an algorithm across visits 2 and 3. Both SITA algorithms had less threshold agreement (group mean RMSE) and larger confidence intervals across all visual field regions when compared to Full Threshold (Figure 2). Within the outer field region the RMSE with SITA Fast was 27% higher than Full Threshold and SITA Standard was 19% higher than Full Threshold (p =0.017). Similar differences were found across all field regions.
Figure 1 Illustration of outer (black), middle (grey) and inner (white) sectors (blind spot dashed lines).
Clinical status of the visual field
All visual fields were categorised using the classification defined by Wild et al (2009) [22]. Visual defects ranged from mild to severe (Table 4) based on the number and position of stimulus locations exhibiting an abnormality at either p < 0.01 or p < 0.005 out to 30 degrees eccentricity for static threshold perimetry and were present in 38% after Full threshold was assigned the gold standard for the detection of VGB attributed visual field loss. The false positive and false negative rate was then calculated for both SITA algorithms. False positive rate was defined as the proportion of persons falsely identified as diseased persons by SITA Standard or SITA Fast in those without any VGB attributed field loss identified by the gold standard Full Threshold algorithm. One patient was falsely diagnosed as having VGB attributed visual field loss with both SITA algorithms when there was none documented on Full Threshold (1/10 = 10%) suggesting that the false positive rate was 10% for both SITA algorithms. Closer inspection of the “normal” Full Threshold visual field plot (patient 15 Figure 3) reveals that if those locations demonstrating a 2% loss on pattern probability analysis were also included in the analysis then the patient would have been diagnosed with a VGB attributed defect. Additionally, information from their medical records shows that this patient had a confirmed clinical diagnosis of a VGB attributed field loss from previous visual field testing. The false negative rate was defined as the proportion of persons falsely identified as normal by SITA Standard or SITA Fast, among people with VGB attributed field loss identified by the gold standard Full Threshold algorithm. SITA standard correctly identified all patients with VGB attributed field loss documented on Full Threshold as having VGB attributed field loss on SITA standard suggesting a false negative rate of 0%. One patient was falsely identified as being normal with SITA Fast when there was a VGB attributed defect on the Full Threshold algorithm (1/6) suggesting a false negative rate of 17%. Closer inspection of the falsely identified field reveals that if those locations demonstrating a 2% loss on shape probability analysis were also included in the analysis then the patient would have been correctly diagnosed.
Table 4 Severity classification for all patients categorised using criteria by Wild et al (2009) [19]
Patient no. Full Threshold SITA Standard SITA Fast Classification Classification Classification
1 Severe Severe Severe
2 Moderate Moderate Moderate
3 Nil Nil Nil
4 Nil Nil Nil
5 Moderate Moderate Moderate
6 Nil Nil Nil
7 Mild Mild Nil
8 Nil Nil Nil
9 Nil Nil Nil
10 Nil Nil Nil
11 Severe Severe Severe
12 Nil Nil Nil
13 Nil Nil Nil
14 Severe Severe Severe
15 Nil Severe Moderate
Figure 3 Grey Scale plots for all patients with a VGB attributed visual field defect: left Full Threshold, middle SITA Standard, right SITA Fast.
To further assess the similarity in area of any visual field defect mapped by each threshold algorithm the number of non-overlapping defects or normal locations between two visual fields i.e. the dissimilarity between the fields was calculated and expressed as a percentage of the total number of visual field locations. Comparisons were made between threshold algorithms at visit 3 and also within each algorithm between visits 2 and 3. The group mean differences are illustrated in Table 5.
Table 5 Group mean percentage of dissimilar total probability stimulus locations
classified as normal or defective (±1 SD) threshold algorithms at the final visit (top) and between examinations using the same threshold algorithm (bottom)
Percentage Difference in Defect Area Between Threshold Algorithm (at Visit 3)
Full Threshold - SITA Standard
Full Threshold - SITA Fast
SITA Standard - SITA Fast
Total Deviation
16.2 (16.8) 17.1 (17.9) 17.1 (17.5)
Percentage Difference in Defect Area Within Threshold Algorithm (between Visits 2 and 3)
Full Threshold SITA Standard SITA Fast Total
Deviation
14.0 (14.2) 13.0 (13.3) 19.6 (20.5)
For total deviation probabilities, the average area of visual field defect between two threshold algorithms at the final visit varied by up to 17%. Although the least variation was demonstrated between Full Threshold and SITA Standard none of the differences were found to be statistically significant. Using a given threshold algorithm the average area of visual field defect varied by a maximum of 20% of stimulus locations between the second and third visits. Although SITA Fast yielded the greatest difference there was no statistical difference in this variability between threshold algorithms.
In order to demonstrate how each SITA algorithm displays the spatial pattern of VGB attributed field loss. The grey scale plots from all 3 testing strategies are presented for every patient with confirmed VGB attributed field loss (Figure 3) and also those without visual field loss (Additional file 2: Figure S1). Visual field plots were generated from the Humphrey sensitivity values (dB) using software which is freely available from one of the authors (HZ) [23,24]. Visual inspection of the plots shows they were approximately equivalent, for all 3 algorithms, for every patient with and without a confirmed VGB attributed visual field defect.
followed by SITA Fast and Full Threshold. These small differences however did not reach statistical significance between algorithms for either total deviation or the pattern deviation probability plots.
Figure 4 Showing the sum of total deviation aggregate (Top) and pattern deviation aggregate (bottom) probability levels for every patient.
Discussion
The findings that both SITA Standard was on average approximately twice as fast (7.6 minutes) and SITA Fast approximately 3 times as fast (4.7 minutes) as examinations completed using the Full Threshold algorithm (15.8 minutes) is in agreement with other studies of SITA in the normal population [25,26] in the investigation of glaucoma [27] and neuro-ophthalmological conditions [19] and adds nothing new to the existing literature. Test duration is of particular importance when examining patients with epilepsy as they are more prone to fatigue than other patient groups [28]. Researchers have shown that approximately 25% of patients (n = 734) with epilepsy are unable to produce a conclusive visual field test at any visit [14]. This finding suggests that examination speed is particularly important in this group of patients and has led the authors to suggest that ocular imaging of the retinal nerve fibre layer [29,30] might be a useful technique for those patients who are unable to carry out perimetry. Based on examination times our results suggest that SITA Fast would be the obvious choice of algorithm however it is vital that the algorithm of choice is able to yield both a high threshold agreement and a comparable diagnostic outcome equivalent to the Full Threshold algorithm.
Compared to the Full Threshold algorithm, the group mean pointwise sensitivities were on average 1.1 dB greater for SITA Standard and 1.7 dB greater for SITA Fast (Table 3). These results are concordant with findings in both normal and glaucomatous populations which report higher sensitivity as a function of algorithm in the order Full Threshold < SITA Standard < SITA Fast [31]. The higher sensitivity of SITA compared to the Full Threshold algorithm would be expected in SITA as the threshold is defined as the stimulus intensity which has a probability of seeing of 50% whereas in Full Threshold the estimate is the last seen stimulus using a step size of 2 dB [32]. Differences between SITA types could be explained by the greater imprecision in threshold estimate of SITA Fast which is integral to the design of the algorithm [16].
When considering the global indices MD and PSD there was no significant difference between any of the algorithms which suggests that they are interchangeable as diagnostic algorithms. However, global measures of the visual field status do not give a true representation of the nature and depth of visual field loss and do not yield any spatial information relating to the extent of visual field loss. Thus, it is necessary to examine the pointwise differences in sensitivity between and within threshold algorithms.
which is reflected in greater confidence intervals in the visual field periphery [18]. As the frequency of defect in VGB toxicity is greatest in the outer ring [12], the magnitude of the RMSE is also greater because this visual field area is damaged and thus contains a wider range of threshold values. Both SITA algorithms had less threshold agreement (group mean RMSE) and larger confidence intervals across all visual field regions when compared against Full Threshold (Figure 2). Within the outer field region the RMSE with SITA Fast was 27% higher than Full Threshold and SITA Standard was 19% higher than Full Threshold. Similar differences were found across all field regions suggesting that the SITA algorithms are equivalent methods for quantifying VGB attributed field loss. Visual fields are often unreliable in patients diagnosed with epilepsy [6]. When evaluating serial visual field tests researchers have reported that VGB recipients often show a variable degree of “normal” fluctuation that is not related to the pathological damage itself [33]. Both SITA algorithms demonstrated slightly less threshold agreement and larger between-subject variability when compared against the Full threshold algorithm (Figure 2). This might be because the faster paced SITA algorithms might be slightly more difficult in patients diagnosed with epilepsy either because of the aetiology associated with the epilepsy itself or because of the combination of medications that they are receiving.
Diagnostic outcome agreement was assessed in terms of false positive and false negative rate, area of defect, grey scale plots and depth of the defect. Results have indicated that the false negative rate was 0% for SITA Standard and 17% for SITA Fast. Closer inspection of the one falsely identified field reveals that if those locations which demonstrated a 2% loss on shape probability analysis were also included in the analysis then the patient would also have been correctly diagnosed as having VGB attributed field loss using SITA Fast. The false positive rate of both SITA strategies was 10% (n = 1). Further inspection of the “normal” visual field documented with Full Threshold algorithm however suggests a borderline visual field defect suggestive of VGB toxicity. Additionally, information from the patient’s medical records confirmed a clinical diagnosis of a VGB attributed field loss on previous visual field testing. This finding suggests that both SITA were correct in their diagnosis of a VGB attributed defect and the false positive rate was therefore 0%.
On average, in terms of defect area there was a lack of coincidence of the defect at approximately 17% of stimulus locations (total deviation probability). This inconsistency may reflect the normal physiological and psychological factors which influence perimetric examination [20,34]. When one threshold algorithm was compared to another, the level of probability defining the defect depth showed little difference across all algorithms. Whilst SITA Standard gave comparable results to the Full Threshold algorithm in terms of the defect depth at successive examinations, SITA Fast showed slightly less agreement. However, this difference was small and there was no statistical difference in this variability between threshold algorithms consequently this factor is not expected to confound clinical diagnosis. Results are in agreement with a visual inspection of the grey scale plots which reveals that all 3 algorithms produce equivalent field loss in relation to their grey scale plots (Figure 3). Overall SITA Standard algorithm appeared to show the greatest severity of visual field loss, for each patient followed by SITA Fast and Full Threshold (Figure 5). These small differences however again did not reach statistical significance between algorithms for either total deviation or the pattern deviation probability plots.
replication. We have demonstrated that the SITA threshold modelling procedure is capable of mapping the nature of VGB induced visual field loss in terms of its area and depth. In the ideal clinical environment the optimal threshold algorithm used in perimetry should be fast but able to accurately estimate the threshold consistently across successive examinations. Until the arrival of SITA there was always a trade off between reducing speed of examination and increasing variability in the threshold which had implications for both initial diagnosis and monitoring of visual field loss over time.
In the clinical environment, the visual field outcome with both SITA algorithms was directly equivalent to visual field examination using the Full Threshold algorithm in terms of defect area, defect severity and visual inspection of the grey scale plot. SITA was not comparable when threshold agreement within each algorithm (RMSE) was calculated between Full Threshold and the SITA algorithms for the outer ring (p = 0.017). When we analyzed how these small differences in threshold agreement transferred into the number of non-overlapping defects or normal locations between two visual fields within the same algorithm. We found little variation suggesting that these differences have little clinical impact.
The only other study to have evaluated SITA’s efficacy in detecting eye disease other than glaucoma concluded that SITA Standard was at least as good as the Full Threshold in detecting both optic neuropathy and hemianopic visual field loss [19]. The authors were unable to comment on SITA’s efficacy in examining these pathologies across visits as they did not carry out serial visual field tests.
Conclusion
Our research shows that both SITA algorithms are able to accurately map visual loss attributed to VGB across 2 successive examinations. Our findings in conjunction with the knowledge that patients diagnosed with epilepsy are particularly vulnerable to fatigue [28] suggest that SITA Fast might have an advantage when testing this particular group of patients.
Competing interests
Miriam Conway had her PhD funded by Aventis Pharmaceuticals.
Authors’ contributions
MC participated in the study design, data acquisition, statistical analysis, write up. SH participated in the write up. HZ participated in the statistical analysis & write up. RC participated in the statistical analysis & write up.
Acknowledgments
References
1. Aicardi J, Mumford J, Dumas C, Wood S: Vigabatrin as initial therapy for infantile
spasms: a european retrospective survey. Epilepsia 1996, 37:638–642.
2. Tolman JA, Faulkner MA: Vigabatrin: a comprehensive review of drug properties
including clinical updates following recent FDA approval. Expert Opin Pharmacother
2009, 10:3077–3089.
3. Hardus P, Verduin W, Postma G, Stilma J, Berendschot T, Van Veelen C: Long term
changes in the visual fields of patients with temporal lobe epilepsy using vigabatrin. Br J
Ophthalmol 2000, 84:788–790.
4. Midelfart A, Midelfart E, Brodtkorb E: Visual field defects in patients taking vigabatrin.
Acta Ophthalmol Scand 2000, 78:580–584.
5. Gaily E, Jonsson H, Lappi M: Visual fields at school-age in children treated with
vigabatrin in infancy. Epilepsia 2009, 50(2):206–216.
6. Wild JM, Chiron C, Ahn H, Baulac M, Bursztyn J, Gandolfo E, Goldberg I, Goñi FJ, Mercier F, Nordmann JP, Safran AB, Schiefer U, Perucca E: Visual field loss in patients
with refractory partial epilepsy treated with vigabatrin: final results from an open-label, observational, multicentre study. CNS Drugs 2009, 23:965–982.
7. Schmidt T, Rüther K, Jokiel B, Pfeiffer S, Tiel-Wilck K, Schmitz B: Is visual field
constriction in epilepsy patients treated with vigabatrin reversible? J Neurol 2002, 249:1066–1071.
8. Nousiainen I, Mäntyjärvi M, Kälviäinen R: No reversion in vigabatrin-associated visual
field defects. Neurology 2001, 57:1916–1917.
9. Manuchehri K, Goodman S, Siviter L, Nightingale S: A controlled study of vigabatrin
and visual abnormalities. Br J Ophthalmol 2000, 84:499–505.
10. Miller N, Johnson M, Paul S, Girkin CC, Perry JD, Endres M, Krauss GL: Visual
dysfunction in patients receiving vigabatrin: clinical and electrophysiologic findings.
Neurology 1999, 53:2082–2087.
11. Hardus P, Verduin W, Engelsman M, Edelbroek PM, Segers JP, Berendschot TT, Stilma JS: Visual field loss associated with vigabatrin: quantification and relation to dosage.
Epilepsia 2001, 42:262–267.
12. Conway M, Cubbidge RP, Hosking SL: Visual field severity indices demonstrate dose‐‐‐‐
dependent visual loss from vigabatrin therapy. Epilepsia 2008, 49:108–116.
13. Maguire M, Hemming K, Wild JM, Hutton JL, Marson AG: Prevalence of visual field
14. Wild JM, Ahn HS, Baulac M, Bursztyn J, Chiron C, Gandolfo E, Safran AB, Schiefer U, Perucca E: Vigabatrin and epilepsy: lessons learned. Epilepsia 2007, 48(7):1318–1327.
15. Wild JM, Flanagan JG, Barnes DA, Gilmartin BA, Good PA, Crews SJ: The qualitative
comparative analysis of the visual field using computer-assisted, semi-automated and manual instrumentation. II. Statistical analysis. Doc Ophthalmol 1984, 58:319–324.
16. Bengtsson B, Olsson J, Heijl A, Rootzén H: A new generation of algorithms for
computerized threshold perimetry, SITA. Acta Ophthalmol Scand 1997, 75:368–375.
17. Bengtsson B, Heijl A: SITA fast, a new rapid perimetric threshold test. description of
methods and evaluation in patients with manifest and suspect glaucoma. Acta
Ophthalmol Scand 1998, 76:431–437.
18. Heijl A, Lindgren G, Olsson J: Normal variability of static perimetric threshold values
across the central visual field. Arch Ophthalmol 1987, 105:1544–1549.
19. Wall M, Punke SG, Stickney TL, Brito CF, Withrow KR, Kardon RH: SITA standard in
optic neuropathies and hemianopias: a comparison with full threshold testing. Invest
Ophthalmol Vis Sci 2001, 42:528–537.
20. Wood JM, Wild JM, Hussey MK, Crews SJ: Serial examination of the normal visual
field using octopus automated projection perimetry evidence for a learning effect. Acta
Ophthalmol 1987, 65:326–333.
21. Bengtsson B, Heijl A: False-negative responses in glaucoma perimetry: indicators of
patient performance or test reliability? Invest Ophthalmol Vis Sci 2000, 41(8):2201–2204.
22. Wild JM, Martinez C, Reinshagenn G, Harding GFA: Characteristics of a unique visual
field defect attributed to vigabatrin. Epilepsia 1999, 40:1784–1794.
23. Zhu H, Crabb DP, Fredette MJ, Anderson DR, Garway-Heath DF: Quantifying
discordance between structure and function measurements in the clinical assessment of glaucoma. Arch Ophthalmol 2011, 129(9):1167–1174.
24. Russell RA, Garway-Heath DF, Crabb DP: New insights into measurement variability
in glaucomatous visual fields from computer modelling. PLoS One 2013, 8(12):e83595.
25. Bengtsson B, Heijl A, Olsson J: Evaluation of a new threshold visual field strategy,
SITA, in normal subjects. Acta Ophthalmol Scand 1998, 76:165–169.
26. Wild JM, Pacey IE, Hancock SA, Cunliffe IA: Between-algorithm, between-individual
differences in normal perimetric sensitivity: Full threshold, FASTPAC, and SITA. swedish interactive threshold algorithm. Invest Ophthalmol Vis Sci 1999, 40:1152–1161.
27. Wild JM, Pacey IE, O’Neill EC, Cunliffe IA: The SITA perimetric threshold
algorithms in glaucoma. Invest Ophthalmol Vis Sci 1999, 40:1998–2009.
29. Wild JM, Robson CR, Jones AL, Cunliffe IA, Smith PE: Detecting vigabatrin toxicity
by imaging of the retinal nerve fiber layer. Invest Ophthalmol Vis Sci 2006, 47(3):917–
924.
30. Lawthom C, Smith PE, Wild JM: Nasal retinal nerve fiber layer attenuation: a
biomarker for vigabatrin toxicity. Ophthalmology 2009, 116(3):565–571.
31. Bengtsson B, Heijl A: Comparing significance and magnitude of glaucomatous visual
field defects using the SITA and full threshold strategies. Acta Ophthalmol Scand 1999, 77:143–146.
32. Bengtsson B, Heijl A: Evaluation of a new perimetric threshold strategy, SITA, in
patients with manifest and suspect glaucoma. Acta Ophthalmol Scand 1998, 76:268–272.
33. Clayton LM, Stern WM, Newman WD, Sander JW, Acheson J, Sisodiya SM: Evolution
of visual field loss over ten years in individuals taking vigabatrin. Epilepsy Res 2013, 105(3):262–271.
34. Hudson C, Wild JM, O’Neill EC: Fatigue effects during a single session of automated
static threshold perimetry. Invest Ophthalmol Vis Sci 1994, 35:268–280.
Additional files
Additional_file_1 as DOCX
Additional file 1: Table S1 Reliability criteria for all patients (FT = Full Threshold; SS =
SITA Standard; SF = SITA Fast; V2 = visit 2; V3 = Visit 3).
Additional_file_2 as ZIP
Additional file 2: Figure S1 Grey Scale plots for all patients with no visual field defect: left
Patient 1
Patient 7 Patient 5 Patient 2
Patient 11
Patient 14
Additional files provided with this submission:
Additional file 1: 2511870061089548_add1.docx, 14K
http://www.biomedcentral.com/imedia/1935203961154623/supp1.docx
Additional file 2: 2511870061089548_add2.zip, 15814K

![Table 4 Severity classification for all patients categorised using criteria by Wild et al (2009) [19]](https://thumb-us.123doks.com/thumbv2/123dok_us/1504477.103139/8.892.112.785.752.1112/table-severity-classification-patients-categorised-using-criteria-wild.webp)
