City, University of London Institutional Repository
Citation
:
Lobachova, K. I. and Kharchenko, V. S. (2007). Assessing SoftwareVulnerabilities and Recovery Time Using Open Resources: Elements Of Technique And Results. Radioelectronic and Computer Systems, 8(27), pp. 61-65.
This is the published version of the paper.
This version of the publication may differ from the final published
version.
Permanent repository link:
http://openaccess.city.ac.uk/4157/Link to published version
:
Copyright and reuse:
City Research Online aims to make research
outputs of City, University of London available to a wider audience.
Copyright and Moral Rights remain with the author(s) and/or copyright
holders. URLs from City Research Online may be freely distributed and
linked to.
City Research Online: http://openaccess.city.ac.uk/ [email protected]
UDC 004.056:004.77
K. LOBACHOVA
1, V. KHARCHENKO
21
National Tavrida University,Simferopol, Ukraine
2
National Aerospace University Named After M.E. Zhukovsky, Kharkiv, Ukraine
ASSESSING SOFTWARE VULNERABILITIES AND RECOVERY TIME
USING OPEN RESOURCES: ELEMENTS OF TECHNIQUE AND RESULTS
Modern vulnerability resources are considered, their content, security and recovery time of different software products are analyzed. To make the process smoother and more efficient three main stages are distinguished: source overview, general security and severity analysis, and more detailed vulnerability consideration including recovery time. The proposed approach is universal and can be used for almost any software projects and systems.
vulnerability resources, security assessment, severity, recovery time
Introduction
The number of discovered vulnerabilities is increasing every day compelling software companies to be always on the alert to provide immediate protection. It is particu-larly important for web servers since they have always been very attractive targets for malicious attacks [1]. The term “zero-day exploit” as well as “zero-day protection” has gained widespread popularity as it often refers to ex-tremely effective attacks that are really difficult to defend against. However, according to the CERT Institute, 99% of network attacks leverage known vulnerabilities [2]. The situation is especially critical when it comes to secu-rity problems as nowadays secusecu-rity is considered one of the essentials of good computer systems. And that is why different security vulnerability groups, researchers, data-bases and testing tools have been actively growing and developing in recent five years.
In this paper we examine several most sophisticated vulnerability resources, analyze their structure and con-tent and use the provided information to compare sev-eral world-popular products in terms of failures, severity and recovery time (here by failure we mean vulnerabil-ity report). Our focus is primarily on the securvulnerabil-ity issues as they are at the heart of all system threats and viola-tions. But of course non-security bugs shouldn’t be ne-glected and in our future works we are going to take them into consideration as well.
The paper is structured into three main sections. Sec-tion 1 provides a brief overview of the existing vulner-ability resources, Sections 2 and 3 present the key con-tribution of this paper – content processing and security analysis based on the obtained data, where Section 2 describes the main approach and provides general vul-nerability and severity assessment while Section 3 works with more specific information and presents more detailed vulnerability results. All the presentations are given using Apache and IIS web servers as an example. The paper ends with a summary, concluding remarks and statement of possible future work.
Overview of software vulnerability
data resources
CSI/FBI (Computer Security Institute) study found that 90% of the respondents were impacted by security breaches. Of those who suffered a breach, 70% said the breaches were serious resulting in theft of proprietary information, financial fraud or sabotage of their data or networks [2]. And all these problems could have been avoided if people had taken proactive steps to eliminate the multitude of already discovered and published sys-tem vulnerabilities. There are number of resources spe-cially designed to help identify and solve the known security problems before a hacker takes advantage of them. CVE, NVD, Secunia, SecurityFocus, OVAL, CERT – it is not a complete list of such vulnerability
© K. Lobachova, V. Kharchenko
channels. Below we review the most popular of them, used in further vulnerability analysis.
CVE. Maintained by Mitre, CVE is not a stand-alone database but rather a dictionary of standardized names for vulnerabilities and other information security exposures. CVE aims to standardize the names for all publicly known vulnerabilities and security exposures. Its goal is to make easier to share data across separate vulnerability databases and security tools. The content of CVE is a result of collaborative work of various secu-rity experts; the resource is free and funded by US gov-ernment. Absolute majority of all vulnerability re-sources are based on and synchronized with the CVE vulnerability naming standard.
NVD. The National Vulnerability Database (NVD) is one of the most sophisticated vulnerability channels that integrates all publicly available U.S. government vulnerability resources. It contains more that 22,000 vulnerability entries with about 22 new ones added every day. NVD is based on CVE and synchronize all its updates with CVE dictionary. Severity scores are assigned using the Common Vulnerability Scoring Sys-tem standard. NVD's vulnerability information is avail-able for free to the public as an xml feed.
Secunia. A Danish commercial organization, that provides internet security services and offers software products for tracking computer viruses and security vul-nerabilities. The Secunia research staff test, verify, vali-date and assess public vulnerability reports, also con-ducting their own research in various products. The dis-covered vulnerabilities are reported to the vendors who issue updates and actively co-operate with the Secunia Research team.
The resource also provides a free web based infor-mation database with a good search that can yield the
list of particular product vulnerabilities, show their se-verity range and indicate whether the patches are avail-able, draw diagrams and provide other visual informa-tion representainforma-tion.
Security failure analysis. Elements
of analysis technique
Although many trusted security data recourses exist, we decided in favor of National vulnerability database (NVD) due to its large vulnerability base and well-structured data provided in xml format. For our analysis its content was parsed and CVE vulnerability indices, publish dates and severity scores for each particular product were picked out. Then product security characteristics were compared in terms of the number of discovered vulner-abilities and total severity rates, the information was visual-ized and the obtained results were analyzed.
For our work two rival (free and commercial) soft-ware - Apache and IIS servers were chosen as very se-curity-conscious and very popular products in the mod-ern engineering. To be precise, we were interested in 1.3, 2.0, 2.2 Apache branches (2.1 is omitted as an in-ternal development version never released officially) from “Apache Software Foundation” or “Apache.Group” vendors and 5.x (5.0 and 5.1), 6.0 IIS versions from “Microsoft” company. The retrieved data refer to “Apache”, “Apache HTTP Server” and “IIS”, “Internet Information Services” product names for Apache and IIS servers respectively.
Having parsed the database content a summary table is compiled for each software branch in the following format (Table 1).
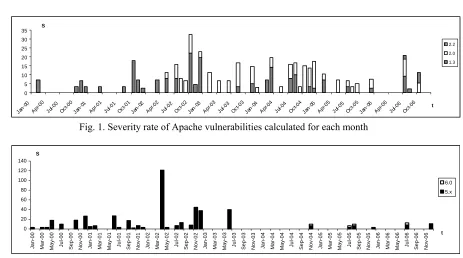
Combining the obtained results, we get the bar graphs that illustrate the comparison of three Apache and two IIS branches (fig.1 and fig.2).
Table 1 The database content for each software branch
CVE ID Published Severity CVSS_Score Apache branch
CVE-2002-0843 11.10.2002 High 8 1.3
CVE-2003-0460 27.08.2003 Low 3,3 1.3
CVE-2003-0542 03.11.2003 Medium 4,9 1.3
0 5 10 15 20 25 30 35 Jan-0 0
Apr-00 Jul-00 Oct-0 0
Ja n-01
Apr-01 Jul-0 1 Oct-0 1 Ja n-02 Apr-0 2 Jul-0 2 Oct-0 2 Jan-0 3 Apr-0 3 Jul-0 3 Oct-0 3 Jan-0 4
Apr-04 Jul-04 Oct-0 4
Jan-0 5
[image:4.595.74.537.58.316.2]Apr-05 Jul-0 5 Oct-0 5 Ja n-06 Apr-0 6 Jul-0 6 Oct-0 6 t S 2.2 2.0 1.3
Fig. 1. Severity rate of Apache vulnerabilities calculated for each month
0 20 40 60 80 100 120 140 J an-00 Mar-00 May -00 Ju l-0 0 S ep-00 No v -0 0 J an-01 Mar-01 May -01 Ju l-0 1 S ep-01 No v -0 1 J an-02 Mar-02 May -02 Ju l-0 2 S ep-02 No v -0 2 J an-03 Mar-03 May -03 Ju l-0 3 S ep-03 No v -0 3 J an-04 Mar-04 May -04 Ju l-0 4 S ep-04 No v -0 4 J an-05 Mar-05 May -05 Ju l-0 5 S ep-05 No v -0 5 J an-06 Mar-06 May -06 Ju l-0 6 S ep-06 No v -0 6 t S 6.0 5.x
Fig. 2. Severity rate of IIS vulnerabilities calculated for each month
Graphs show total severity rates of the discovered bugs for each month from January 2000 through De-cember 2006. The colors indicate each branch’s contri-bution to the total severity value. It is calculated as
1 N m n n S S =
=
∑
, where Sm represents a total severity rateassessed within one month, N is the number of
vulner-abilities found during this month and
S
n is the rate ofn-th severity. Proceeding from Alhazmi-Malaiya work
[1] and fitting vulnerabilities data for each Apache branch to the time-based model, will give us the follow-ing results (fig. 3).
0 5 10 15 20 25 30 35 40 45 50
Jul-98 Dec-99 Apr-01 Sep-02 Jan-04 May-05 Oct-06 Feb-08
t N
[image:4.595.72.281.576.743.2]1.3 2.0 2.2
Fig. 3. Graph of cumulative number of vulnerabilities
It is clearly seen that the slope of the graph for Apache 2.0 is steeper. Steep graph shows higher vul-nerability consistence than that of 1.3 version. You can read the growth rate directly from the slope of the graph: For example, in May 2002, when the first Apache 2.0 version was released, the number of Apache 1.3 vulnerabilities already made 15, but in November 2004 Apache 2.0 came up with Apache 1.3 and then outrun the old version. Now if we examine severity ranges assigned to the same vulnerabilities by different resources we can find great dissimilarity as the methods of evaluation are not identical and even not exactly comparable. Secunia provides criticality graphs on its web site so we decided to present similar illustrations for NVD database vulnerabilities (fig. 4). It is easy to see that the majority of discovered vulner-abilities, luckily, has low severity. The most serious security loopholes were disclosed in 1.3 branch though it is excusable as 1.3 is the first and the most long-lived Apache version.
Recovery time analysis
As a rule researchers discussing product security fo-cus their attention on the number of found vulnerabili-ties considering it a kind of a dependability rate. Some-times severity score is mentioned. But to obtain a com-plete dependability description of a certain product, other important factors must be taken into account. The one we are going to consider is the amount of time it takes for a vendor to prepare a patch and return back to normal secure operation after a vulnerability report. We call it “recovery time” as vulnerability disclosure is very similar in its essence to system failure. On their web site eEye Digital Security company wrote that “The window of time to remediate new vulnerabilities has shrunk to just hours, compared to months in the past.” We decided to investigate this question and analyze the recovery time needed for Apache and Microsoft companies to fix the reported vulnerabilities.
The time of vulnerability disclosure is defined differ-ently in the security community and industry. Usually, vulnerability information is discussed in mailing lists and only then is approved and published as a security advi-sory. The time it appears in different databases often
dif-fers and this nonoccurrence can make up several years. So to get the correct discovery time information we de-cided to use CVE library since it is the most reliable and standardized resource other databases are based on. Patches and updates are maintained by software vendors and so the dates of fixes for our products are available in Apache Security Reports and IIS Microsoft Security Bul-letins. Having all the necessary information at our dis-posal, we can now extend product detail tables to look like table 2.
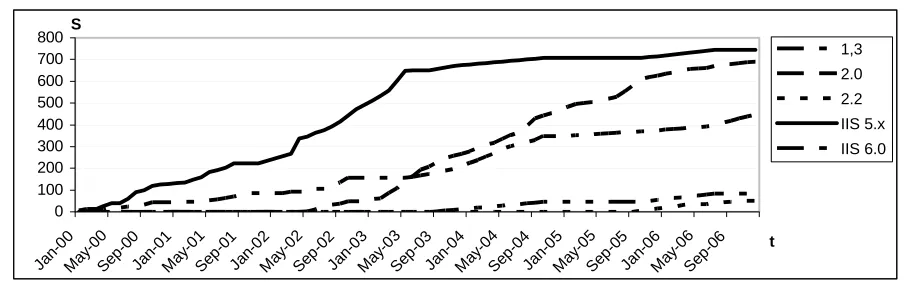
The improved graph (Fig. 5) takes proper account of recovery time and shows the cumulative severity of all the discovered and non-fixed bugs at each period of time. The review of Apache products clearly shows that Apache 2.0 has always been the least stable branch with a lot of security loopholes while time-proved Apache 1.3 version is pretty reliable and secure. Apache 2.2 branch was released relatively recently, and as it is not yet popu-lar there is no tangible benefit of vulnerability discovery and exploitation. IIS 5.0 proved itself to be the most sta-ble and reliasta-ble web server over the last three years, how-ever, you can see that it had a lot of security problems in the past.
Table 2
Еxtend product
CVE ID Published (NVD) Discovered (CVE-mitre) (Apache report) Fixed time (days) Recovery nia rate Secu- NVD rate Apache branch
CVE-2002-0843 11.10.2002 08.08.2002 03.10.2002 56 3 8 1,3
CVE-2003-0460 27.08.2003 26.06.2003 18.07.2003 22 2 3,3 1,3
CVE-2003-0542 03.11.2003 14.07.2003 27.10.2003 105 2 4,9 1,3
CVE-2003-0987 03.03.2004 16.12.2003 12.05.2004 148 2 7 1,3
Apache 2.0 severity
Low
Medium
High
Apache 1.3 severity
Low
Medium
High
Apache 2.2 severity
Low
Medium
High
IIS 5.x severity
Low
Medium
High
IIS 6.0 severity
Low
Medium
Fig. 5. Graph of cumulative vulnerability severity
Its proximate successor – IIS6 also shows good promise in terms of security.
Comparing IIS and Apache product recovery time shows that in average open Apache community takes 84 days to fix the reported vulnerability.
It is twice more than that of commercial Microsoft organization.
Conclusion
In this paper different vulnerability resources were considered to evaluate and compare product security. The approach used represents a general solution that makes comparing security vulnerabilities possible. The method is generic and can be applied to the wide range of software products. When used for Apache and IIS http servers, it demonstrates the comparison between an open source and commercial software in terms of secure operation. Both analyzed organizations have good po-tentialities to create reliable and secure software. It should be emphasized that proceeding with other re-courses, for example [1], allows us to analyze not only the number of discovered vulnerabilities but their sever-ity and recovery time and, therefore, to estimate the product security as a whole.
Further research is needed to evaluate the non-security issues and estimate its contribution to the whole software dependability.
The proposed technique can also be extended for ser-vice-oriented architectures and other complex software component-based systems if it is necessary to consider the system dependability as a whole.
References
1. Sung-Whan Woo, Omar H. Alhazmi, Yashwant K. Malaiya. Assessing Vulnerabilities in Apache and IIS HTTP Servers. 2006. – 240 р.
2. Network Security and Vulnerability Assessment [Електрон. ресурс]. – Режим доступу: www.eeye. com, February 2007.
3. Mitre Corp, Common Vulnerabilities and Expo-sures [Електрон. ресурс]. – Режим доступу: http:// www.cve.mitre.org/, February 2007.
4. Vulnerability and Virus Information [Електрон.
ресурс]. – Режим доступу: http://secunia.com, Febru-ary 2007.
5. National Vulnerability Database [Електрон. ре
-сурс]. – Режимдоступу: http://nvd.nist.gov/, February 2007.
6. Apache Software Foundation Bug System [Елек
-трон. ресурс]. – Режимдоступу: http://issues. apache. org/bugzilla/, February 2007.
7. An Open Online Encyclopedia [Електрон. ресурс]. –
Режимдоступу: http://en.wikipedia.org, February 2007. 8. Apache Security Updates [Електроннийресурс]. –
Режим доступу: http://httpd.apache.org/security_ re-port.html, February 2007.
9. Microsoft Security Bulletin [Електрон. ресурс]. –
Режим доступу: http://www.microsoft.com/technet/se-curity/bulletin, February 2007.
Надійшладоредакції 5.03.2007
Рецензент:д-ртехн. наук, проф. В.М. Илюшко, На
-ціональнийаерокосмічнийуніверситетім. М.Є. Жу
-ковського «ХАІ», Харків.
0 100 200 300 400 500 600 700 800
Ja n-00
Ma y-00
Se p-00
Ja n-01
Ma y-01
Sep-0 1
Ja n-02
Ma y-02
Se p-02
Ja n-03
Ma y-03
Se p-03
Jan-0 4
May -04
S ep-04
Ja n-05
Ma y-05
Se p-05
Ja n-06
Ma y-06
Sep -06 t
S