Running Head: BI-DIMENSIONAL ATTITUDES
Testing the bi-dimensional effects of attitudes on behavioural intentions and subsequent behaviour
Mark A. Elliott, Sarah E. Brewster, James A. Thomson, Carly Malcolm and Susan Rasmussen
School of Psychological Sciences and Health, University of Strathclyde
Correspondence concerning this article should be addressed to: Dr. Mark Elliott,
School of Psychological Sciences and Health, University of Strathclyde,
40 George Street, Glasgow,
G1 1QE,
United Kingdom.
Tel: +44 (0) 141 548 5829.
Abstract
Attitudes are typically treated as unidimensional predictors of both behavioural intentions and subsequent behaviour. On the basis of previous research showing that attitudes comprise two independent, positive and negative dimensions, we hypothesised that attitudes would be bi-dimensional predictors of both behavioural intentions and subsequent behaviour. We focused on health-risk behaviours. We therefore also hypothesised that the positive dimension of attitude (evaluations of positive behavioural outcomes) would better predict both behavioural intentions and subsequent behaviour than would the negative dimension, consistent with the positivity bias/offset principle. In study 1 (cross sectional design), N=109 university students completed questionnaire measures of their intentions to binge-drink and the positive and negative dimensions of attitude. Consistent with the hypotheses, both attitude dimensions independently predicted behavioural intentions and the positive dimension was a significantly better predictor than was the negative dimension. The same pattern of findings emerged in study 2 (cross sectional design; N = 186 university students) when we predicted intentions to binge-drink, smoke and consume a high-fat diet. Similarly, in study 3 (prospective design; N
= 1232 speed limit offenders), both the positive and negative dimensions of attitude predicted subsequent (6-month post-baseline) speeding behaviour on two different road types and the positive dimension was the better predictor. The implications for understanding the
motivation of behaviour and the development of behaviour-change interventions are discussed.
Introduction
A substantial number of studies have been conducted to test the relationship between attitudes, on the one hand, and behavioural intentions or subsequent behaviour, on the other. In these studies, attitudes are typically conceptualised as unidimensional constructs, meaning that individuals are held to evaluate behaviours along a single ‘positive-negative’ dimension. This unidimensional conceptualization of an attitude has a long tradition in social psychology (e.g., Fishbein, 1963; Osgood, Suci, & Tanenbaum, 1957; Thurstone, 1928). More recently, however, research has shown that attitudes are bi-dimensional constructs, meaning that individuals can evaluate the positivity and negativity of a behaviour separately along two independent, ‘positive’ and ‘negative’ dimensions (e.g., Conner et al., 2002). This raises the question of whether attitudes have bi-dimensional effects on behaviour. That is, do the positive and negative dimensions of attitude predict behaviour independently? Three studies are presented in this article, all of which were designed to test the potential bi-dimensional relationships between attitudes, on the one hand, and behavioural intentions (studies 1 and 2) or subsequent behaviour (study 3), on the other.
The bi-dimensional conceptualization of an attitude comes originally from the literature on attitudinal ambivalence (e.g., Kaplan, 1972). Attitudinal ambivalence is defined as a state in which an object or behaviour is simultaneously evaluated as both positive and negative (e.g., Thompson, Zanna, & Griffin, 1995). Unlike traditional conceptualizations of attitudes, this view implies that individuals do not integrate all of their evaluations of an object’s positive and negative attributes (e.g., outcomes of a behaviour) into a single unidimensional, bipolar attitude (e.g., ‘for me, performing behaviour X is: bad/good’). Instead, individuals are held to evaluate the positive and negative attributes of an object on separate unipolar
attitudes towards the same object.
Empirical support for the bi-dimensional conceptualization of an attitude comes from factor analytic studies, which demonstrate that evaluations of positive and negative object-attributes load onto two independent dimensions (e.g., Conner, et al., 2002). However, attitudes have continued to be treated as unidimensional constructs in tests of the attitude-intention and attitude-behaviour relationships (for reviews see McEachan, Conner, Taylor, & Lawton, 2011; Wallace, Paulson, Lord, & Bond, 2005). Paradoxically, attitudes have even been treated as unidimensional predictors of behaviour in studies of attitudinal ambivalence (see Conner & Sparks, 2002). In these studies, a primary focus has been to establish that attitudinal ambivalence is a facet of attitude strength, with lower levels of ambivalence equating to stronger, better-formed attitudes. In contrast with the bi-dimensional view of attitudes, the assumption is that the positive and negative attitude dimensions are integrated into an overall (i.e., unidimensional, bipolar) attitude, the strength of which is dictated by the degree of evaluative conflict between the positive and negative dimensions. In accordance with this assumption, and on the basis that attitude-behaviour correspondence increases with attitude strength (e.g., Glasman & Albarracín, 2006; Kraus, 1995), researchers have derived overall measures of attitudinal ambivalence from items designed to measure separately the positive and negative dimensions of attitude, and demonstrated that they attenuate the
relationship between unidimensional measures of attitudes, on the one hand, and measures of behavioural intentions or subsequent behaviour, on the other (see Conner & Sparks, 2002). Notwithstanding the importance of this research, a serious acceptance of the bi-dimensional view of attitudes requires that the positive and negative dimensions are treated as independent predictors of behaviour.
expectancy beliefs have been tested in several studies (e.g., Anderson, Pollak, & Wetter, 2002; Fromme, Katz, & Rivet, 1997; Lawton, Conner, & Parker, 2007; Lee, Greely, & Oei, 1999). These studies show that behavioural performance increases both with the extent to which positive outcomes are expected and negative outcomes are unexpected. However, expectancy beliefs are antecedent to attitudes (e.g., Ajzen, 1985; Fishbein & Ajzen, 1975), meaning that the potential bi-dimensional effects of the proximal motivational determinants of behaviour have not yet been established. Additionally, studies of expectancy beliefs require participants to rate the likelihood of behavioural outcomes that have been coded dichotomously by researchers as either positive or negative (e.g., Lawton et al., 2007). Equal valence is therefore implicitly assumed across both participants and outcomes. This is problematic because the extent to which a behaviour (e.g., smoking) is initiated by an expected outcome (e.g., ‘a nicotine hit’) is contingent upon the degree of valence that individuals attach to that outcome (e.g., Ajzen, 1985; Fishbein & Ajzen, 1975), and equal valence assumptions ignore both between- and within-participant variation in outcome
evaluations (e.g., Conner, Kirk, Cade, & Barrett, 2001; Elliott, Armitage, & Baughan, 2005). The primary aim of this research, therefore, was to test the bi-dimensional effects of attitudes on behaviour. We hypothesised that both the positive and negative dimensions of attitude will predict behaviour independently. We tested this hypothesis in the context of health-risk behaviours: binge-drinking, smoking, consumption of a high saturated fat diet and exceeding the speed limit. These behaviours were chosen because they are commonly
associated with conflicting sources of motivation (e.g., positive and negative outcomes), which gives rise to both positive and negative evaluations and, therefore, bi-dimensional attitudes (Conner & Sparks, 2002).
research on positive and negative asymmetries (e.g., Peeters & Czapinski, 1990; Rozin & Royzman, 2001) gives rise to two possibilities. The first possible asymmetry is that the negative dimension of attitude will be more predictive of behaviour than will the positive dimension. This asymmetry is derived from the ‘negativity bias’. This bias refers to the widespread tendency for negative events (e.g., punishments, losses, undesirable outcomes) to have greater urgency than positive events (e.g., rewards, gains, desirable outcomes) in
situations where the positives and the negatives have equivalent status (see Baumeister, Bratslavsky, Finkenauer, & Vohs, 2001). The second possible asymmetry is that the positive dimension of attitude will be more predictive of behaviour than will the negative dimension. This asymmetry is based on the ‘positivity bias’ (e.g., Boucher & Osgood, 1969) and the related ‘positivity offset principle’ (e.g., Cacioppo, Gardner, & Berntson, 1997). These biases refer to the tendency for individuals to pay more weight to positive than negative events in situations where the positives are the most likely occurrence (positivity bias), or where the negatives are unlikely or distant (positivity offset).
In this research, we hypothesised that the positive dimension of attitude would be a better predictor of behaviour than would the negative dimension. We hypothesised this asymmetry for several reasons. First, the outcomes that are characteristic of health-risk behaviours are better aligned with the conditions necessary for the positivity bias/offset principle than the negativity bias. More specifically, the positive outcomes that are commonly associated with behaviours such as smoking (e.g., ‘nicotine hit’), binge-drinking (e.g.,
proximal negative outcomes of health-risk behaviours (e.g., hangover following excessive alcohol consumption or feelings of guilt following an episode of unhealthy eating) tend be take second place to the positive outcomes in the temporal sequencing of events.
Additionally, individuals tend to possess illusory control beliefs (e.g., Langer, 1975), meaning that they exaggerate both the perceived likelihood of positive outcomes and perceptions of control over negative outcomes (e.g., McKenna, 1993; Thompson, 1999). Under these circumstances, therefore, evaluative information associated with positive
outcomes (i.e., the positive dimension of attitude) is likely to dictate behavioural performance to a greater extent than evaluative information associated with negative outcomes.
The next reason why we expected the positive dimension of attitude to better predict health-risk behaviours than the negative dimension is that the positive dimension is likely to be stronger (e.g., more stable and accessible in memory) for this particular class of
behaviours. In particular, the positive outcomes of health-risk behaviours tend to be experienced directly whereas many of the negative outcomes tend to be experienced indirectly (e.g., through knowing someone who has experienced those outcomes or media campaigns), and research shows that attitudes formed on the basis of direct experience are stronger, and thus more predictive of behaviour, than are attitudes formed on the basis of indirect experience (e.g., Doll & Ajzen, 1992; Glasman & Albarracín, 2006; Kraus, 1995). Furthermore, the greater frequency and immediacy of positive outcomes relative to negative outcomes is likely to reinforce the positive dimension of attitude at the expense of the negative dimension.
(1999) showed that positive expectancy beliefs accounted for more variance in the quantity of alcohol consumed per drinking session than did negative expectancy beliefs. Fromme et al. (1997) showed that positive expectancies had larger standardised beta weights than did negative expectancies in a series of regression models predicting risk-taking across a range of behaviours including drug-use, heavy-drinking, and engagement in illegal activities such as drink-driving. Only Lawton et al. (2007, study 1) provided evidence that negative expectancy beliefs might be more predictive of health-risk behaviours than positive expectancy beliefs. These researchers found that expectations of negative affective consequences had larger standardised beta weights than did expectations of the positive affective consequences in the prediction of both self-reported and objectively assessed speeding behaviour. However, the absolute difference in the magnitude of the beta weights was somewhat small and not subjected to tests of statistical significance (for self-reported speeding: β = –.35, p < .001 versus β = .24, p < .001; for objectively assessed speeding: β = –.21, p < .01 versus β = .13, p
< .05). Also, a second study by Lawton et al. (2007) showed that positive expectancy beliefs had much larger standardised beta weights than did negative expectancy beliefs in the prediction of both self-reported (β =.43, p < .001 versus –.17, p < .001) and objectively measured (.31, p < .001 versus –.12, p < .05) smoking behaviour, consistent with the general trend in the literature.
Aims & Hypotheses
better predictor of both behavioural intentions and subsequent behaviour than would the negative dimension.
Study 1
Study 1 was designed to provide an initial test of the potential bi-dimensional
relationships between attitudes and behavioural intentions. The target behaviour was binge-drinking.
Method
Participants. N = 109 students were sampled from a university in the west of Scotland following advertisements placed on virtual learning environments and notice boards around campus, and announcements made in lectures asking for volunteers. All participants
completed the study in full. The mean age of the sample was 20.26 years old (SD = 1.88) and 78% was female. Given that official statistics show that females comprise 56% of students at Higher Education Institutions in Scotland (Scottish Government, 2013), the data were
weighted to statistically correct the sampled gender bias. However, the same pattern of findings emerged whether the weighted or non-weighted data were used.1.
Design and procedure. A cross sectional design was employed. Each participant self-completed a questionnaire that measured their intention to binge-drink and the positive and negative dimensions of their attitude. The questionnaire was constructed and delivered online, using Qualtrics Survey Design and Administration Software. After volunteering, each participant was asked for an email address to which the web-link to the questionnaire was sent. At the start of the questionnaire, the participants were told that the study was an investigation into students’ attitudes towards binge-drinking. They were also told that
participation would be anonymous and involve the completion of one questionnaire to which there would be no right or wrong answers.
multiple items to measure behavioural intentions and each dimension of attitude without unduly increasing the risk of participant attrition or fatigue (e.g., Hart, Rennison, & Gibson, 2005). The participants responded to each item using a 9-point scale (scored 1 to 9). The items were presented in a pseudo random order to avoid potential order effects. Intention to binge-drink was measured with four items: “Do you intend to binge-drink over the next month?” (definitely no to definitely yes); “Do you plan to binge-drink over the next month?” (definitely no to definitely yes); “I want to binge-drink over the next month” (strongly disagree to strongly agree); and “How likely/unlikely is it that you will binge-drink over the
next month?” (extremely unlikely to extremely likely). The mean of these items served as a composite measure of behavioural intention for use in the data analyses. In line with research on attitudinal ambivalence, unipolar split semantic differential scales (Kaplan, 1972) were used to measure the positive and negative dimensions of attitude. These items required the participants to rate separately the positive and negative attributes of binge-drinking. For example, the participants were asked to “think only about the positive (negative) outcomes that you associate with binge-drinking” and to rate “how positive (negative) are they?” (not at all positive [negative] to extremely positive [negative]). In total, the participants responded to six items that required them to evaluate the positive attributes of binge-drinking (positive, beneficial, rewarding, fun, pleasant, enjoyable) and six items that required them to evaluate the negative attributes (negative, harmful and unrewarding, boring, unpleasant and
unenjoyable).2 The mean of the positive items served as a composite measure of the positive dimension of attitude and the mean of the negative items served as a composite measure of the negative dimension.
Results
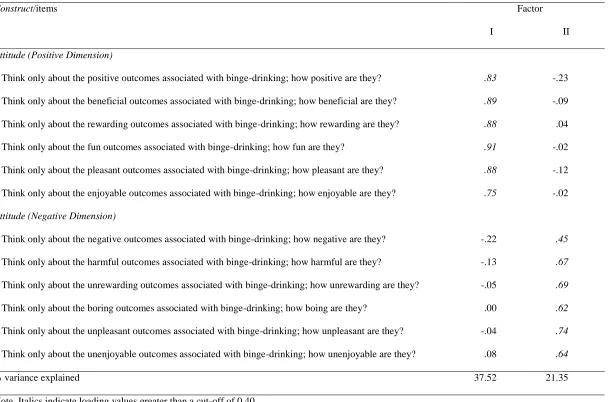
1). The results provided strong support for the independence of the two attitude dimensions. Two factors emerged from the data with Eigen-values greater than 1. The rotated factors accounted for 59% of the variance in the correlation matrix. Using a cut-off value of 0.40, all of the items used to measure the positive dimension of attitude loaded only onto factor 1 and all of the items used to measure the negative dimension of attitude loaded only onto factor 2.
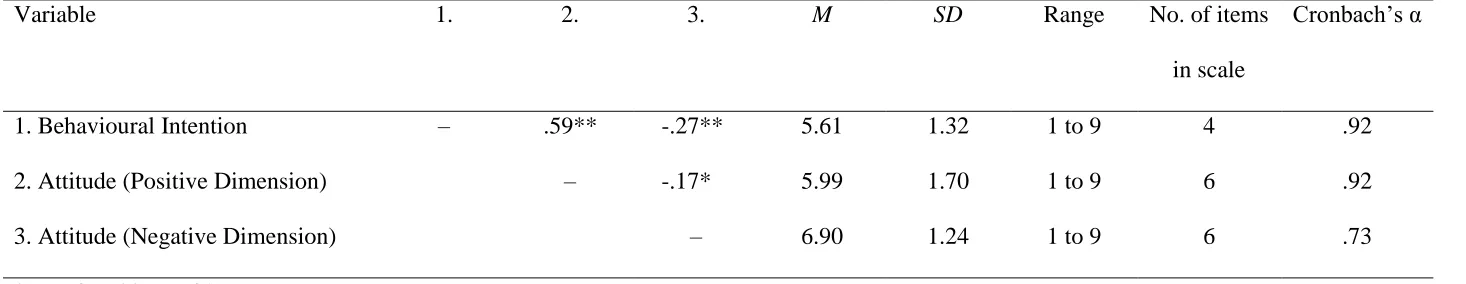
Descriptive statistics and correlations. The Cronbach’s alphas, sample means, standard deviations and correlations for the composite measures of behavioural intention and the two dimensions of attitude are shown in table 2. The Cronbach’s alphas show that the reliability of each scale was α = 0.73 or higher, indicating good reliability (Nunnally, 1978). The sample means show that the participants, on average: intended to binge-drink to a moderate extent, and evaluated the positive outcomes of binge-drinking as moderately positive and the
negative outcomes as moderately to very negative. The correlations show that the two attitude dimensions were correlated negatively. However, in line with the findings from the factor analysis, the correlation coefficient was just r = -.17 (p < .05), easily satisfying Tabachnick and Fidell’s (1996) established criterion for demonstrating the independence of constructs (r
< 0.70). The correlations also show that the positive dimension of attitude was correlated positively with behavioural intentions, whereas the negative dimension was correlated negatively with behavioural intentions.
t for difference statistics).
Discussion
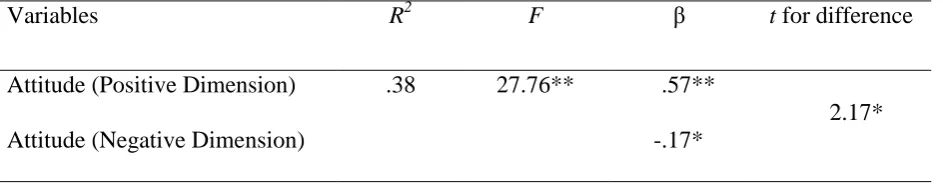
Study 1 shows that the positive and negative dimensions of attitude are independent predictors of university students’ intentions to binge-drink. The study also shows that the positive dimension of attitude is a significantly better predictor of binge-drinking intentions than is the negative dimension. Whilst these findings are consistent with the hypotheses, a limitation of study 1 is that it focused on just one health-risk behaviour. The question
therefore arises as to whether the findings generalise to other behaviours. A second study was therefore designed.
Study 2
The aim of study 2 was to test whether the findings from study 1 generalise across health-risk behaviours. This study focused on binge-drinking, eating a high saturated fat diet and cigarette smoking.
Method
Participants. N = 193 students were sampled from the same university as in study 1, using the same recruitment procedures (but note that none of the participants who took part in study 2 participated in the previous study). All participants completed the study. The mean age of the sample was 26.12 years old (SD = 10.24) and 68% was female. As in study 1, the sampled gender bias was statistically corrected but the same pattern of findings emerged from both the weighted and non-weighted data.3
Design and procedure. Everything was the same as in study 1, except that the questionnaires focused on three target behaviours instead of just one and therefore single rather than multiple item measures of each construct were employed so as to minimise attrition and possible fatigue biases (e.g., Hart et al., 2005).
Intentions to perform each behaviour were measured by asking the participants: “How much do you intend to [eat a high saturated fat diet/binge-drink/smoke] in the future?” (not at all to
very much). The positive dimension of attitude was measured separately for each behaviour by asking the participants to “think only about the positive outcomes associated with [eating a high saturated fat diet/binge-drinking/smoking]” and to rate “how positive are they?” (not at all positive to extremely positive). The negative dimension of attitude was also measured separately for each behaviour by asking the participants to “think only about the negative outcomes associated with [eating a high saturated fat diet/binge-drinking/smoking]” and to rate “how negative are they?” (not at all negative to extremely negative).
Results
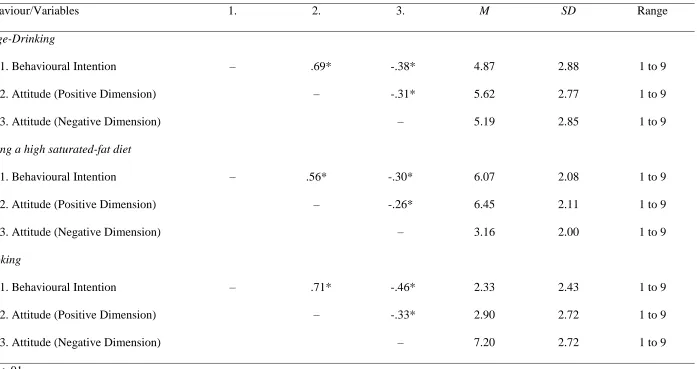
Descriptive statistics and correlations. The sample means in table 4 show that the participants had, on average, moderate intentions to binge-drink and eat a high saturated fat diet but low intentions to smoke. Additionally, the participants evaluated the positive outcomes of binge-drinking and eating a high saturated fat diet as moderately positive, on average, and the negative outcomes of these behaviours as moderately negative. For smoking, the positive outcomes were not rated very positively and the negative outcomes were rated very negatively.
Consistent with the findings from study 1, table 4 also shows that the positive and negative dimensions of attitude were not correlated highly. The mean correlation across the three behaviours was just r = -.30 (mdn r = -.31) and the correlation did not exceed r = -.33 for any behaviour. Also in line with study 1, table 4 shows that the positive dimension of attitude was correlated positively with intentions to perform each behaviour and the negative dimension was correlated negatively with behavioural intentions.
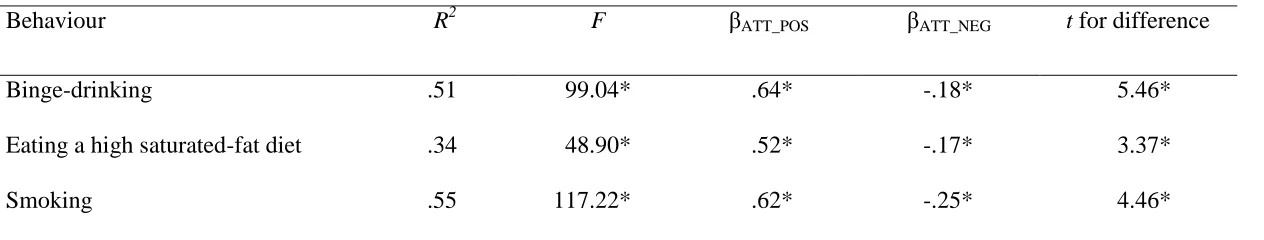
intention was the dependent variable and the positive and negative dimensions of attitude were the independent variables. As table 5 shows, 51%, 34% and 55% of the variance was accounted for in participants’ intentions to binge-drink, eat a high saturated-fat diet and smoke, respectively. Each analysis showed that both the positive and negative dimension of attitude independently predicted behavioural intentions and that the positive dimension had a significantly larger beta weight than did the negative dimension (see t for difference
statistics).
Discussion
Study 2 shows that the findings from study 1 generalise across health-risk behaviours. In line with our primary hypothesis, both the positive and negative dimensions of attitude were independent predictors of intentions to perform all three behaviours examined in this study. In line with our secondary hypothesis, the positive dimension was a better predictor of behavioural intentions than was the negative dimension. Whilst both studies 1 and 2 support our hypothesis, a potential limitation with both studies is that measures of behavioural intentions were used as dependent variables rather than measures of subsequent behaviour. Although strong correlations are often observed between behavioural intentions and subsequent behaviour, these correlations are far from perfect, meaning that behavioural intentions are not ideal proxies for behaviour (e.g., Elliott, 2012; Elliott & Ainsworth, 2012; McEachan et al., 2011). Additionally, student samples were used in both studies 1 and 2, and student samples are often criticised for being unrepresentative of the wider population and susceptible to experimenter demands (Jackson et al., 2005). A third study was therefore conducted to address these two limitations.
Study 3
speed limit (speeding) in a national sample of recent speed limit offenders.
Method
Participants. A sample of speed limit offenders was recruited from five Police Force regions in England (two located in the north of the country, two located in the south and one located in the mid-lands). N = 1232 participants completed the study in full. The mean age of the final sample was 56.56 years old (SD = 13.63). Sixty one percent was male.
To gage the representativeness o the final sample, its age and gender profile was compared with the age and gender profile of the initial sample of drivers who were invited to take part in the study, using anonymized age and gender information provided by the Police. The final sample was virtually identical to the initial sample in terms of gender (males comprised 61% of the final sample and 63% of the initial sample). However, as is typical in published survey research, younger participants were slightly under-represented and older participants were over-represented: 5% of the initial sample was aged 17-24 years old, compared with 2% of the final sample; 24% of the initial sample was aged 25-39 years old, compared with 11% of the final sample; 45% of the initial sample was aged 40-59 years old, compared with 42% of the final sample; and 26% of the initial sample was aged >60 years old, compared with 45% of the final sample. We therefore weighted the data to statistically correct any potential age biases. All subsequent analyses are based on the age-weighted data, although it should be noted that the same pattern of findings was also obtained when the non-age-weighted data were used.4
Given the large sample size, a criterion power analysis was conducted to determine the alpha needed to identify effects as statistically significant without inflating the type I error rate. Given power = 0.80 (see Cohen, 1988) and N = 1232, α = .002.
within the four months preceding the study. The items measuring the positive and negative dimensions of attitude were operationalised with regards to speeding over the next six months. Both attitude dimensions were also measured with respect to speeding on urban and rural roads separately in order to increase our ability to generalise from the results.5 A completed questionnaire was returned by 2735 drivers. Six months later, at time 2, 45% of these drivers (n = 1232) returned a second questionnaire designed to measure their
subsequent speeding behaviour. These response rates compare well with previous prospective surveys of drivers in which researchers have employed similar items to those used in this study (e.g., Elliott, Armitage & Baughan, 2003; Elliott et al., 2005). Additionally, a series of ANOVAs showed that showed that those participants who completed the study in full did not differ from those who dropped out at Time 2 on the Time 1 measures: F(1, 2733) = 1.49, ns
for the positive dimension of attitude towards speeding on urban roads; F(1, 2733) = 5.18, ns
for the negative dimension of attitude towards speeding on urban roads; F(1, 2733) = 0.77, ns
for the positive dimension of attitude towards speeding on rural roads; and F(1, 2733) = 0.22,
ns for the negative dimension of attitude towards speeding on rural roads. The drop-outs were therefore were excluded from the subsequent data analyses.
Covering letters were sent at both time points along with pre-paid envelopes for the participants to return their completed questionnaires to the research team. The covering letters explained that: the study was about drivers’ attitudes towards speeding; there were no right or wrong answers to any of the questions; and the data would be used for research purposes only, treated confidentially and not linked with any personal information (e.g., name and address details). The time 1 and time 2 data were matched for all participants using 5-digit unique identifiers that were printed on both questionnaires.
each road type (urban/rural). At time 2, subsequent behaviour was measured by asking: “How often did you drive faster than the speed limit on [urban/rural] roads over the last 6 months?” (never to all the time). This self-reported behaviour measure has previously been shown to be highly correlated with objectively assessed speeding (r = .67; Elliott, Armitage &
Baughan, 2007). Also, since all measures were self-reported, there is no reason to expect any potential self-reporting biases (e.g., Luchins, 1957; Paulhus, 2002) to differently affect the relationships being examined in this research, making self-reported behaviour suitable for testing the hypotheses.
Results
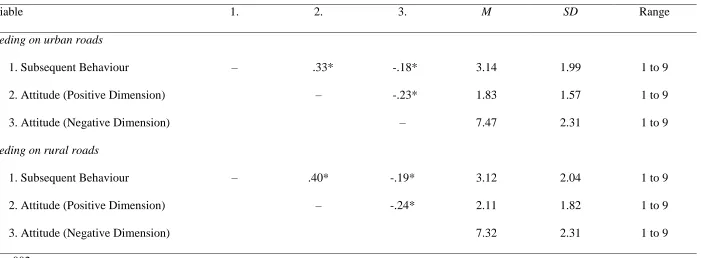
Descriptive statistics and correlations. The sample means in table 6 show that the participants, on average, exceeded the speed limit infrequently on both urban and rural roads. The means also show that the participants, on average, did not rate the positive outcomes of speeding on both road types very positively, but rated the negative outcomes very negatively. The correlations in table 6 show that the two dimensions of attitude were not correlated highly for either road type (r = -.23 for speeding on urban roads; r = -.24 for speeding on rural roads). They also show that the positive dimension of attitude was correlated positively with subsequent behaviour and the negative dimension of attitude was correlated negatively with subsequent behaviour (both road types).
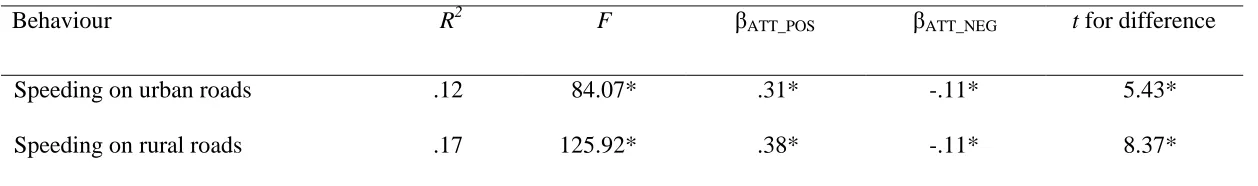
Predicting subsequent behaviour. In line with the analytical procedure used in the previous two studies, two multiple regressions were conducted to test the potential bi-dimensional relationships between attitudes and subsequent behaviour. One regression
subsequent speeding behaviour on urban roads and 17% of the variance in subsequent speeding behaviour on rural roads. On both road types, the positive and negative attitude dimensions were both independent predictors of subsequent speeding behaviour and the positive dimension had a significantly larger beta weight.
In order to rule out the possibility that the observed relationship between bi-dimensional attitudes and subsequent behaviour was attributable to a mere question-behaviour effect (i.e., the mere measurement of participants’ attitudes causing them to behave in an
attitude-congruent manner), we used standard formulae to convert the R2 values from the above reported regressions to Cohen’s ds (see Borenstein, Hedges, Higgins, & Rothstein, 2009; Cohen, 1988). We then compared these standardised measures of effect size with the Cohen’s
d value obtained from the most recent meta-analysis in the literature of studies (k=33) testing the question behaviour effect (see Rodrigues, O’Brien, French, Gildewell, & Sniehotta, 2014). The R2 values from the above reported regressions yielded Cohen’s ds of 0.72, for speeding on urban roads, and 0.91, for speeding on rural roads. Compared with the Cohen’s d
found by Rodrigues et al. (2014) for the question-behaviour effect (d = 0.09), these effect sizes are 8.00 and 10.11 times higher, respectively.
Discussion
attitude-congruent manner. Also, in line with hypothesis 2, the positive dimension of attitude was a significantly better predictor of subsequent speeding behaviour than was the negative dimension. The implications of these findings for understanding the motivation of behaviour and the development of behaviour-change interventions are discussed in the next section.
General Discussion
The principal aim of this research was to test the potential bi-dimensional relationships between attitudes, on the one hand, and behavioural intentions and subsequent behaviour, on the other. Consistent with previous research showing that attitudes are bi-dimensional
constructs (e.g., Conner et al., 2002), all three studies showed that evaluations of positive and negative behavioural outcomes were highly independent. In study 1, principal components analysis showed that the positive and negative attitude dimensions were well-represented by two orthogonal factors. Additionally, the two scales measuring the positive and negative attitude dimensions were correlated substantially less than r = 0.70 (i.e., the established criterion for demonstrating independence; Tabachnick & Fidell, 1996). Similarly, in studies 2 and 3, the single items measuring the positive and negative dimensions of attitude were correlated substantially less than r= 0.70. More importantly, all three studies supported our primary hypothesis. In study 1, both the positive and negative dimensions of attitude independently predicted students’ intentions to binge-drink. Identical results were found in study 2 when we predicted students’ intentions eat a high saturated-fat diet and smoke cigarettes in addition to their intentions to binge-drink. The findings also held in study 3 when we predicted subsequent speeding behaviour on two separate road types, in a national, non-student sample of drivers. The findings were therefore replicated across different target behaviours and samples, and across different dependent measures that are commonly
measures used in study 1 and the single items used in studies 2 and 3 produced the same pattern of results. There was no evidence, therefore, that the single item measures used in studies 2 and 3 lacked reliability. Finally, as shown in study 3, the findings cannot be attributed to the mere measurement of attitudes causing the participants’ to behave in an attitude-congruent manner. More specifically, the observed effect sizes for the relationships between bi-dimensional attitudes, on the one hand, and behaviour, on the other were at least eight times larger than what is typically produced by a question-behaviour effect (Rodrigues et al., 2014). Overall, this research reliably demonstrates that attitudes are bi-dimensional predictors of behavioural intentions and behaviour.
The findings therefore extend previous research into intention and attitude-behaviour relationships, in which attitudes have been treated as unidimensional constructs (e.g., McEachan et al., 2011). This includes research into attitudinal ambivalence, in which the positive and negative dimensions of attitude have not been treated as independent variables but as indicators of attitude strength that moderate the effects of unidimensional attitudes on both behavioural intentions and subsequent behaviour (see Conner & Sparks, 2002). Additionally, given that attitudes are proximal determinants of behaviour and constitute the evaluative information that is necessary to initiate action (e.g., Ajzen, 1985; Fishbein & Ajzen, 1975), the findings extend previous research in which positive and negative expectancy beliefs have been shown to independently predict behaviour (e.g., Anderson et al., 2002; Fromme et al., 1997; Lawton et al., 2007; Lee et al., 1999). More specifically, the findings imply that positive and negative evaluations operate independently to motivate health-risk behaviours.
our second, supplementary hypothesis and they are also consistent with the general pattern of findings from studies of expectancy beliefs, in which positive behavioural expectancies have been found to be more predictive of health-risk behaviours than negative behavioural
expectancies (e.g., Anderson et al., 2002; Fromme et al., 1997; Lawton et al., 2007 [study 2]; Lee et al., 1999; but see Lawton et al., 2007 [study 1]). The theoretical rationale for the observed asymmetrical relationships between the positive and negative dimensions of attitude, on the one hand, and health-risk behaviours, on the other, was derived from the positivity bias (e.g., Boucher & Osgood, 1969) and the related positivity offset principle (e.g., Cacioppo et al., 1997), which refer to the tendency for individuals to pay more weight to positive outcomes than negative outcomes in situations where the positives are the most likely occurrence or the negatives are uncertain or distal (Cacioppo et al., 1997; Peeters & Czapinski, 1990). The present research lends new support to these biases by showing that the positive (versus negative) dimension of attitude has more utility in the prediction of
behaviours that are typically characterised by highly probable and immediate positive consequences, and less-guaranteed or more delayed negative consequences.
We also hypothesised that the positive dimension of attitude would be a better predictor of health-risk behaviours than would the negative dimension because it is likely to be
accessibility) mediate the asymmetrical relationships that were observed in this research. On a related point, it is worth noting that the observed asymmetrical relationships between bi-dimensional attitudes and health-risk behaviours might not generalise to behaviours that follow different reinforcement schedules (e.g., Zunft et al., 1999). For example, many behaviours (e.g., beginning a program of exercise) are characterised by short-term, relatively guaranteed, negative consequences (e.g., fatigue, exhaustion) and longer term positive consequences (e.g., increased fitness, weight loss). The negative dimension of attitude might therefore be a better predictor of these behaviours than the positive dimension. However, it is also worth noting that the sample used in study 3 had recently received a powerful negative outcome for performing a health-risk behaviour (i.e., a fixed penalty notice from the Police for speeding within the last four months), and yet we still found that the positive dimension of attitude was more predictive of subsequent behaviour than was the negative dimension. This raises the alternative possibility that the asymmetrical relationships observed in this research might also generalise to behaviours that are associated with negative consequences to a greater extent than positive consequences. Given the overwhelming
research evidence supporting the negativity bias however (e.g., Baumeister et al., 2001), it is more likely that receiving a negative outcome for performing a health-risk behaviour is simply not sufficient to over-ride the accumulative effects of relatively guaranteed, frequent and immediate positive outcomes on people’s attitudes and their concomitant relationship with behaviour. Further research could usefully test the bi-dimensional attitude–behaviour relationship across different classes of behaviour and the extent to which negative outcomes can reverse the asymmetrical relationships observed in this study.
negative dimensions of attitude need targeting by behaviour-change interventions (e.g., educational campaigns). However, the finding that the positive dimension of attitude was a better predictor of health-risk behaviours than was the negative dimension implies that interventions focusing on the reduction of health-risk behaviours should primarily discourage positive evaluations of desirable outcomes. For example, a potentially positive outcome that is commonly associated with speeding is: “it will get me to my destination quicker” (e.g., Elliott et al., 2005). In reality, however, travelling times are not reduced substantially by speeding, even on long journeys where road and traffic conditions tend to reduce any time savings. Educational interventions could deliver this message to drivers with a view to reducing the positivity that is associated with this particular outcome of speeding. Health interventions should also seek to undermine the perceived positive outcomes of binge-drinking (e.g., increased self-confidence), smoking (e.g., socialisation opportunities) and unhealthy eating (e.g., pleasant taste) in a similar way. This approach is in direct contrast to the one traditionally taken by health interventions, in which efforts to change risky
behaviours typically focus on negative outcomes (e.g., increased risk of liver disease, coronary heart disease, cancer or traffic crashes). The long history of such fear inducing messages having rather limited effects on behaviour is consistent with the asymmetrical relationships observed in this research.
In conclusion, this research supports the bi-dimensional conceptualisation of attitudes and shows for the first time that attitudes are bi-dimensional predictors of both behavioural intentions and subsequent behaviour. However, whilst both the positive and negative
dimensions of attitude independently predict health-risk behaviours, the positive dimension is a better predictor. Interventions to reduce health-risk behaviours should target both
behaviour other than health-risk behaviours (e.g., health-promotion behaviours). Further research is also needed to identify mediators of the asymmetrical relationships between bi-dimensional attitudes and behaviour (e.g., attitude strength).
References
Ajzen, I. (1985). From intentions to actions: A theory of planned behavior. In J. Kuhl & J. Beckmann (Eds.), Action control: From cognition to behavior (pp. 11-39). Berlin: Springer-Verlag.
Anderson, C. B., Pollak, K. I., & Wetter, D. W. (2002). Relations between self-generated positive and negative expected smoking outcomes and smoking behavior: An
exploratory study among adolescents. Psychology of Addictive Behaviors, 16, 196-204. DOI: 10.1037/0893-164X.16.3.196.
Baumeister, R. F., Bratslavsky, E., Finkenauer, C., & Vohs, K. D. (2001). Bad is stronger than good. Review of General Psychology, 5, 323-370. DOI:
10.1037//1089-2680.5.4.323.
Borenstein, M., Hedges, L. V., Higgins, J. P. T., & Rothstein, H. R. (2009). Introduction to meta-analysis. Chichester: Wiley.
Boucher, J., & Osgood, C. E. (1969). The polyanna hypothesis. Journal of Verbal Learning and Verbal Behavior, 8, 1-8. DOI: 10.1016/S0022-5371(69)80002-2
Cacioppo, J. T., Gardner, W. L., & Berntson, G. G. (1997). Beyond bipolar
conceptualizations and measures: The case of attitudes and evaluative space.
Personality and Social Psychology Review, 1, 3-25. DOI: 10.1207/s15327957pspr0101_2.
Conner, M., Kirk, S. F., Cade, J. E., & Barrett, J. H. (2001). Why do women use dietary supplements? The use of the theory of planned behaviour to explore beliefs about their use. Social Science and Medicine, 52, 621-633. DOI: 10.1016/S0277-9536(00)00165-9. Conner, M., & Sparks, P. (2002). Ambivalence and attitudes. European Review of Social
Psychology, 12, 37-70. DOI:10.1080/14792772143000012.
Conner, M., Sparks, P., Povey, R., James, R., Shepherd, R., & Armitage, C. J. (2002). Moderator effects of attitudinal ambivalence on attitude-behaviour relationships.
European Journal of Social Psychology, 32, 705-718. DOI: 10.1002/ejsp.117.
Doll, J., & Ajzen, I. (1992). Accessibility and stability of predictors in the theory of planned behavior. Journal of Personality and Social Psychology, 63, 754-765.
DOI:10.1037/0022-3514.63.5.754.
Elliott, M. A. (2012). Testing the capacity within an extended theory of planned behaviour to reduce driving violations. Transportmetrica, 8, 321-343. DOI:
10.1080/18128602.2010.502548.
Elliott, M. A., & Ainsworth, K. (2012). Predicting university undergraduates’ binge-drinking behavior: A comparative test of the one- and two-component theories of planned behavior. Addictive Behaviors, 37, 92-101. DOI: 10.1016/j.addbeh.2011.09.005. Elliott, M. A., Armitage, C. J., & Baughan, C. J. (2003). Drivers’ compliance with speed
limits: An application of the theory of planned behavior. Journal of Applied Psychology, 88, 964-972. DOI:10.1037/0021-9019.88.5.964.
Elliott, M. A., Armitage, C. J., & Baughan, C. J. (2005). Exploring the beliefs underpinning drivers’ intentions to comply with speed limits. Transportation Research Part F, 8, 459-479. DOI: 10.1016/j.trf.2005.08.002.
Elliott, M. A., Armitage, C. J., & Baughan, C. J. (2007). Using the theory of planned
46, 69-90. DOI: 10.1348/014466605X90801.
Elliott, M. A., & Thomson, J. A. (2010). The social cognitive predictors of offending drivers’ speeding behavior. Accident Analysis and Prevention, 42, 1595-1605. DOI:
10.1016/j.aap.2010.03.018.
Elliott, M. A., Thomson, J. A., Robertson, K., Stephenson, C., & Wicks, J. (2013). Evidence that changes in social cognitions predict changes in self-reported driver behavior: Causal analyses of two-wave panel data. Accident Analysis and Prevention, 50, 905-916. DOI: 10.1016/j.aap.2012.07.017.
Fishbein, M. (1963). An investigation of the relationship between beliefs about an object and the attitude toward that object. Human Relations, 16, 233-240. DOI:
10.1177/001872676301600302.
Fishbein, M., & Ajzen, I. (1975). Belief, Attitude, Intention and Behavior: An Introduction to Theory and Research. Reading, MA: Addison-Wesley.
Fromme, K., Katz, E. C., & Rivet, K. (1997). Outcome Expectancies and Risk-Taking Behavior. Cognitive Therapy and Research, 21, 421-442. DOI:
10.1023/A:1021932326716.
Glasman, L. R., Albarracin, D. (2006). Forming attitudes that predict future behavior: A meta-analysis of the attitude-behavior relation. Psychological Bulletin, 132, 778-822. DOI: 10.1037/0033-2909.132.5.778
Hart, T. C., Rennison, C. M., & Gibson, C. (2005). Revisiting respondent “fatigue bias” in the national crime victimization survey. Journal of Quantitative Criminology, 21, 345-363. DOI: 10.1007/s10940-005-4275-4.
primary care? A study of fruit and vegetable consumption. Social Science & Medicine, 60, 2383-2391. DOI: 10.1016/j.socscimed.2004.10.014.
Kaplan, K. J. (1972). On the ambivalence-indifference problem in attitude theory and measurement: A suggested modification of the semantic differential technique.
Psychological Bulletin, 77, 361-372. DOI: 10.1037/h0032590
Kraus, S. J. (1995). Attitudes and the prediction of behavior: A meta-analysis of the empirical literature. Personality and Social Psychology Bulletin, 21, 58-75. DOI:
10.1177/0146167295211007.
Langer, E. J. (1975). The illusion of control. Journal of Personality and Social Psychology, 32, 311-328. DOI: 10.1037/0022-3514.32.2.311.
Lawton, R., Conner, M., & Parker, D. (2007). Beyond cognition: Predicting health risk behaviors from instrumental and affective beliefs. Health Psychology, 26, 259-267. DOI: 10.1037/0278-6133.26.3.259.
Lee, N. K., Greely, J., & Oei, T. P. S. (1999). The relationship of positive and negative alcohol expectancies to patterns of consumption of alcohol in social drinkers. Addictive Behaviors, 24, 359-369. DOI: 10.1016/S0306-4603(98)00091-4.
Luchins, A. S. (1957). Primacy-recency in impression formation. In C. Hovland (Ed.), The
order of presentation in persuasion (pp. 33-61). New Haven, CN: Yale University Press.
McEachan, R. R. C., Conner, M., Taylor, N. J., & Lawton, R. J. (2011). Prospective prediction of health-related behaviours with the theory of planned behaviour: a meta-analysis. Health Psychology Review, 5, 97-144. DOI: 10.1080/17437199.2010.521684. McKenna, F. P. (1993). It won’t happen to me: Unwarranted optimism or illusion of control?
Osgood, C. E., Suci, G. J., & Tanenbaum, P. H. (1957). The measurement of meaning. Urbana, IL: University of Illinois Press.
Paulhus, D. L. (2002). Socially desirable responding: The evolution of a construct. In H. Braun, D.N. Jackson, & D.E. Wiley (Eds.), The role of constructs in
psychological and educational measurement (pp. 67-88). Hillsdale, NJ: Lawrence Erlbaum Associates.
Peeters, G., & Czapinski, J. (1990). Positive-negative asymmetry in evaluations: The
distinction between affective and informational effects. In W. Stroebe & M. Hewstone (Eds.), European review of social psychology (Vol. 1, pp. 33-60). New York, NY: Wiley.
Rodrigues, A. M., O’Brien, N., French, D. P., Gildewell, L., & Sniehotta, F. F. (2014). The question-behavior effect: Genuine effect or spurious phenomenon? A systematic review of randomized controlled trials with meta analyses. Health Psychology, DOI:
10.1037/hea0000104.
Rozin, P., & Royzman, E. B. (2001). Negativity bias, negativity dominance and contagion.
Personality and Social Psychology Review, 5, 296-320. DOI:10.1207/S15327957PSPR0504_2.
Scottish Government (2013). Higher education students and qualifiers at Scottish institutions 2011-12. Retrieved 28 March 2013 from: http://www.sfc.ac.uk.
Tabachnick, B. G., & Fidell, L. S. (1996). Using multivariate statistics (third edition). New York, NY: HarperCollins.
Thompson, S. C. (1999). Illusions of control: How we overestimate our personal influence.
Current Directions in Psychological Science, 8, 187-190. DOI: 10.1111/1467-8721.00044.
(attitudinal) ambivalence. In R. E. Petty & J. A. Krosnick (Eds.), Attitude strength: Antecedents and consequences (pp. 361-386). Mahwah, NJ: Lawrence Erlbaum. Thurstone, L. L. (1928). Attitudes can be measured. American Journal of Sociology, 33,
529-554. DOI: 10.1086/214483.
Wallace, D. S., Paulson, R. M., Lord, C. G., Bond, C. F. (2005). Which behaviors do attitudes predict? Meta-analyzing the effects of social pressure and perceived difficulty. General Review of Psychology, 9, 214-227. DOI: 10.1037/1089-2680.9.3.214
Footnotes
1
To further ensure that the sampled gender imbalance did not unduly influence the findings of this study, we tested whether gender moderated the relationships between the positive and negative dimensions of attitude, on the one hand, and behavioural intentions, on the other. More specifically, we re-ran the regression analysis presented in table 3 but in addition to the positive and negative attitude dimensions we included gender and the two-way ‘gender X positive attitude’ and ‘gender X negative attitude’ interactions as predictors of intentions to binge-drink. Neither interaction was statistically significant.
2
The data did not support the separation of the instrumental (e.g., positive, beneficial, rewarding) and affective (e.g., fun, pleasant, enjoyable) attitudes items. As the principal components analysis reported in the main text shows, all of the items designed to measure the positive dimension of attitude converged onto a single factor, regardless of whether they tapped instrumentality or affect (see table 1). Similarly, all of the items used to measure the negative dimension of attitude converged on to a single factor. Additionally, we re-ran the main analysis for study 1 (see table 3) using just the instrumental items as independent predictors of behavioural intentions, and again using just the affective items. The pattern of findings was the same.
3
As in study 1 (see footnote 1), we re-ran the main analyses (see table 5) but in
addition to the positive and negative attitude dimensions we included gender and the two-way ‘gender X positive attitude’ and ‘gender X negative attitude’ interactions as predictors of behavioral intentions. Neither interaction was statistically significant for any behaviour.
4
5
Table 1. Principal components analysis (varimax rotation) of the items measuring the positive and negative dimensions of attitude (study 1)
Construct/items Factor
I II
Attitude (Positive Dimension)
Think only about the positive outcomes associated with binge-drinking; how positive are they? .83 -.23
Think only about the beneficial outcomes associated with binge-drinking; how beneficial are they? .89 -.09
Think only about the rewarding outcomes associated with binge-drinking; how rewarding are they? .88 .04
Think only about the fun outcomes associated with binge-drinking; how fun are they? .91 -.02
Think only about the pleasant outcomes associated with binge-drinking; how pleasant are they? .88 -.12
Think only about the enjoyable outcomes associated with binge-drinking; how enjoyable are they? .75 -.02
Attitude (Negative Dimension)
Think only about the negative outcomes associated with binge-drinking; how negative are they? -.22 .45
Think only about the harmful outcomes associated with binge-drinking; how harmful are they? -.13 .67
Think only about the unrewarding outcomes associated with binge-drinking; how unrewarding are they? -.05 .69
Think only about the boring outcomes associated with binge-drinking; how boing are they? .00 .62
Think only about the unpleasant outcomes associated with binge-drinking; how unpleasant are they? -.04 .74
Think only about the unenjoyable outcomes associated with binge-drinking; how unenjoyable are they? .08 .64
% variance explained 37.52 21.35
Table 2. Descriptive statistics and correlations for binge-drinking (study 1)
Variable 1. 2. 3. M SD Range No. of items
in scale
Cronbach’s α
1. Behavioural Intention – .59** -.27** 5.61 1.32 1 to 9 4 .92
2. Attitude (Positive Dimension) – -.17* 5.99 1.70 1 to 9 6 .92
3. Attitude (Negative Dimension) – 6.90 1.24 1 to 9 6 .73
Table 3. Multiple linear regression predicting intentions to binge-drink from the positive and negative dimensions of attitude (study 1)
Variables R2 F β t for difference
Attitude (Positive Dimension) .38 27.76** .57**
2.17*
Attitude (Negative Dimension) -.17*
Table 4. Correlations and descriptive statistics for binge-drinking and eating a high saturated fat diet (study 2)
Behaviour/Variables 1. 2. 3. M SD Range
Binge-Drinking
1. Behavioural Intention – .69* -.38* 4.87 2.88 1 to 9
2. Attitude (Positive Dimension) – -.31* 5.62 2.77 1 to 9
3. Attitude (Negative Dimension) – 5.19 2.85 1 to 9
Eating a high saturated-fat diet
1. Behavioural Intention – .56* -.30* 6.07 2.08 1 to 9
2. Attitude (Positive Dimension) – -.26* 6.45 2.11 1 to 9
3. Attitude (Negative Dimension) – 3.16 2.00 1 to 9
Smoking
1. Behavioural Intention – .71* -.46* 2.33 2.43 1 to 9
2. Attitude (Positive Dimension) – -.33* 2.90 2.72 1 to 9
3. Attitude (Negative Dimension) – 7.20 2.72 1 to 9
Table 5. Multiple linear regressions predicting intentions to binge-drink, eat a high saturated fat diet and smoke from the positive and negative dimensions of attitude (study 2)
Behaviour R2 F βATT_POS βATT_NEG t for difference
Binge-drinking .51 99.04* .64* -.18* 5.46*
Eating a high saturated-fat diet .34 48.90* .52* -.17* 3.37*
Smoking .55 117.22* .62* -.25* 4.46*
Table 6. Correlations and descriptive statistics for speeding on urban roads and rural roads (study 3)
Variable 1. 2. 3. M SD Range
Speeding on urban roads
1. Subsequent Behaviour – .33* -.18* 3.14 1.99 1 to 9
2. Attitude (Positive Dimension) – -.23* 1.83 1.57 1 to 9
3. Attitude (Negative Dimension) – 7.47 2.31 1 to 9
Speeding on rural roads
1. Subsequent Behaviour – .40* -.19* 3.12 2.04 1 to 9
2. Attitude (Positive Dimension) – -.24* 2.11 1.82 1 to 9
3. Attitude (Negative Dimension) 7.32 2.31 1 to 9
Table 7. Multiple linear regressions predicting subsequent speeding behaviour on urban and rural roads from the positive and negative dimensions of attitude (study 3)
Behaviour R2 F βATT_POS βATT_NEG t for difference
Speeding on urban roads .12 84.07* .31* -.11* 5.43*
Speeding on rural roads .17 125.92* .38* -.11* 8.37*