City, University of London Institutional Repository
Citation
: Forth, J. ORCID: 0000-0001-7963-2817, Bewley, H. and Bryson, A. (2006).
Small and Medium-sized Enterprises. London, UK: Department of Trade and Industry.This is the published version of the paper.
This version of the publication may differ from the final published
version.
Permanent repository link:
http://openaccess.city.ac.uk/20889/Link to published version
:
Copyright and reuse:
City Research Online aims to make research
outputs of City, University of London available to a wider audience.
Copyright and Moral Rights remain with the author(s) and/or copyright
holders. URLs from City Research Online may be freely distributed and
linked to.
Small and Medium-sized
Enterprises
Findings from the 2004 Workplace
Employment Relations Survey
Contents
List of figures vi
List of tables vii
Acknowledgements viii
Executive summary x
1 Introduction 1
Introduction 1
Existing research on employment relations in SMEs 1 What can WERS 2004 contribute? 3
Identifying workplaces and employees that belong to SMEs 4 Approach of the report 5
Analytical issues and conventions 7
2 A profile of workplaces belonging to SMEs 8
Introduction 8 Workplace size 8 Industrial activity 9
Location within the wider organization 9 Ownership 11
Age of workplace 12
The competitive environment 13 Workforce composition 15 Summary and conclusions 18
3 The management of employees 20
Introduction 20
Who manages employees? 20
What tasks do employment relations managers perform? 22 Employment relations advice from beyond the workplace 24 Strategic employment relations 25
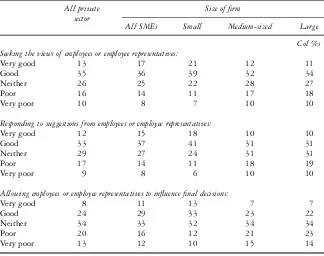
Employee involvement in decision-making 26 Summary and conclusions 30
4 Recruitment, training and work organization 32
Introduction 32
Recruitment and selection 32 Labour turnover 34
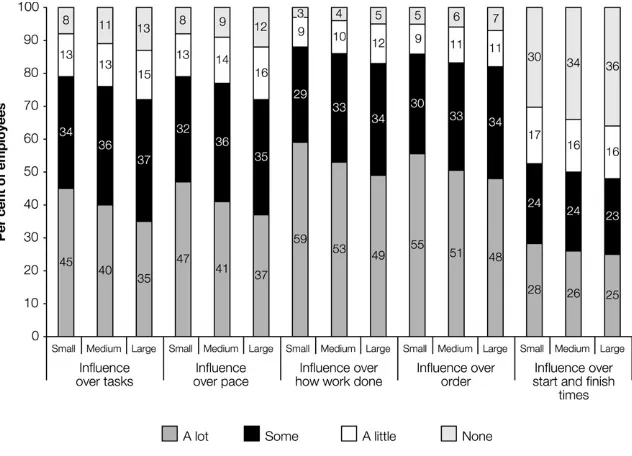
Contractual status 35 Off-the-job training 36 Performance appraisals 38 Work organization 38 Job influence and autonomy 39 Work intensity 40
Employee well-being 41 The non-employed workforce 41 Summary and conclusions 42
5 Information and consultation 44
Introduction 44
Management attitudes 45
Union membership and representation 46 Other forms of employee representation 49
Summary of arrangements for employee representation 50 Direct forms of voice 50
Extent of information sharing 53 Summary and conclusions 56
6 The determination of pay and other terms and conditions 57
Introduction 57 Pay determination 57
Pay reviews and settlements 60 Factors affecting pay levels 60 Variable payments 61
Pay rates and pay satisfaction 62
The role of employee representation in determining terms and conditions 64
Redundancies 64
Consultation over health and safety matters 66 Summary and conclusions 66
7 Conflict and dissonance 67
Introduction 67
The state of management-employee relations 68 Collective disputes 69
Grievances and disciplinary matters 70 Other potential indicators of discontent 75 Summary and conclusions 78
8 Equality, diversity and work-life balance 79
Introduction 79
Promoting equality of opportunity 79 Monitoring equal opportunities practices 81 Perceptions of fair treatment 82
Flexible working arrangements 83
Arrangements to support employees with caring responsibilities 84 Working hours 87
Responsibility for managing work-life balance 88 Summary and conclusions 89
9 Summary and conclusions 91
Appendix A: The 2004 Workplace Employment Relations
Survey (WERS 2004) 100
The nature and conduct of WERS 2004 100 Data used in this report 102
Publications and data files 102
Appendix B: Sampling errors 103
Notes 105
Bibliography 109
Figures
2.1 Location within the wider organization 11 3.1 Involvement of employees in introducing and implementing
change 29
4.1 Job influence 40
5.1 Regular information sharing 54
5.2 Employees’ perceptions about managers’ ability to keep them
informed 55
6.1 Employees’ satisfaction with pay 63
6.2 Health and safety consultation arrangements 65 7.1 The state of management-employee relations 68 8.1 Management understanding of employees having to meet
Tables
2.1 Industrial activity 10
2.2 Factors critical to competitive success 15
3.1 Family ownership and management 21
3.2 Job responsibilities of employment relations managers 23
3.3 Strategic people management 26
3.4 Changes introduced by management in the last two years 28 3.5 Employee ratings of managerial responsiveness 30 4.1 Recruitment channels used in filling vacancies 33
4.2 Important factors in recruitment 34
4.3 Topics covered in training for core employees 37
4.4 Employee well-being 41
5.1 Managers’ attitudes towards trade unions 45 5.2 Arrangements for employee representation 48 5.3 Arrangements for direct communication 52 6.1 Incidence and coverage of collective bargaining 58
6.2 Pay determination methods 59
6.3 Factors explaining differences in pay levels among full-time core
employees 61
6.4 Incidence of variable payment schemes 62
6.5 Distribution of gross hourly pay 63
7.1 Collective and individual disputes 70
7.2 Grievance procedures 73
7.3 Disciplinary procedures 74
7.4 Employees’ trust in workplace managers 77 8.1 Topics covered by equal opportunities policy 80
8.2 Monitoring and review activities 82
8.3 Perceived availability of flexible working arrangements,
as reported by employees 83
8.4 Perceived availability of paid parental leave and forms of
emergency leave, as reported by employees 86
9.1 Employee needs index 87
B1 Approximate standard errors for estimates derived from the
WERS 2004 Cross-Section Survey of Managers 104 B2 Approximate standard errors for estimates derived from the
Acknowledgements
The 2004 Workplace Employment Relations Survey (WERS 2004) is a truly collaborative venture. The study is jointly sponsored by the Department of Trade and Industry (DTI), the Advisory, Conciliation and Arbitration Service (Acas), the Economic and Social Research Council (ESRC) and the Policy Studies Institute (PSI). Additional funds from the Small Business Service facilitated the extension of the survey to include workplaces with 5–9 employees.
The Steering Committee is drawn from representatives of the sponsoring bodies. Mark Beatson of the DTI initially chaired the Committee in his former role as Director of the Employment Market Analysis and Research (EMAR) Branch. He was succeeded by Grant Fitzner in April 2003. Another change in membership of the Steering Committee was the departure of David Guy of the ESRC, succeeded by Paul Rouse. Long-serving members have been Andrew Wareing (Acas), Professor Keith Whitfield (ESRC), and Bernard Carter (DTI). A grant from the Nuffield Foundation, together with the Wertheim Fellowship from Harvard Law School and the National Bureau of Economic Research (NBER), has facilitated PSI’s involvement in the study. Jim Skea, the former Director of PSI, was an original member of the committee and has been suc-ceeded by Malcolm Rigg. John McQueeney, Head of Research in EMAR, DTI, has also attended a number of Steering Committee meetings and has provided valuable support to the DTI Research Team throughout the course of the study. The WERS Research Team is drawn from three of the four sponsoring bodies. The team comprises Barbara Kersley (Head of the WERS Research Team, DTI), Carmen Alpin (DTI), John Forth (National Institute of Economic and Social Research and on contract to DTI), Alex Bryson (PSI), Helen Bewley (PSI), Gill Dix (Acas) and Sarah Oxenbridge (Acas). It is noteworthy that Carmen Alpin provided maternity leave cover for Ms Kersley during a critical design phase of the survey.
The Sponsors are indebted to the teams of academic researchers who assisted in the development of specific question areas. The overall exercise was success-fully led by Professor Keith Whitfield. Particular thanks go to Professor Robert Blackburn, Kingston University, and Professor David Storey, University of Warwick, who considered the extension of the coverage of the survey to include workplaces with 5–9 employees. Outside of the specialist teams, other academic researchers, lawyers and government officials also made valuable contributions to specific areas of the survey.
the team at NatCen from June 2003 until August 2004. His knowledge and experience of working on the 1998 WERS proved invaluable to the exercise. Joanna Chaplin ably took up the reigns after Stephen left NatCen and was assisted by a strong team of researchers: Jane Mangla, Susan Purdon, Rachel Breman, and Colin Airey. They were backed up by a first-rate team of inter-viewers, fieldwork managers and data processors, under the overall supervision of Sandra Laver. The Sponsors would like to thank the NatCen team for their commitment to the execution of the survey.
In respect of this particular report, thanks go to Stella Mascarenhas-Keyes (Small Business Service), Gill Dix (Acas) and Professor Robert Blackburn (Kingston University) for providing valuable comments on the first draft. We are also grateful to Michael Clary (Department of Trade and Industry) and Paula Maratos (Small Business Service) for providing statistics on the incidence of SMEs and on the coverage of SME workplaces and employees within WERS. Finally, and most importantly, the Sponsors and the Research Team would like to thank the managers, employees and employee representatives who gave freely of their time to participate in this study. Without their co-operation, the study, and a publication of this kind, would not be possible.
The authors write in a personal capacity and their views do not necessarily reflect those of the sponsoring bodies.
Executive Summary
Introduction
There is little quantitative data on the employment practices of small and medium-sized firms (SMEs), despite the fact that 94 per cent of all private sector firms in the UK have less than 250 employees. This study uses the nationally representative 2004 Workplace Employment Relations Survey (WERS 2004) to describe employment practices in private sector workplaces belonging to SMEs. As both managers and employees were surveyed within workplaces, this report is able to compare employees’ views of the employment relationship with those of their managers. It also makes comparisons between the practices of SMEs and those of larger firms.
The management of employees
In SMEs it was much more common for employment relations to be dealt with by an owner-manager than a personnel specialist. SME managers with respon-sibility for employment matters were less likely to have a formal qualification in personnel management or a related subject than managers working in this area in large firms. Nonetheless, they tended to have more career experience of the personnel role than managers with responsibility for employment relations in large firms. Managers responsible for personnel matters in SME workplaces spent less time on employment relations, but carried out a wider range of tasks than those in an equivalent position in large firms. SMEs made greater use of external advice on employment relations than workplaces which were part of large firms.
Recruitment, training and work organization
was not investigated in the survey. Team-working arrangements, problem-solving groups and functional flexibility were less developed in SMEs than in large firms, but this appeared to be determined by workplace size to a large degree.
Information and consultation
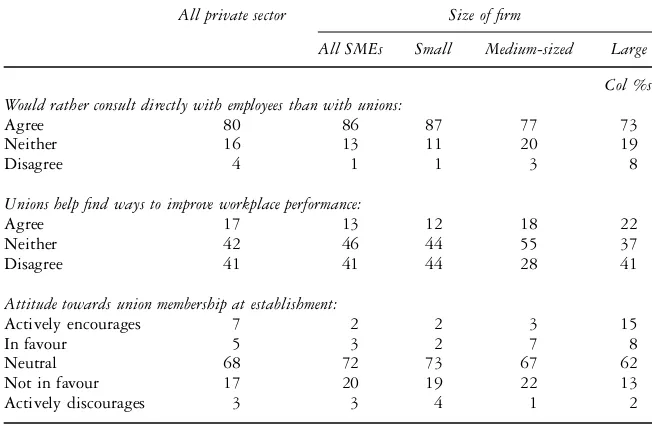
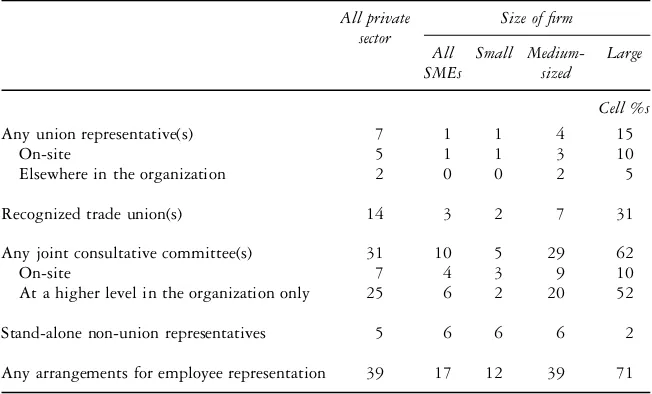
Union representation was unusual in workplaces which were part of SMEs, with direct communication with employees the more common arrangement. SMEs were less likely to supply employees with information on a regular basis than large firms and owner-managers were particularly unlikely to share financial information. Consistent with this, employees were less likely to report that managers were good at keeping them informed on financial matters where they worked for a small firm which was run by an owner-manager. However, in contrast to employees in medium-sized and large firms the majority of employees in small firms reported that managers at their workplace were good or very good at keeping employees informed about changes to the running of the organiza-tion, changes in staffing and changes to their job. Managers of small firms were less positive about unions than managers in large firms and union membership was lower among employees who worked for SMEs than among employees who worked for large firms.
The determination of pay and other terms and conditions
Unions were rarely involved in pay-setting in SMEs. Pay was set unilaterally by management for over four-fifths of employees who worked for SMEs, whilst one tenth of employees of SMEs negotiated their pay on an individual basis with managers. Variable payment systems were less common in SME workplaces than in large firms, although they were still used in a significant proportion of SMEs. Pay appeared to be higher in medium-sized and large firms than in small firms, but satisfaction with pay was lower in large firms, perhaps because these firms had greater pay dispersion. It was less common for managers in SMEs to engage in joint regulation of non-pay terms and conditions, or to consult over redundancies than large firms.
Conflict and dissonance
Grievances were most likely to have arisen in medium-sized firms, whilst managers were least likely to have used disciplinary sanctions over the past year in small firms. Large firms were much more likely to have formal procedures in place for resolving individual disputes. Nevertheless, the majority of workplaces in even the smallest firms had these procedures in place. The level of trust between managers and employees, and the rating of management-employee relations appeared to be highest in the smallest firms. The rate of absenteeism was lowest in workplaces which belonged to small firms, whilst voluntary resignations were lowest in SMEs.
Equality, diversity and work-life balance
Workplaces in small firms were less likely to have a formal equal opportunities policy in place than workplaces which were part of larger firms. Although it was unusual for SMEs to have reviewed a range of activities to identify dis-criminatory practices, this was also rare in workplaces which belonged to large firms. Workplaces within small firms were less likely to have practices in place to support employees with caring responsibilities than those which were part of larger firms. Despite the fact that managers in SME workplaces were more likely to believe that it was up to employees to balance their work and family responsibilities than those who worked for large firms, employees who worked for smaller firms were more likely to expect that they would have access to flexible working arrangements if required. Employees of SMEs were also more likely than those who worked for large firms to find managers understanding of their responsibilities outside of work and to report that managers treated employees fairly.
Employee attitudes
Managers in small firms were more likely than those in large firms to report that they involved employees in decision-making when making changes at the workplace. Consistent with this, employees who worked for small firms believed that they had a greater degree of influence over the final decisions made by managers. Employees of smaller firms were also more likely to believe that they had job autonomy, influence and security, and reported lower work intensity and higher general well-being than employees who worked for larger firms. In addition, they were more likely to feel committed to the organization.
About the survey
WERS 2004 consisted of interviews with 2,295 managers, 984 union and non-union employee representatives and 22,451 employees in workplaces with 5 or more employees. In addition to this, a Financial Performance Questionnaire was completed by managers in 1,070 of these workplaces. The cross-section survey was supplemented by a panel survey, in which 938 workplaces with 10 or more employees originally surveyed in 1998 were revisited. Fieldwork was carried out between February 2004 and April 2005. WERS 2004 provides a sample of 621 workplaces and 4,683 employees located in private sector SMEs. The WERS 2004 data is available from the Data Archive at the University of Essex (http://www.data-archive.ac.uk). A free publication, reporting the First Findings from the survey, is available at:http://www.dti.gov.uk/files/file11423.pdf, whilst the full publication reporting the primary analysis,Inside the Workplace: Findings from the 2004 Workplace Employment Relations Survey,was published by Routledge in July 2006.
1
Introduction
Introduction
The significance of small and medium-sized private sector enterprises (SMEs) is often overlooked by analysts and commentators. Yet official statistics on the incidence of SMEs record that, at the beginning of 2004, there were 1.16 mil-lion private sector firms with fewer than 250 employees, representing 94 per
cent of all employers in the UK economy.1 These SMEs employed a total of
8.66 million employees (36 per cent of all employees in the UK) and they accounted for 47 per cent of private sector employers’ turnover. The numerical importance of SMEs is therefore apparent.
SMEs are also considered by many to be a vital part of a healthy economy because of the role they can play in the creation of jobs and the fostering of innovation, together with their perceived ability to adapt to rapidly changing market conditions. In addition, some maintain that they perform an ideological function in the modern economy by sustaining notions of competition and opportunity (Scase, 1995: 571–72). Others question the emphasis on SMEs, arguing instead that enterprise and entrepreneurship should be encouraged in all types of business and pointing to the role played by SMEs in job destruction (TUC, 2003). Nevertheless, their importance as a provider of employment is evident and, for this reason alone, SMEs are necessarily of interest to those concerned with employment relations.
Existing research on employment relations in SMEs
Until just a few years ago, it was common for researchers in the field to bemoan the limited extent of research on employment relations in SMEs (see, for example, Scase, 1995: 57–571; Wilkinson, 1999; Matlay, 1999). More recently, however, there appears to have been an increase in the quantity of research, and a broadening of the research agenda.
analyses took an opposing view of relations in small firms, arguing that they tended to feature autocratic styles of management which led to exploitation (Rainnie, 1989). But it was also argued that many managers of small firms had little choice but to adopt such an approach, since they were constrained by their economic dependence on large firms.
Such generalizations – both about the character of relations and the role of market forces in shaping them – are now criticized in favour of more nuanced accounts. These emphasize the tensions that arise, particularly for owner-managers, in maintaining control whilst also maintaining positive working relationships. But they have argued that ‘negotiation of the balance’ between these goals leads to contingent and fluid approaches to the management of employment relations (Moule, 1998; Ram and Edwards, 2003). This highlights the informal approach to employment relations that is still accepted to characterise much of the sector, whereby labour management is largely ‘‘emergent, flexible and loosely structured. . .there is an absence of informed professional HR management. . .
and contemporary and appropriate HR policies and practices are unlikely to be in place’’ (Marlow, 2005: 5). Yet even this may be set to change as legislation on specific aspects of the employment relationship, such as the handling of individual disputes, seeks to introduce greater formality in even the smallest of firms.
Despite the increasing number of studies that have emerged over the past decade, there remains little nationally-representative quantitative evidence on the nature of the employment relationship in small and medium-sized firms. There are a few notable exceptions (e.g. Matlay, 1999, 2002; Kitson and Wilkinson, 2003a) but the literature is dominated by in-depth, qualitative research of particular companies or industries. Its strength is therefore its abil-ity to depict the complexabil-ity and subtlety of employment relations in SMEs in particular circumstances. The drawback is the difficulty one has in extrapolating from these results to a wider population. The primary source of nationally-representative quantitative evidence on employment relations in Britain – the Workplace Employment Relations Survey (WERS) series – has historically been ignored because of its exclusion of smaller workplaces (which are more common in small firms) and its resultant focus on institutions and procedures.
WERS began to offer new opportunities in 1998 when the fourth survey in the series expanded its scope to include workplaces with 10–24 employees for the first time. Substantial alterations were also made to the survey instruments. The management questionnaire was revised to include more questions on issues such as recruitment, training, work organization and workforce flexibility, and a new survey of employees was introduced, thereby providing a wealth of data on job quality and employees’ experiences of work. The expansion in the sample meant that, although the population of workplaces represented by the survey still only accounted for 13 per cent of all workplaces belonging to SMEs, it accounted for three-fifths (61 per cent) of all employees working in SMEs. A chapter in the 1998 sourcebook was devoted to employment relations in smaller firms (Cullyet al., 1999: 251–74). Even so, only a small number of papers presenting secondary analysis followed (Gilmanet al., 2002; Harriset al., 2004; Bacon and Hoque, 2005; Hoque and Bacon, 2006).
What can WERS 2004 contribute?
The fifth Workplace Employment Relations Survey (WERS 2004) further enhances the opportunities for quantitative research on smaller firms. Following consultation with a team of academic experts on employment relations in SMEs, and with funds from the Small Business Service, WERS 2004 expanded the scope of the survey to include workplaces with 5–9 employees. This expanded the population of workplaces represented by the survey sample so that it accounted for one quarter (26 per cent) of all workplaces belonging to SMEs and three-quarters (76 per cent) of all employees working in SMEs. An intro-duction to WERS 2004 is provided in Appendix A.
The WERS sourcebook (Kersley et al., 2006) focused on the
consistently-defined subset of workplaces with 10 or more employees in order to examine the degree of change in employment relations across the whole economy over the period since 1998. This left an opportunity to utilise the new sample of smaller workplaces. That opportunity is taken up in this companion volume, which uses data on workplaces with 5 or more employees to examine the nature of employment relations among workplaces and employees that belong to private sector SMEs. The aim is to contribute to debates about the nature of employment relations in small and medium-sized firms, and also to contribute to the wider examination of the role of firm size in shaping private-sector employment relations.
Despite the relative paucity of statistical evidence on the nature of employ-ment relations in smaller firms, there is scepticism in some quarters about what might be learned from large-scale surveys about management-employee rela-tions in SMEs (see, for example, Blackburn: 2005). The strength of large-scale surveys, it is argued, is their ability to record the incidence of formal structures and practices, something that is less pertinent to the experience of employment relations in smaller firms. A second concern is that the small firm (or work-place) may often be unable to furnish easily-identifiable role-holders who can speak authoritatively about employment relations issues at their location, due to the lower incidence of specialised personnel managers and the scarcity of union representation. The relative absence of recorded data on employment issues in SMEs is also thought to inhibit quantitative data collection methods. Large-scale surveys are certainly well-suited to the collection of information on the incidence of formal structures and practices. Their reliance on closed questions and the fact that they are often conducted intermittently mean they are necessarily more limited in their ability to examine ad hoc arrangements or depict the ever-changing social relations within the workplace. However, the WERS questionnaires go some way beyond a concern with the facts and figures that commonly form part of personnel records, or the institutional arrange-ments that have characterised some investigations of larger firms. Furthermore, the survey collects a good deal of attitudinal information that provides an insight into the experience of work in firms of all sizes.
As regards the availability of suitable respondents, smaller firms and workplaces are naturally less likely to employ specialist managers of personnel or related issues. But this is also reasonably common in larger firms and workplaces. Only
two-fifths (39 per cent) of the 2,295 workplaces that participated in WERS 2004 employed someone with the title of personnel manager, human resources manager, employee relations manager or similar. Accordingly, all approaches are directed to the ‘‘senior person at the workplace with responsibility for personnel or employment relations issues’’, in recognition of the fact that, in many workplaces – small and large – this person may be the owner or proprietor, a general manager or a manager whose primary responsibility lies in another area, such as finance.2Furthermore, since 1998, the survey has collected data directly
from employees to ensure that it obtains a picture of employment relations that is less dependent on the managerial respondent. These linked employer-employee data are rarely present in most SME studies.
In addition to these attributes, WERS 2004 also benefits from healthy response rates, both at survey and item-level, thus guarding against non-representativeness. It also benefits from its considerable scope and scale – it has a large sample of workplaces belonging to SMEs, and includes a wide range of questions on a broad spectrum of employment relations issues. The sample size and question coverage permit wide-ranging comparisons with workplaces and employees in large firms. A limitation of WERS is that, even after the extension of the employment threshold, the survey is still only representative of workplaces with 5 or more employees, which together employ around three-quarters of all employees in SMEs. But as Blackburn points out (2005: 59), WERS 2004 is not a panacea for understanding the employment relations in smaller firms. Indeed, there are few if any methodologies in the social sciences which offer universal solutions. Advances are more usually made incrementally through a variety of methods which, together, broaden our understanding in different, but complementary, ways.
Identifying workplaces and employees that belong to SMEs
The WERS 2004 Cross-Section Survey provides a sample of 2,295 workplaces that, after appropriate weighting, is nationally representative of all workplaces with 5 or more employees, located in Great Britain (England, Scotland and Wales) and engaged in activities within Sections D (Manufacturing) to O
(Other Community, Social and Personal Services) of the Standard Industrial
Classification (2003). A workplace is defined as comprising the activities of a single employer at a single set of premises. Examples include a single branch of a bank, a car factory or a school.
Management interviews were conducted at each of these 2,295 workplaces. Self-completion questionnaires were distributed to up to 25 randomly-selected employees in each workplace where the manager permitted it, and were returned by a total of 22,451 employees. Interviews were also conducted with 948 on-site employee representatives and financial data was returned by 1,071 of the participating workplaces. Appendix A provides full details.
whilst complex definitions may permit a better distinction between smaller and larger firms within an individual industry, they make comparisons across sectors less transparent. Accordingly, employment-based definitions generally prevail over other options. As indicated at the beginning of the chapter, official statis-tics in the United Kingdom and European Union categorise all private sector enterprises with fewer than 250 employees as SMEs. Within the SME category, small firms are defined as those employing fewer than 50 employees and medium-sized firms are defined as those employing 50–249 employees.
In WERS firm size was indicated by the response to a 12-category measure of the total number of employees within the ultimate controlling company in the UK or, for single independent workplaces, by a continuous measure of the number of employees working at the site (there being no other sites within the
organization).3 Private sector workplaces were defined as those which
cate-gorised their formal status (or the formal status of the firm to which they belonged) as any of the following: public limited company (PLC); private lim-ited company; company limlim-ited by guarantee; partnership (inc. limlim-ited liability partnership) or self-proprietorship; trust or charity; body established by Royal Charter; or co-operative, mutual or friendly society.4
These categorisations yielded samples of 621 private sector SME workplaces from the management survey and 4,683 of their employees from the employee survey. Some 392 of these workplaces and 2,438 of these employees were loca-ted in small private-sector firms with fewer than 50 employees, whilst the remaining 229 workplaces and 2,245 employees were located in medium-sized private-sector firms with 50–249 employees.
It should be noted again at this point that the WERS sample excluded workplaces with fewer than 5 employees. The sample available for this report therefore excludes all firms with fewer than 5 employees, and all workplaces with fewer than 5 employees that belonged to firms with 5 or more employees. The practical implication is that the data used in the report is representative of 26 per cent of all workplaces and 76 per cent of all employees in private sector SMEs.5
Approach of the report
The principal aim of the report is to describe the nature and conduct of employment relations in workplaces belonging to private sector firms with fewer than 250 employees (SMEs), albeit with the caveat about coverage just noted. Data on the nature and practice of employment relations is taken from the 621 management interviews, whilst the 4,682 employee questionnaires provide data on the experience of work. Data from employee representatives is not used, since union and non-union representatives were rare in workplaces belonging to SMEs and the sample yielded only 61 interviews. Financial data is not used because of the descriptive nature of the report. Data from public sector workplaces does not feature since the adopted definition of SMEs is concerned only with private sector organizations.
Comparisons are made within the SME category between workplaces belonging to small firms that have fewer than 50 employees and those belonging to
medium-sized firms that have between 50 and 249 employees. Frequent com-parisons are also made with workplaces and employees in large private sector firms employing 250 or more employees. WERS 2004 provides a sample of 1,072 workplaces and 10,578 employees in large private sector firms, which form the basis for such comparisons. The tables and figures presented in the report include separate estimates for workplaces or employees within small, medium and large firms, together with summary data on all SMEs and the private sector as a whole (comprising SMEs plus large firms).
The approach differs from that taken in the analysis of small business
employment relations presented in the WERS 1998 sourcebook (Cully et al.,
1999: 251–74). That earlier analysis used a sub-sample of workplaces with fewer than 100 employees, making comparisons between single independent workplaces and those that belonged to larger firms. The main point of com-parison was therefore the number of sites within the firm. The approach taken in this report is rather different, with the main point of comparison being the number of employees in the firm, irrespective of workplace size or organiza-tional structure. One consequence, as illustrated in Chapter 2, is that the com-parison group of workplaces in large firms demonstrates a considerable degree of heterogeneity, comprising small workplaces and large ones, head offices and branch sites, and so on.
The reason for framing the analysis primarily in terms of firm size is to align it more closely with the commonly-used definitions of SMEs. This reflects our primary objective, which is to present a descriptive mapping of employment relations in SMEs in some of the areas covered by WERS 2004. Where space permits, the analysis indicates further variations within the SME category, for example, between firms with full-time working owners and those managed under other arrangements. It is, of course, just one way of analysing and pre-senting the WERS data. Other approaches are possible, and it is hoped that this study will encourage others to make use of the opportunities presented by WERS which space constraints prevent us from exploring more fully here.
One potential concern with the approach adopted here is that it may appear to attribute variations in the pattern of behaviour across firms solely to differences in firm size. This is not the intention. Firm size is one of a number of character-istics shaping the employment relationship, along with workplace size, manage-ment and employee attitudes and abilities, product market characteristics, technology and a host of other factors. Multivariate analysis can help to tease out the relative importance of these factors but, to the extent that firm size has been given only limited attention in the literature, the analysis presented here may help to identify patterns that prompt further investigation.
considers how employers set out to meet their staffing needs, covering issues such as recruitment and selection, working patterns, employee development and work organization. Chapter 5 examines the arrangements for information pro-vision, communication and consultation, covering arrangements for direct communication and employee representation, as well as looking at the degree of information sharing on key issues. Chapter 6 identifies how pay and other terms and conditions are determined, including an examination of pay levels and the links with pay satisfaction. Chapter 7 looks at the incidence of a variety of different indicators of workplace conflict or dissonance, including qualitative evaluations of the state of the employment relationship. Chapter 8 looks at the ways in which firms seek to ensure equality of opportunity in the workplace, and also considers arrangements to assist work-life balance, including an assess-ment of the views of managers and employees on the relationship between work-ing life and responsibilities outside of the workplace. Finally, Chapter 9 provides a summary of the main findings and sets out some conclusions.
Analytical issues and conventions
The high response rates achieved in WERS 2004 (both for the survey as a whole and for individual questions) help minimise response biases, but sampling and non-response weights have also been computed to ensure, so far as is prac-ticable, that one can extrapolate from the survey to the population from which it was drawn. Like other sample surveys, however, WERS 2004 is subject to sampling errors whereby the results computed from the sample provide only an estimate of the true figure within the population as a whole. It is possible to quantify the degree of error through the calculation of standard errors and confidence intervals. For ease of reading, these are not reported within the text, which reports estimates as if they were exact. However, Appendix B includes tables which allow the reader to approximate standard errors for various per-centages, based on average design effects for both the management and employee surveys within the WERS 2004 Cross-Section.
Unless otherwise stated the results presented in this publication exclude cases where the respondent did not provide an answer (i.e. they refused to provide one or were unable to express a view). The level of missing cases never exceeds 10 per cent, unless otherwise stated. Where differences or associations are highlighted, these have all been tested and are statistically significant at the 5 per cent level, unless stated to the contrary.
Symbols within tables
0 Represents less than 0.5 per cent, including none.
2
A profile of workplaces belonging
to SMEs
Introduction
There are many contextual factors that may affect the conduct of employment relations in SMEs. Matlay (2002: 308), for example, highlights the importance of economic, social and political values, with particular emphasis on the state of the economy, attitudes towards entrepreneurship, the nature of labour supply, and legislation governing business activity and employment. Kinnie et al. (1999), for their part, emphasize the role played by competitive pressures.
This chapter does not attempt to survey the macro-economic, social or poli-tical context in which SMEs operate. This sort of general scene-setting is ably done elsewhere (see for example Storey, 1994; Cosh and Hughes, 2003a). Instead, the chapter uses contextual information that WERS collects about workplaces and their employees to provide a profile of SMEs and their business operations. The chapter covers a wide range of workplace characteristics, from industrial activity and ownership, to the nature of product market competition. It also considers the characteristics of employees who work in SMEs. Each of these factors has a bearing on employment relations to some degree. Consider-ing such issues at the outset of the report will therefore aid understandConsider-ing of the patterns of employment relations that are described in later chapters.
Workplace size
The size of either a workplace or a firm – measured in terms of the number of employees – is an important determinant of employment relations practice because, other things being equal, larger units entail a greater level of
organi-zational complexity (Sisson and Marginson, 2003: 178–79; Kersley et al.,
2006). The analysis presented in this report is focused on the size of the firm, but where firms are comprised of multiple workplaces, it is important to make a distinction between the two types of unit. One might expect workplace size to be the more important determinant of the presence of on-site employee representatives or on-site childcare, for example, where reasonable numbers of employees are required to make such services viable, or for it to be critical in shaping requirements for functional flexibility. Firm size, on the other hand, might be more important in determining the sophistication of grievance and disciplinary procedures or the nature of pension arrangements.
belonging to large firms were modest in size (84 per cent employed fewer than 50 employees) and any differences were principally due to the small proportion of very large workplaces belonging to large firms. The median workplace in SMEs employed 10 employees, compared with a median of 12 employees in large firms, whereas mean employment in the two categories stood at 17 and 42 employees respectively. Workplaces belonging to medium-sized firms tended to be larger than those belonging to either small or large firms, illustrating the complexity of the relationship between workplace and firm size.
The presence of a small proportion of sizeable workplaces in large firms meant that the pattern of employment by workplace size was rather different across the three categories of firm. Almost three-quarters (72 per cent) of all employees in SMEs worked in workplaces with fewer than 50 employees, compared with less than three-tenths (27 per cent) of employees in large firms. More than two-fifths (43 per cent) of all employees in large firms worked in workplaces with 250 or more employees.
Industrial activity
Whilst some forms of SME activity are perhaps more prominent in the public eye than others, SMEs operate in almost all areas of industry. The Wholesale and retail sector accounted for the greatest proportion of private sector SME workplaces (22 per cent), but substantial proportions were also engaged in Manufacturing, Hotels and restaurants, Other business services and Health and
social work (Table 2.1). Workplaces in small firms differed from those in
medium-sized firms in being less likely to be engaged in Wholesale and retail and more likely to be engaged in Hotels and restaurants. Compared with workplaces belonging to larger firms, those belonging to SMEs were more likely to be engaged in Manufacturing (18 per cent, compared with 5 per cent), Construction (8 per cent, compared with 2 per cent), Other business services (19 per cent, compared with 13 per cent) and Health and social work (13 per cent, compared with 5 per cent). Workplaces belonging to SMEs were less likely to be engaged in Wholesale and retail (22 per cent, compared with 38 per cent) and Financial Services (less than 1 per cent, compared with 14 per cent).1
The pattern of SME employment by industry sector was broadly in line with the workplace distribution. In large firms, however, there were two notable exceptions. Whilst manufacturing sites comprised only 5 per cent of all work-places in large firms, they accounted for almost one fifth of all employees. In contrast, the two-fifths of workplaces engaged in Wholesale and Retail accounted for only one quarter of all employees. The implications are that, in large firms, manu-facturing sites tended to have a relatively large number of employees, whilst large wholesale and retail firms spread their activities across many smaller sites.
Location within the wider organization
Cosh and Hughes (2003b: 6) estimate that 71 per cent of all firms with fewer
than 500 employees operate on a single site. In the population of workplaces
T able 2.1 Industrial activity % workplaces % employees All private sector Size of firm All private sector Size of firm All SMEs Small Medium- sized Large All SMEs Small Medium- sized Large Col %s Industrial activity: Manufacturing 13 18 19 14 5 1 9 2 1 1 9 2 5 1 8 Electricity , gas and water supply 0 0 0 0 0 0 0 0 0 1 Construction 6 8 8 8 2 5 8 8 8 3 Wholesale and retail 29 22 20 31 38 22 16 17 16 26 Hotels and restaurants 10 10 11 2 1 0 7 8 1 2 3 7 T ransport and communications 4 3 3 1 6 7 5 5 4 9 Financial services 6 0 0 1 14 8 1 1 1 11 Other business services 17 19 19 22 13 17 21 18 26 15 Public administration 0 0 0 0 0 0 0 0 0 0 Education 1 1 1 2 1 3 2 1 3 3 Health and social work 9 1 3 1 2 1 3 5 7 1 2 1 5 9 5 Other community services 6 6 6 6 6 4 6 6 6 3 Base: all private sector workplaces with 5 o r more employees. Figures are weighted and based on responses from the following numbers of managers: 1,706 (all private sector), 621 (all SMEs), 392 (small firms), 229 (medium-sized firms) and 1,072 (lar ge firms).
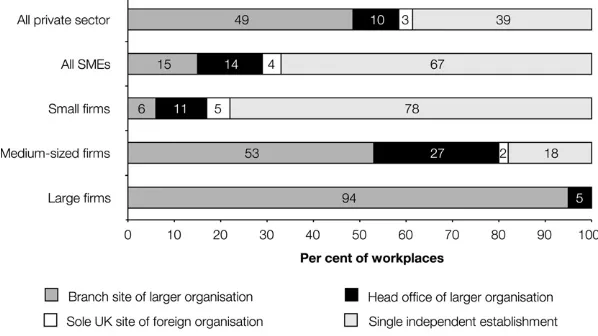
covered by WERS, two-thirds (67 per cent) of workplaces belonging to SMEs constituted the only site in the firm. A further 14 per cent were head offices of multi-site firms and 15 per cent were branch sites; the remaining 4 per cent were the sole UK workplace of a foreign firm (Figure 2.1). There was a sub-stantial difference between workplaces belonging to small firms and those belonging to medium-sized concerns. Three-quarters (78 per cent) of work-places belonging to small firms were single-independents and just 6 per cent were branch sites; the equivalent figures among workplaces belonging to medium-sized firms were 18 per cent and 53 per cent respectively. Among workplaces belonging to large firms, the vast majority (94 per cent) of all workplaces were branch sites and less than one per cent were single-independents.
One likely result of these patterns is that managers in workplaces belonging to smaller firms are likely to have a greater degree of autonomy in their approach to employment relations than managers in workplaces belonging to larger firms, many of whom may have to follow guidelines or policies deter-mined at a higher level in the organization. The corollary, however, is that managers in SMEs will usually have to look outside of the firm for advice or assistance with employment matters, whereas branch managers in large firms are more likely to be able to call upon expertise at regional or head office.
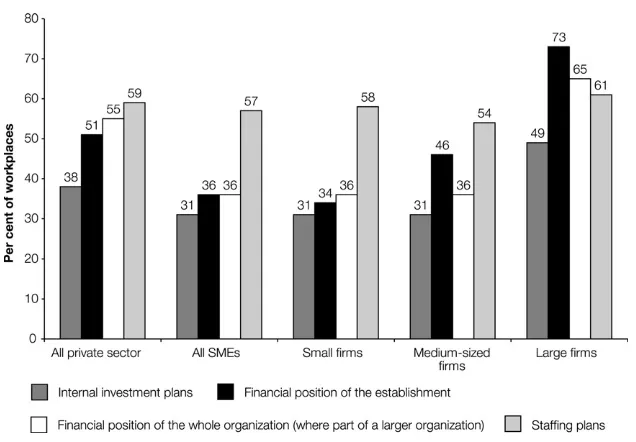
Ownership
[image:25.442.66.365.389.557.2]Ownership is said to be a particularly important element in determining the nature of the employment relationship in SMEs, with studies commonly focusing on the impact of family ownership and the role played by owner-managers (e.g.
Figure 2.1 Location within the wider organization
Base: all private sector workplaces with 5 or more employees.
Figures are weighted and based on responses from the following numbers of managers: 1,704 (all private sector), 619 (all SMEs), 392 (small firms), 227 (medium-sized firms) and 1,072 (large firms).
Marlow and Patton, 2002). The wider literature on employment relations also acknowledges the distinctiveness of foreign-owned businesses (Ferner, 2003) although, foreign-ownership is comparatively rare in the SME sector.
Three-quarters (74 per cent) of SME workplaces belonged to limited companies (either public limited companies, private limited companies or companies limited by guarantee). Private limited companies accounted for the majority of these (65 per cent of all SME workplaces). A further 21 per cent belonged to part-nerships or self-proprietorships, 5 per cent were trusts or charities and the remaining one per cent either categorised themselves as bodies established by royal charter or as co-operatives, mutuals or friendly societies.
Managers in three-quarters (77 per cent) of SME workplaces belonging to limited companies subsequently reported that a single individual or family owned at least 50 per cent of the company. Almost three-fifths (57 per cent) of SME workplaces therefore belonged to family-owned companies. The figure was 58 per cent in small firms and 53 per cent in medium-sized firms. It was just 20 per cent in large firms, with the majority of the workplaces in this category (61 per cent) belonging either to PLCs or private limited companies that were not under family-ownership. In later chapters, family-owned companies and partnerships/self-proprietorships are together categorised as ‘family-owned’ firms. Under this categorisation, around four-fifths (78 per cent) of SME workplaces are considered family-owned (80 per cent of workplaces in small firms and 67 per cent of workplaces in medium-sized firms). The figure among workplaces belonging to large firms is just 22 per cent. Family-ownership was therefore extensive in the SME sector although this was especially the case in firms with less than 50 employees. The involvement of owners in the management of family-owned firms is considered in Chapter 3. Almost all workplaces belonging to SMEs (93 per cent) were wholly UK-owned, with 4 per cent being wholly foreign-owned and 2 per cent being partly UK-owned and partly foreign-UK-owned. The extent of foreign ownership was much higher in large firms, where one third (34 per cent) of workplaces were at least partly foreign-owned. Among SME workplaces, there was no difference in the extent of foreign ownership between workplaces belonging to small or medium-sized firms. A small difference was apparent between SME workplaces engaged in manufacturing (12 per cent) and those engaged in services (5 per cent), but the difference was not statistically significant. In contrast, among large firms, the extent of foreign ownership was much greater in manufacturing (60 per cent) than in services (33 per cent).
Age of workplace
Whilst the focus of much of the literature – and indeed this report – is on the
sizeof the firm, it is clear that a number of features of smaller firms are a function of both their size and their age. Procedures for handling grievances or conducting performance appraisals, whether they be formal or informal, can take some time to develop and refine. Cohort effects may also be apparent: current rates of union recognition, for example, are highest among workplaces that were established in the period around the Second World War (Millwardet al., 2000).
WERS 2004 contains no information on the age of the organization to which the workplace belongs, asking the management respondent only about the age of their own workplace. Workplaces belonging to SMEs were slightly younger, on average, than those belonging to larger firms, but the differences were not substantial. Some 15 per cent of workplaces belonging to small firms were less than 5 years old, compared with 7 per cent of workplaces in medium-sized firms and 10 per cent of workplaces in large firms. Conversely one third (32 per cent) of workplaces in small firms were at least 25 years old, compared with 42 per cent of workplaces in medium-sized firms and 35 per cent in large firms. The muted relationship between firm size and workplace age would seem to be partly a function of the way in which some firms grow – opening new sites rather than continually expanding their existing ones (the retail sector being an obvious example).
The competitive environment
WERS 2004 took place in a period of relative stability in the economy, when Britain was benefiting from low interest rates and low inflation. Nonetheless, there was evidence of demand constraints in the manufacturing sector and of increasing difficulties in some hi-technology sectors (Cosh and Hughes, 2003b: 4). The literature on employment relations in SMEs has highlighted the pressures that may derive from customers, suppliers and competitors. Kinnieet al.(1999), for example, draw attention to the ways in which relationships with other businesses constrain managers in smaller firms. WERS 2004 contains data on workplaces’ relationships with customers and on the nature and degree of pro-duct market competition they face, enabling us to map the types of competitive situations experienced by smaller firms and to place these in context by com-paring them with the situations of larger firms.
First, it was apparent that workplaces belonging to smaller firms were more likely than workplaces belonging to larger firms to trade with other firms and less likely to trade with the general public. Some 45 per cent of workplaces in SMEs traded solely with other firms, 45 per cent traded only with the general public and 8 per cent did both. In large firms, only 18 per cent of workplaces traded solely with other firms, 64 per cent traded only with the general public and 14 per cent did both.2The fact that smaller firms were more likely to trade only with other firms indicates a greater likelihood of being reliant on a single customer, which can create particular pressures on the operation of a business (see Moule, 1998). Just under half (48 per cent) of workplaces belonging to SMEs supplied more than 10 per cent of their goods (by value) to a single customer, compared to 34 per cent of large firms. The dependence of SMEs on particular customers did not differ greatly between small and medium-sized firms, but it was notably more apparent in manufacturing than in services, which is likely to result from the greater reliance in manufacturing on trade between businesses. The greater level of exposure among SMEs in general is further illustrated by figures which show that half (48 per cent) of workplaces belonging to SMEs relied on a single product or service, compared with one third (35 per cent) of workplaces belonging to larger firms.
Workplaces belonging to SMEs were less likely than those belonging to large firms to have a purely local market (43 per cent, compared with 57 per cent) and more likely to have a regional market (21 per cent, compared with 10 per cent). The proportions with a national or international market were thus similar
(11 per cent and 10 per cent respectively).3 The proportions of workplaces
facing competition from overseas-based suppliers was also similar: 25 per cent in SMEs and 27 per cent in large firms. In respect of the levelof competition, Kitson and Wilkinson (2003b: 23) suggest that the degree of competition increases with firm size. In WERS, managers were asked how many competitors they had for their main product or service, and they were also asked to rate the degree of competition on a five-point scale from ‘very high’ to ‘very low’. The proportions of managers reporting more than 5 competitors was around three-fifths in small, medium and large firms. However, only one third (33 per cent) of managers in workplaces belonging to SMEs rated the degree of competition in the market for their main product or service as ‘very high’, compared with almost half (48 per cent) of managers in workplaces belonging to large firms.
Taken together, these findings suggest that workplaces belonging to SMEs do not necessarily face more difficult trading conditions than larger firms, on average. But they do suggest that, when fortunes change for the worse, the greater reliance on single products or services and the absence of a broad customer base, may place greater pressure on such workplaces than otherwise equivalent workplaces belonging to large firms. The risk is heightened by the fact the workplaces belonging to SMEs were more likely than those in large firms to be located in turbulent or declining markets. Overall, two-thirds of SME workplaces reported that the market for the main product or service was either growing (41 per cent) or mature (26 per cent), whilst one third reported that it was either declining (13 per cent) or turbulent (19 per cent). In large firms, three-quarters (78 per cent) of workplaces said their primary market was growing or mature and one quarter (22 per cent) said it was declining or turbulent.
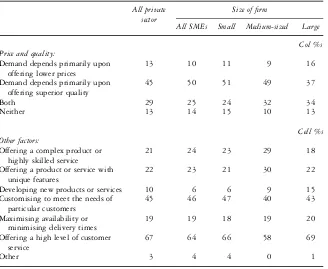
The firm’s own competitive strategy can also have a bearing on employment relations. Kersley et al. (2006) show, for example, that workplaces competing heavily on price were less likely to provide off-the-job training to core employees than workplaces with lower degrees of price dependence. Managers were asked to rate the extent to which demand for their main product or service depended on offering lower prices or superior quality than their competitors, in either case using a five-point scale in which the end points of the scale were labelled ‘Heavily’ (5) and ‘Not at all’ (1).4The responses among SMEs and large
the responses, and categorising dependence as a response of 4 or 5 on the scale, demand for SMEs’ products and services was most likely to be dependent pri-marily on quality (50 per cent), whereas demand for large firms’ output was almost equally likely to be dependent on both price and quality (34 per cent) as it was to be dependent primarily on quality (37 per cent) (Table 2.2).
When asked what other factors were critical to competitive success, work-places belonging to SMEs were more likely than their counterparts in large firms to mention offering a complex product or highly-skilled service and less likely to mention developing new products or services. The general tenor of these findings is then in keeping with others (Kitson and Wilkinson, 2003b: 25) which show that smaller firms are more likely than larger firms to compete on the basis of quality and expertise than price.
Workforce composition
[image:29.442.55.383.301.570.2]The final part of this chapter considers the composition of the workforce in SMEs. Six specific characteristics are covered – occupation, gender, ethnicity, disability, age and caring responsibilities – with other factors often considered under the same heading (such as hours of work and contractual forms) being discussed
Table 2.2 Factors critical to competitive success
All private sector
Size of firm
All SMEs Small Medium-sized Large
Col %s Price and quality:
Demand depends primarily upon offering lower prices
13 10 11 9 16
Demand depends primarily upon offering superior quality
45 50 51 49 37
Both 29 25 24 32 34
Neither 13 14 15 10 13
Cell %s Other factors:
Offering a complex product or highly skilled service
21 24 23 29 18 Offering a product or service with
unique features
22 23 21 30 22 Developing new products or services 10 6 6 9 15 Customising to meet the needs of
particular customers
45 46 47 40 43 Maximising availability or
minimising delivery times
19 19 18 19 20 Offering a high level of customer
service
67 64 66 58 69
Other 3 4 4 0 1
Base: all trading private-sector workplaces with 5 or more employees.
Figures are weighted and based on responses from the following numbers of managers: 1,581 (all private sector), 602 (all SMEs), 383 (small firms), 219 (medium-sized firms) and 996 (large firms).
along with forms of work organization in Chapter 4. As the principal focus of WERS is on relations between managers and paid employees, it is important to note that the discussion does not cover the incidence or characteristics of unpaid workers, who are likely to be most prevalent in small, family-owned firms.
The composition of the workforce in SMEs is of particular interest because it has been asserted that smaller firms are more likely to employ workers from groups that, traditionally, have been disadvantaged in the labour market, such as women, young workers and people from ethnic minority groups (TUC,
1998, cited in Dundon et al., 1999; Kirton, 2004). The discussion begins,
however, with the characteristic that is perhaps most commonly used to cate-gorise employees within firms: occupation.
The occupational profile of employment in SMEs was not particularly differ-ent in aggregate from the profile of employmdiffer-ent in large firms, when
cate-gorised according to the nine Major Groups of the Standard Occupational
Classification (2000). The main difference was that SMEs employed much lower proportions of employees in Sales and customer service occupations (5 per cent, compared with 16 per cent), partly reflecting the lower degree of wholesale and retail activity (see Table 2.1). Differences were more apparent, however, when comparing the identity of the largest non-managerial occupational group (LOG). In almost half (47 per cent) of workplaces belonging to large firms, the LOG was Sales and customer service occupations, with none of the other seven non-managerial groups accounting for much more than one tenth of all workplaces. In contrast, none of the eight occupational groups accounted for more than one fifth of workplaces in SMEs (Skilled trades and Elementary occupations each constituted the LOG in 17 per cent of SME workplaces).
Whilst Managers and senior officials and Administrative and secretarial staff each accounted for less than one fifth of all employees in SMEs, employees from both occupations were employed in most workplaces belonging to smaller firms (82 per cent in the case of Managers and senior officials; 65 per cent in the case of Administrative and secretarial staff). The figures were little different even among workplaces belonging to micro firms with between 5 and 9 employees (74 per cent and 66 per cent respectively), but further cross-tabulations showed that workplace size was clearly a more important determinant than firm size. There were also no substantive differences by firm size in the proportion of all employees with supervisory responsibilities (34 per cent of all employees in SMEs, or 27 per cent of non-managerial employees).
The proportion of female employees was slightly higher in small firms (52 per cent) than in medium-sized and large firms (46 per cent and 48 per cent respectively). However, these differences could be explained by differences in industrial activity: no statistically significant differences remained after con-trolling for industry sector. It was also apparent that the female share of employment was lower in the smallest firms with 5–9 employees (47 per cent) than in those with 10–49 employees (53 per cent). The relationship between firm size and gender was therefore not straightforward.
less than 500 employees are led by women (2003b: 7, 11). WERS collects no data on the characteristics of business owners, except in cases where the owner is a full-time manager and responded themselves to the survey (see Chapter 3). However, WERS does collect information on the gender of Managers and senior officials, through both the Management and Employee surveys. The Employee Questionnaire data indicate that the proportion of female Managers and senior officials was identical in SMEs and large firms (36 per cent), whilst the Man-agement data showed that the proportion of workplaces in which women were under-represented in management grades was very similar between workplaces in SMEs (71 per cent) and large firms (72 per cent).5
One in twenty employees working in SMEs (6 per cent) classified themselves as belonging to a non-white ethnic group.6The proportion was lowest in firms
with fewer than 20 employees (3 per cent), and stood at 7 per cent among employees in other small firms, medium-sized firms and large enterprises.7The
management data confirmed the view that ethnic minority employment is less extensive in smaller firms. Employees from non-white ethnic groups accounted for at least one tenth of the workforce in 13 per cent of workplaces belonging to SMEs and 24 per cent of workplaces belonging to large firms. One sixth (17 per cent) of workplaces belonging to firms with fewer than 20 employees employed at least one person from a non-white ethnic group, compared with 25 per cent in other small firms, 38 per cent in medium-sized firms and 41 per cent in large firms.
Around one in twenty employees in SMEs (4 per cent) reported that they had a long-term illness, health problem or disability that affected either the amount or the type of work they could do. The figure was identical in large firms. Managers may not always be aware of their employees’ health status, which may explain why they reported in aggregate that only one per cent of employees had a long-term disability that affected their work. Nonetheless, managers in 7 per cent of workplaces belonging to SMEs reported that at least 5 per cent of their employees had such disabilities. This compared with 6 per cent among man-agers of workplaces in large firms.
Across the private sector, SMEs and large firms employed the same propor-tions of young workers: 7 per cent of all employees were aged 18–21 and 2 per cent were aged 16–17. However, the workplace distribution of young employ-ees varied across SME’s and workplaces in large firms. Around one third (35 per cent) of workplaces in SMEs had at least 10 per cent of their workforce in the age range 16–21 (38 per cent in small firms and 26 per cent in medium-sized firms), compared with 49 per cent in large firms. Nevertheless, this greater concentration of young workers into specific workplaces within large firms was explained by the greater proportion of large firm workplaces that operated within the Wholesale and retail sector. After excluding this sector, the propor-tion of large firm workplaces in which more than 10 per cent of the workforce were aged 16–21 fell to 33 per cent, whilst the proportions for workplaces in small and medium-sized firms were relatively unchanged.
SMEs employed a slightly higher proportion of older workers than large firms: 28 per cent of employees in small firms and medium-sized firms were
aged 50 or above, compared with 23 per cent of employees in large firms. Around three-quarters (77 per cent) of workplaces in SMEs had at least 10 per cent of their workforce aged 50 or over, compared with three-fifths (59 per cent) of workplaces in large firms.
Almost two-fifths of private sector employees (37 per cent) had dependent children, with 12 per cent having children of pre-school age. There were no differ-ences in these proportions between SMEs and large firms. There was some indication that employees in firms with fewer than 10 employees were more likely to have dependent children than employees in other sizes of firm (44 per cent of employees in micro firms had dependent children and 14 per cent had children of pre-school age), but the differences were not statistically significant. Eight per cent of employees in SMEs spent five hours or more per week looking after or giving support to family members or friends with long-term physical or mental illness or disability, or with problems relating to old age. In large firms, the equivalent figure was 7 per cent. Substantial minorities of employees in SMEs thus had responsibilities relating to the care of dependent children or other adults, but they did not appear to differ greatly from employees in large firms in these respects.
Summary and conclusions
This chapter used some of the contextual information collected in WERS in order to outline some of the basic features of SME workplaces and their employees. A variety of characteristics were considered, including industrial activity and ownership, the nature of product markets and the composition of the workforce. There were few surprises, with many of the results corroborating patterns observed in other statistical portraits (Cosh and Hughes 2003a, 2003b; Kitson and Wilkinson 2003a, 2003b). This is reassuring, since the patterns observed in this chapter will contribute in some way to an understanding of the variations in employment relations that are described in later chapters. How-ever, the characteristics are also of interest in their own right, as they begin to indicate some of the heterogeneity among small and medium-sized firms.
SMEs were present in all industry sectors that had noticeable shares of private sector employment, with the exception of Financial services. Three industries accounted for around three-fifths of all employees in SMEs (Manufacturing, Wholesale and retail and Other business services), but SME employment was no different to employment in large firms in that respect. Variations in the average size of workplaces between small, medium and large firms were generally as one would have expected, except that medium-sized firms had the lowest proportion of very small workplaces.
The proportion of workplaces operating as single independent sites decreased sharply as firm size increased. This was one of those areas in which differences between workplaces in small and medium-sized firms were most obvious. The differences were much smaller in respect of the degree of family-ownership and the extent of foreign-ownership. Differences were also rather muted in respect of workplace age.
The findings in respect of the competitive environment suggested, as one might expect, that smaller firms were more reliant on single products or ser-vices, and on trade with particular customers. SMEs were also more likely than large firms to be located in markets that were either turbulent or declining. Nevertheless, the degree of competition faced by SMEs from other suppliers was lower, on average, than the degree of competition faced by workplaces in large firms. Questions on the nature of product demand showed that workplaces belonging to SMEs were more likely than those belonging to larger firms to compete on the basis of quality and specialist expertise, and less likely to compete on price. However, the degree of variation between the size categories was much lower than the variation within each.
There were relatively few points on which employees in SMEs were distinct from the wider profile of private sector employment. Some of the main differ-ences were found in respect of occupation and age, although these could be largely explained by differences in industrial activity. Workplace size was also an important factor in determining the occupational profile of employment in firms of different sizes. In other respects, such as gender or ethnicity, differences were relatively small.
In the chapters which follow, the report considers a wide range of characteristics that can be considered more central to the topic of employment relations than the material presented here. It will be helpful to reconsider some of the patterns outlined here as the material that forms the core of WERS is presented and discussed. The analysis makes some attempt to include these factors, where obvious relationships suggest themselves and where space permits. Nevertheless, the primary goal is to map the features of employment relations in SMEs, and so it can be expected that many questions about underlying causes and effects will remain unanswered until further research is conducted.
3
The management of employees
Introduction
There is perhaps more research on management style than there is on any other area of employment relations in small and medium-sized firms. Blackburn (2005) maps the genesis of this research from early studies portraying small as ‘beautiful’ or ‘bad’ to more recent evidence that employment relations in SMEs are more nuanced and complex, defying simple categorisation (Holliday, 1995). These later studies have emphasized the diversity within the sector, demon-strating that management styles are not determined solely by structural features of the firm but are often fashioned in response to market conditions, employee bargaining power and social conditions within and beyond the firm (Goss, 1988, 1991; Ram, 1991, 1994). This chapter compares SMEs to larger firms in relation to who manages employment relations at workplace level, the resources devoted to managing employees, and the extent to which employment relations issues are integrated into business strategy. The chapter moves beyond the tra-ditional focus of WERS surveys in three respects. First, it assesses manage-ment’s orientation to the business of managing employees, thus engaging directly with the debate relating to management style. Second, it explores how managers said they dealt with employees when introducing workplace changes, thus providing evidence of the ways in which management and employees engage when innovating. Third, it assesses employee perceptions of the extent to which management seek to involve employees in SMEs and large firms.