RESEARCH
Patterns of spatial genetic structures
in
Aedes albopictus
(Diptera: Culicidae)
populations in China
Yong Wei
1, Jiatian Wang
1, Zhangyao Song
1, Yulan He
1, Zihao Zheng
1, Peiyang Fan
1, Dizi Yang
1, Guofa Zhou
2,
Daibin Zhong
2and Xueli Zheng
1*Abstract
Background: The Asian tiger mosquito, Aedes albopictus, is one of the 100 worst invasive species in the world and the vector for several arboviruses including dengue, Zika and chikungunya viruses. Understanding the population spatial genetic structure, migration, and gene flow of vector species is critical to effectively preventing and controlling vector-borne diseases. Little is known about the population structure and genetic differentiation of native Ae. albopic-tus in China. The aim of this study was to examine the patterns of the spatial genetic structures of native Ae. albopictus
populations, and their relationship to dengue incidence, on a large geographical scale.
Methods: During 2016–2018, adult female Ae. albopictus mosquitoes were collected by human landing catch (HLC) or human-bait sweep-net collections in 34 localities across China. Thirteen microsatellite markers were used to exam-ine the patterns of genetic diversity, population structure, and gene flow among native Ae. albopictus populations. The correlation between population genetic indices and dengue incidence was also examined.
Results: A total of 153 distinct alleles were identified at the 13 microsatellite loci in the tested populations. All loci were polymorphic, with the number of distinct alleles ranging from eight to sixteen. Genetic parameters such as PIC, heterozygosity, allelic richness and fixation index (FST) revealed highly polymorphic markers, high genetic diversity, and low population genetic differentiation. In addition, Bayesian analysis of population structure showed two distinct genetic groups in southern-western and eastern-central-northern China. The Mantel test indicated a positive cor-relation between genetic distance and geographical distance (R2= 0.245, P= 0.01). STRU CTU RE analysis, PCoA and GLS interpolation analysis indicated that Ae. albopictus populations in China were regionally clustered. Gene flow and relatedness estimates were generally high between populations. We observed no correlation between population genetic indices of microsatellite loci in Ae. albopictus populations and dengue incidence.
Conclusion: Strong gene flow probably assisted by human activities inhibited population differentiation and pro-moted genetic diversity among populations of Ae. albopictus. This may represent a potential risk of rapid spread of mosquito-borne diseases. The spatial genetic structure, coupled with the association between genetic indices and dengue incidence, may have important implications for understanding the epidemiology, prevention, and control of vector-borne diseases.
Keywords: Aedes albopictus, Microsatellite, Genetic diversity, Population structure, Gene flow, Dengue
© The Author(s) 2019. This article is distributed under the terms of the Creative Commons Attribution 4.0 International License (http://creativecommons.org/licenses/by/4.0/), which permits unrestricted use, distribution, and reproduction in any medium, provided you give appropriate credit to the original author(s) and the source, provide a link to the Creative Commons license, and indicate if changes were made. The Creative Commons Public Domain Dedication waiver (http://creativecommons.org/ publicdomain/zero/1.0/) applies to the data made available in this article, unless otherwise stated.
Open Access
*Correspondence: [email protected]
1 Department of Pathogen Biology, School of Public Health, Southern
Medical University, Guangzhou, China
Background
Aedes (Stegomyia) albopictus (Skuse, 1894) originated in Southeast Asia and spread to several islands in the Pacific and the Indian Oceans during the 17th and 18th centuries [1]. It was discovered in Albania in Europe in 1979 [2], the USA and Brazil in North and South Amer-ica in 1986 [3, 4], Fiji in Oceania in 1990 [5] and Nigeria in Africa in 1992 [6]. Global warming, winter diapause, and human-aided transportation have contributed to the global invasion of Ae. albopictus [7–9].
As a vector of over 20 arboviruses [10] and one of the 100 worst invasive species in the world [11], Ae. albop-ictus poses serious public health concerns for arbovirus-related disease outbreaks. In China, dengue has been a threat for 40 years, since the first reported outbreak in 1978 [12]. Local dengue transmission has been identi-fied in Guangdong, Guangxi, Hainan, Yunnan, Fujian, Zhejiang and Henan provinces [13]. Aedes albopictus and
Ae. aegypti are two important vector species responsi-ble for dengue transmission in China. Aedes albopictus
is the most predominant species and has been found in nearly one third of China [14]. This species has a wide range of distribution from north of 41°N latitude to the southern reaches of the country, while the distribution of
Ae. aegypti is limited to small areas of southern China, including Hainan, Guangdong, Guangxi and Yunnan provinces [15, 16]. Li et al. [17] reported that Ae. aegypti
was found only in two sites (Maoming, Guangdong and Sanya, Hainan) of the 26 mosquito surveillance sites in China. The relative proportion of Ae. albopictus to Ae. aegypti was > 20:1 in the two sites during 2005–2015, while the proportion of Ae. albopictus to Ae. aegypti
was approximately 1:2 in 2014 in Jinghong city, Yunnan Province [18]. Aedes albopictus has been reported to be the sole mosquito vector for dengue transmission in Guangzhou, with no presence of Ae. aegypti identified over the past three decades [19]. The strong adaptabil-ity of Ae. albopictus has contributed to the reemergence and wide spread of dengue [20] and the outbreaks of mosquito-borne diseases have spread with the expansion of mosquito habitats [21]. Vector surveillance, dispersal monitoring, and control play an important role in con-trolling outbreaks [22].
Molecular markers can provide abundant information that is critical to studying the sources and routes of vec-tor invasions [11, 23]. As the second generation of DNA markers, microsatellites or simple sequence repeats (SSRs), consisting of short tandem repeats of 1–6 nucleo-tides, are widely distributed in the genomes of animals and plants [24]. Due to the advantages of simple opera-tion, easy detecopera-tion, good reproducibility, high polymor-phism, and the inheritance of Mendelian codominance [25], microsatellite markers have been utilized to evaluate
genetic diversity and population structure, and identify invasions of Ae. albopictus [22, 26, 27]. Multiple micro-satellite markers for Ae. albopictus have been isolated previously, and there are more than 50 microsatellites applied in population genetic studies of Ae. albopictus
[11]. Although mitochondrial DNA markers are rapidly evolving, non-recombining, maternally inherited, and exhibit high rates of mutation, mtDNA is not a strictly neutral marker; strong directional selection on mtDNA sequence has been reported in several insect species [28–30]. In order to obtain more accurate and detailed information on genetic structure, large-scale multi-site samplings should be conducted, and neutral microsatel-lite markers should be used to investigate Ae. albopictus
population genetics.
The present study was designed to address the follow-ing questions: (i) What is the level of genetic diversity and population differentiation in and between Ae. albop-ictus populations in China?; (ii) What are the patterns of colonization and dispersal (or gene flow) of Ae. albopictus
in China?; (iii) Is there any association between genetic diversity indices and local dengue incidence? To address these questions, extensive mosquito samplings and a set of thirteen microsatellite loci were used in the study. The data gained from this study could provide useful infor-mation for understanding the epidemiology, prevention, and control of vector-borne diseases.
Methods
Mosquito sampling and DNA extraction
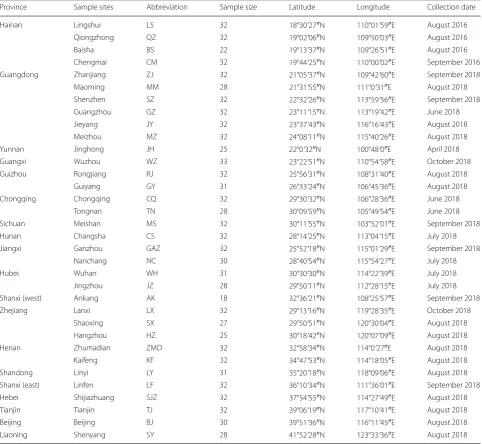
From 2016 to 2018, adult female Ae. albopictus mosqui-toes were collected by human landing catch (HLC) or human-bait sweep-net collections in 34 locations in 19 provinces across northern and southern China, includ-ing Hainan Island (Fig. 1, Table 1). The abbreviations of the 34 locations are as follows: LS, Lingshui; QZ, Qiong-zhong; BS, Baisha; CM, Chengmai; ZJ, Zhanjiang; MM, Maoming; SZ, Shenzhen; GZ, Guangzhou; JY, Jieyang; MZ, Meizhou; JH, Jinghong; WZ, Wuzhou; RJ, Rongji-ang; GY, GuiyRongji-ang; CQ, Chongqing; TN, Tongnan; MS, Meishan; CS, Changsha; GAZ, Ganzhou; NC, Nanchang; WH, Wuhan; JZ, Jingzhou; AK, Ankang; LX, Lanxi; SX, Shaoxing; HZ, Hangzhou; ZMD, Zhumadian; KF, Kaifeng; LY, Linyi; LF, Linfen; SJZ, Shijiazhuang; TJ, Tian-jin; BJ, Beijing; and SY, Shenyang.
website (http://www.phsci enced ata.cn/Share /en/index .jsp) of the Public Health Science Data Center managed by the Chinese Center for Disease Control and Pre-vention. The 19 provinces include those with frequent dengue fever outbreaks in the past 30 years, including Guangdong, Guangxi, Yunnan, Zhejiang and Hainan, as well as provinces with dengue outbreaks in recent years, including Hubei, Hunan, Guizhou and Jiangxi. Other provinces have imported cases, including Shanxi, Shandong and Liaoning. The collected specimens were identified morphologically to Ae. albopictus, and sam-ples were stored in 70% ethanol. Total genomic DNA was individually extracted using the Insect DNA Kit (Omega Bio-tek, GA, USA), following the manufactur-er’s protocol.
Cryptic species identification and Wolbachia infection Aedes albopictus cryptic species identification was per-formed by DNA sequencing of the mitochondrial gene cytochrome c oxidase subunit 1 (cox1) for the samples collected in Guangxi Province, where the cryptic species have been detected previously [31]. The Wolbachia infec-tion status of individual mosquitoes was examined by PCR amplification of Wolbachia ribosomal DNA using a previously published method [31].
Microsatellite genotyping
[image:3.595.58.540.85.459.2]previous studies, included 3 dinucleotide and 10 trinu-cleotide loci [27, 32]. The PCR reaction mixture consisted of 40 ng genomic DNA, 7.5 μl 2× PCR Master Mix (Pro-mega, Madison, WI, USA), 0.05 μl (10 μM) M13 tagged forward primer, 0.2 μl (10 μM) reverse primer, and 0.2 μl M13 tagged fluorescent dye (FAM, HEX or TAMRA), in a final volume of 15 μl. The PCR cycling conditions were as follows: 95 °C for 5 min; 30 cycles of 95 °C for 30 s, 58 °C for 40 s, and 72 °C for 45 s; 8 cycles of 95 °C for 30 s, 53 °C for 40 s, and 72 °C for 45 s; and a final exten-sion at 72 °C for 10 min. PCR products were sent to the Beijing Genomics Institute (BGI, Shenzhen, China) and
processed in an automatic sequencer ABI 3730 (Applied Biosystems, Foster City, CA, USA). Allele sizes for each locus were read with GeneMarker software (version 2.6.3) [33].
Data analysis
Analysis of pairwise relatedness
[image:4.595.57.540.102.546.2]Pairwise genetic relatedness between individuals was examined by LRM estimator [34] and QGM estimator [35] using GenAlex v.6.5 [36] to detect kinship within and between Ae. albopictus populations. The coefficient of relationship, r ≥ 0.25 for LRM and r ≥ 0.5 for QGM
Table 1 Sampling information of Ae. albopictus collection in China
Province Sample sites Abbreviation Sample size Latitude Longitude Collection date
Hainan Lingshui LS 32 18°30ʹ27″N 110°01ʹ59″E August 2016
Qiongzhong QZ 32 19°02ʹ06″N 109°50ʹ03″E August 2016
Baisha BS 22 19°13ʹ37″N 109°26ʹ51″E August 2016
Chengmai CM 32 19°44ʹ25″N 110°00ʹ02″E September 2016
Guangdong Zhanjiang ZJ 32 21°05ʹ37″N 109°42ʹ60″E September 2018
Maoming MM 28 21°31ʹ55″N 111°0ʹ31″E August 2018
Shenzhen SZ 32 22°32ʹ26″N 113°59ʹ56″E September 2018
Guangzhou GZ 32 23°11ʹ15″N 113°19ʹ42″E June 2018
Jieyang JY 32 23°37ʹ43″N 116°16ʹ43″E August 2018
Meizhou MZ 32 24°08ʹ11″N 115°40ʹ26″E August 2018
Yunnan Jinghong JH 25 22°0ʹ32″N 100°48ʹ0″E April 2018
Guangxi Wuzhou WZ 33 23°22ʹ51″N 110°54ʹ58″E October 2018
Guizhou Rongjiang RJ 32 25°56ʹ31″N 108°31ʹ40″E August 2018
Guiyang GY 31 26°33ʹ24″N 106°45ʹ36″E August 2018
Chongqing Chongqing CQ 32 29°30ʹ32″N 106°28ʹ36″E June 2018
Tongnan TN 28 30°09ʹ59″N 105°49ʹ54″E June 2018
Sichuan Meishan MS 32 30°11ʹ55″N 103°52ʹ01″E September 2018
Hunan Changsha CS 32 28°14ʹ25″N 113°04ʹ15″E July 2018
Jiangxi Ganzhou GAZ 32 25°52ʹ18″N 115°01ʹ29″E September 2018
Nanchang NC 30 28°40ʹ54″N 115°54ʹ27″E July 2018
Hubei Wuhan WH 31 30°30ʹ30″N 114°22ʹ39″E July 2018
Jingzhou JZ 28 29°50ʹ11″N 112°28ʹ15″E July 2018
Shanxi (west) Ankang AK 18 32°36ʹ21″N 108°25ʹ57″E September 2018
Zhejiang Lanxi LX 32 29°13ʹ16″N 119°28ʹ35″E October 2018
Shaoxing SX 27 29°50ʹ51″N 120°30ʹ04″E August 2018
Hangzhou HZ 25 30°18ʹ42″N 120°07ʹ09″E August 2018
Henan Zhumadian ZMD 32 32°58ʹ34″N 114°0ʹ27″E August 2018
Kaifeng KF 32 34°47ʹ53″N 114°18ʹ05″E August 2018
Shandong Linyi LY 31 35°20ʹ18″N 118°09ʹ06″E August 2018
Shanxi (east) Linfen LF 32 36°10ʹ34″N 111°36ʹ01″E September 2018
Hebei Shijiazhuang SJZ 32 37°54ʹ55″N 114°27ʹ49″E August 2018
Tianjin Tianjin TJ 32 39°06ʹ19″N 117°10ʹ41″E August 2018
Beijing Beijing BJ 30 39°51ʹ36″N 116°11ʹ45″E August 2018
was used to define a full sibling relationship (parents and offspring, or siblings that share the same parents), and a value of 0.125 < r < 0.25 for LRM and 0.25 < r < 0.5 for QGM indicates a half sibling (one shared parent). In order to reduce the siblings bias within population for analysis of genetic structure, we selected only one indi-vidual from each putative full-sibling group within any population.
Genetic diversity and differentiation
Genetic variation within each locality was estimated in terms of the average number of alleles (Na), effec-tive number of alleles (Ne), inbreeding coefficient (FIS), fixation index (FST), observed heterozygosity
(Ho) and expected heterozygosity (He) using GenAlEx v.6.5 [36]. The number of migrants per generation, or gene flow, was calculated using the following formula:
Nm = (1/FST − 1)/4 [37]. Polymorphic information
content (PIC) across all sixteen loci was assessed using Microsatellite Toolkit [38]. The possible presence of null alleles was checked at a population level for each marker using Micro-Checker (version 2.2.3) [39]. To determine whether the individuals in each study location were suf-ficient for the research, the mean number of alleles per locus (Na) for each population was calculated with a rar-efaction method using Allelic Diversity Analyzer (version 1.0) [40]. Deviation from Hardy–Weinberg equilibrium (HWE) and linkage disequilibrium (LD) were computed using GENEPOP version 4.7 [41, 42]. Analysis of molecu-lar variance (AMOVA) was performed using Arlequin version 3.5.2.2 [43]. To detect bottlenecks, the Wilcoxon test for heterozygosity excess was conducted with a two-phase mutation (TPM, 70% proportion of stepwise-mutation model in TPM, 30% variance for TPM, 1000 iterations) in BOTTLENECK v.1.2.02 [44, 45]. Genetic landscape shape (GLS) interpolation analysis was con-ducted using Alleles In Space (AIS) software based on the pairwise genetic and geographical distance matrices [46]. Results of GLS interpolation analysis were imported into Surfer software to produce the contour map [47]. A Mantel test on geographical and genetic distance (pair-wise phiPT) was performed in GenAlEx v.6.5 using 9999 permutations. The correlation between geographi-cal and genetic distance was plotted and the correlation coefficient (r) as well as R-squared were estimated using GenAlEx v.6.5.
Population structure
Geographical population structure was evaluated using the Bayesian clustering method in STRU CTU RE v.2.3 [48], which identifies the most probable number of genetic clusters (K) and assigns individuals to these clus-ters. We conducted different runs using different datasets
for further clustering. For each dataset, the most likely number of clusters (K) was determined by conducting 5 independent runs for each K, from K = 1 to the maxi-mum number of populations included in the analysis. Each run assumed an admixture model and independ-ent allele frequencies using a ‘burn-in’ value of 50,000 iterations followed by 200,000 repetitions. The optimal number of clusters (K) was determined using the Delta K method of Evanno et al. [49] in the online version of Structure Harvester v.0.6.94 [50]. Then we used a ‘burn-in’ of 100,000 and runtime of 2,000,000 generations per iteration (20 iterations) for the optimal K-values [26]. To compile data from the 20 iterations for the independent values of K, we used the Greedy algorithm in CLUMPP v.1.1.2 with 1000 replicates [51]. The results were plotted in DISTRUCT v.1.1 [52]. Relationships among popula-tions were assessed using principal coordinates analysis (PCoA) in GenAlEx v.6.5.
Correlation analysis between genetic indices and dengue incidence
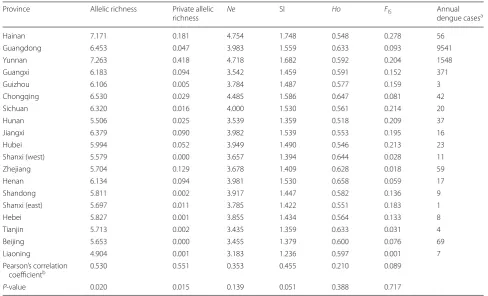
Dengue incidence was calculated as the number of cases per 100,000,000 people. Due to the high variation in the number of cases, the data were rescaled with a log-trans-formation using the equation Ln (µ), where µ is the num-ber of cases per 100,000,000 people. Pearson’s correlation coefficient was used to analyze the correlation between dengue incidence after transformation and genetic indi-ces, including allelic richness, private allelic richness, effective alleles, Shannon’s information index, observed heterozygosity and inbreeding coefficient. The correla-tion analysis was performed using SPSS version 22. A sig-nificance level at P < 0.05 was set for all statistical tests, and the sequential Bonferroni correction [53] was used when significant correlations were detected between the paired data.
Results
Detection of Ae. albopictus cryptic species and Wolbachia
infection
No Ae. albopictus cryptic species was detected in the samples collected from Guangxi Province. The cox1 hap-lotype was identical with the sequences on GenBank (KY765450, KY765452 and KY765455). All the samples showed positive infection of Wolbachia with type A and/ or type B. The majority of samples (> 93%) were infected with type A and type B together, only a few samples were infected with type A (5.1%) or type B (1.6%) (Additional file 1: Table S1).
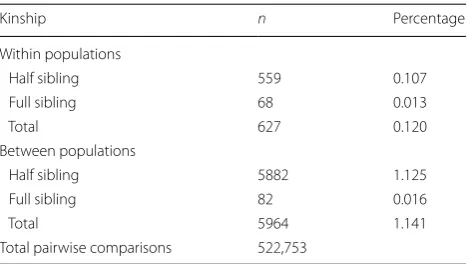
(Table 1). We compared the detailed pairwise relatedness of all specimens within and between populations (Addi-tional file 2: Table S2). Genetic relatedness of full sibling among individuals within population were observed in 16 out of the 34 Ae. albopictus populations with high proportion of kinship in Wuzhou, Beijing and Shenyang populations. Full sibling relationships were also found among 32 (94%) of the 34 Ae. albopictus populations with the highest proportion of kinship between Beijing and Shenyang. There were 559 pairs (0.107%) of half siblings and 68 pairs (0.013%) of full siblings among individual within populations, and 5882 pairs (1.125%) of half sib-lings and 82 pairs (0.016%) of full sibsib-lings among indi-viduals between populations (Table 2). We excluded 46 samples of full siblings in collection sites and used the data from 977 Ae. albopictus specimens to conduct fur-ther analysis. In total, 153 alleles were obtained. All loci were polymorphic, showing several distinct alleles rang-ing from eight (Aealbmic9) to sixteen (ALB-TRI-6) with an average of 11.769 per locus (Table 2). Micro-Checker results suggest that locus Aealbmic12 has a high prob-ability of null alleles, as its estimated null allele frequency is 0.317 calculated by Brookfield’s method [54]. There is no evidence of null alleles for loci Aealbmic9, Aealbmic8, Aealbmic6, ALB-DI-6 and ALB-TRI-33 (Table 2). The remaining loci exhibited signs of having null alleles, but their estimated frequency was lower than 0.200 (Table 2). PIC was high, with values ranging from 0.447 (ALB-DI-4) to 0.846 (ALB-TRI-6) (mean value 0.691) (Table 2). Shan-non’s information index was consistent with PIC, rang-ing from 0.880 (ALB-DI-4) to 1.973 (ALB-TRI-6) (mean value of 1.645) (Table 2). Among the 442 pairs tested for Hardy–Weinberg equilibrium (HWE) at each locus per population site after Bonferroni corrections, 158 pairs significantly departed from HWE (P < 0.05), where 146 of these significant departures indicated heterozygosity deficits (Additional file 3: Table S3). No locus-by-locus
pair showed significance consistently across all locations, though 165 of 2652 (6.22%) pairs tested for linkage dis-equilibrium (LD) remained significant (Additional file 4: Table S4). Fifty-three (11.99%) pairs tested for HWE lost the significance after Bonferroni corrections, so did the 161 (6.07%) pairs tested for LD.
The genetic diversity and difference analysis of Ae. albopictus showed that the mean number of alleles per locus at each location ranged from 5.308 (SY) to 9.000 (LS), with an average of 6.912, and the allelic richness ranged from 4.327 (SY) to 7.561 (LS), with an average of 5.995 (Additional file 5: Table S5). Allelic richness increased as the sample size increased (Additional file 6: Figure S1). The Ho values for each locus ranged from 0.394 (ALB-DI-4) to 0.775 (Aealbmic9), and the He val-ues for each locus ranged from 0.456 (Aealbmic6) to 0.824 (ALB-TRI-6) (Table 3). The Ho values for each loca-tion ranged from 0.501 (QZ) to 0.690 (SZ), and the He
values for each location ranged from 0.619 (SY) to 0.763 (LS) (Additional file 5: Table S5). Except in the location SZ, the He values were higher than the Ho values in all locations. Using the TPM model, tests for recent popu-lation bottlenecks based on gene diversity and allele fre-quency distribution were not significant, except in the SJZ population (Additional file 5: Table S5).
Genetic structure and differentiation
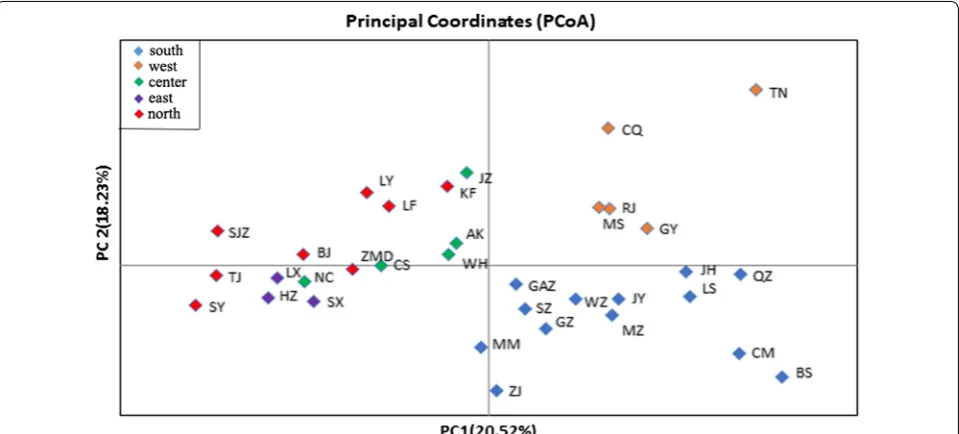
[image:6.595.57.291.583.715.2]Based on Bayesian clustering analysis and the Delta K method, each population in this study was assigned to one of two genetically differentiated groups (K = 2, Additional file 7: Figure S2a), which splits southern and western China from a group comprising the eastern, cen-tral and northern populations (Fig. 2a). Some admixture was observed between the groups. A further independ-ent Bayesian clustering analysis and higher resolution were obtained by analyzing the structure plot for the two groups. In the first group, the southern popula-tions can be separated from the western populapopula-tions at K = 2 (Fig. 2b, Additional file 7: Figure S2b). In the sec-ond group, the central, eastern, central northern, and northern clusters were divided at K = 3 (Fig. 2c, Addi-tional file 7: Figure S2c). Additionally, the results of prin-cipal coordinates analysis (Fig. 3) illustrated the genetic similarities among different populations in each region, which was similar to the results from STRU CTU RE. Based on these results, we divided the 34 populations into five clusters: southern (LS, QZ, BS, CM, ZJ, MM, JH, SZ, GZ, JY, MZ, GAZ, WZ), western (RJ, GY, CQ, TN, MS), central (CS, NC, WH, JZ, AK), eastern (LX, SX, HZ), and northern (ZMD, KF, LY, LF, SJZ, TJ, BJ, SY). The AMOVA results (Table 4) indicate that the majority of the variation in Ae. albopictus was found among individ-uals and individindivid-uals within populations, accounting for
Table 2 Genetic relatedness between samples in Ae. albopictus population
Abbreviation: n, number of comparisons
Kinship n Percentage
Within populations
Half sibling 559 0.107
Full sibling 68 0.013
Total 627 0.120
Between populations
Half sibling 5882 1.125
Full sibling 82 0.016
Total 5964 1.141
83.16% and 14.21% of the variation, respectively, while variations among groups and populations within groups accounted for only 1.30% and 1.32% of the total variation, respectively. Fisher’s exact test showed that there was sig-nificant genetic variation at these four levels.
The pairwise FST values of Ae. albopictus ranged from
0.005 to 0.049, with 500 out of 561 (89.13%) FST values
showing significant genetic differentiation and one losing
the significance after Bonferroni correction (Additional file 8: Table S6). However, the gene flow calculated by FST
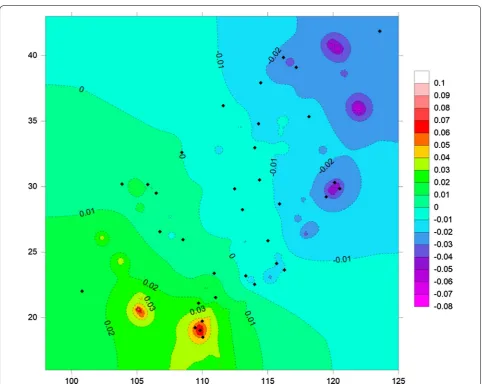
[image:7.595.58.542.100.302.2]showed that the minimum value of Nm between popu-lations is 4.88 (Additional file 8: Table S6), suggesting strong gene flow. The genetic landscape shape analysis identified major potential gene flow barriers (Fig. 4). The high peaks of differentiation were found in southern and southwestern China, and low genetic differentiation was
Table 3 Genetic indices for genetic markers of Ae. albopictus from China
Abbreviations: PIC, polymorphic information content; SI, Shannonʼs index; Ho, observed heterozygosity; He, expected heterozygosity
Locus No. of alleles Estimated null allele
frequency PIC SI Ho He
Aealbmic9 8 – 0.642 1.309 0.775 0.672
Aealbmic10 9 0.137 0.547 1.051 0.573 0.586
Aealbmic8 11 – 0.816 1.785 0.761 0.809
Aealbmic12 11 0.317 0.819 1.850 0.574 0.812
Aealbmic6 10 – 0.453 0.947 0.462 0.456
Aealbmic5 14 0.108 0.661 1.364 0.570 0.667
Aealbmic16 15 0.102 0.716 1.591 0.599 0.708
ALB-TRI-6 16 0.091 0.846 1.973 0.629 0.824
ALB-DI-6 13 – 0.744 1.569 0.485 0.743
ALB-DI-4 9 0.139 0.447 0.880 0.394 0.466
Aealbmic3 14 0.154 0.815 1.846 0.664 0.791
ALB-TRI-33 10 – 0.722 1.451 0.721 0.721
Aealbmic11 13 0.122 0.752 1.560 0.544 0.744
Mean 11.769 0.691 1.475 0.596 0.692
Fig. 2 Genetic structure of Ae. albopictus within 34 locations. Each vertical bar in the plots represents an individual sample and each color represents a cluster, where the color of the bar indicates the probability of assignment to each of K optimal clusters (different colors) determined
using Evanno et al.’s ΔK methods. a K = 2 for all populations. b K = 2 for 18 populations in southern and western areas. c K = 3 for 16 populations in
[image:7.595.59.539.340.556.2]detected among populations in the eastern and northern regions (Fig. 4). The Mantel test showed statistically sig-nificant correlation (R2 = 0.245, P = 0.01) between the
genetic distance (estimated as FST/(1 − FST)) and
geo-graphical distance (estimated as Ln (km)) between popu-lations (Fig. 5, Additional file 9: Table S7).
Correlation between population genetic indices and dengue incidence
In order to explore the association between genetic struc-ture and vector-borne disease, we conducted Pearsonʼs correlation analysis of six genetic indices and annual dengue incidence from 2011 to 2015 in different prov-inces (Table 5). Allelic richness (r = 0.530, P = 0.020) and private allelic richness (r = 0.551, P = 0.015) showed a positive correlation with dengue incidence after log-transformations. However, the significance was lost after the Bonferroni correction for multiple testing (adjusted P-value < 0.00238). Shannon’s information
index (r = 0.455, P = 0.051), effective alleles (r = 0.353,
P = 0.139), observed heterozygosity (r = 0.210,
P = 0.388) and inbreeding coefficient (r = 0.089,
P = 0.717) showed no statistically significant correlation
to dengue incidence after log transformations.
Discussion
[image:8.595.59.539.88.305.2]Few studies have reported the population structure and genetic diversity of Ae. albopictus in China, and they have focused on using mitochondrial DNA markers to analyze genetic diversity, regional structure, mainly in popula-tions in southern China, or they have used a limited sam-pling size [31, 55]. For example, Guo et al. [31] sequenced the mitochondrial DNA cytochrome c oxidase subunit 1 (cox1) gene of 140 Ae. albopictus from 14 populations in southern China, and Zhang et al. [55] sequenced cox1 of 119 Ae. albopictus from 17 populations in China. The results of these studies showed low genetic diversity and Fig. 3 Principal coordinates analysis based on co-dominant genotypic genetic distance, displaying genetic similarities among populations of Ae. albopictus sampled from different regions in China
Table 4 Analysis of molecular variance of populations from seven different clusters
Abbreviations: df, degrees of freedom
Source of variation df Sum of squares Variance
components Percentage of variation P-value Fixation index
Among groups 4 121.507 0.060 1.30 P < 0.0001 FCT= 0.013
Among populations within groups 29 250.076 0.061 1.32 P < 0.0001 FSC= 0.013
Among individuals within populations 943 4837.406 0.653 14.21 P < 0.0001 FIS= 0.146
Within individuals 977 3735.000 3.823 83.16 P < 0.0001 FIT= 0.168
[image:8.595.57.536.377.468.2]shallow genetic differentiation between some of the study populations. In the present study we included many new study sites and populations, such as those in the northern (SY, SJZ, TJ), western (MS, TN), and central areas (WH, JZ), etc. The 34 collecting sites were widely distributed, providing comprehensive information on the population structure of Ae. albopictus throughout China. The corre-lation of average allele richness and sample size showed that when sample size < 15, allele richness increased rap-idly as sample size increased, whereas it increased only slightly when sample size > 25. The number of samples in most populations was within the optimum range (25–30) [56]. The mean number of alleles per locus and the allelic richness were higher in southern populations than in northern populations, and the diversity of alleles gradually decreased from south to north. The climate in northern temperate areas may affect the life traits of Ae.
albopictus. The period in which the climate is suitable for mosquito survival is longer in southern subtropical areas than in northern areas. The relatively low temperatures and dry climate in the north may not be suitable for mos-quito survival, reproduction, and dispersal, resulting in lower allele richness and population diversity in northern populations [57, 58].
[image:9.595.57.540.83.467.2]< 0.2 has no significant effect on the accuracy of data analysis, and its effect on genetic diversity and genetic structure may be even less [64, 65]. In our study, null allele frequency was < 0.2 or absent, except at locus Aeal-bmic12. Expected heterozygosity is a common parameter for measuring the genetic polymorphism of a popula-tion [66]. Takezaki & Nei [67] suggested that an expected microsatellite heterozygosity between 0.5–0.8 indicates that the population genetic polymorphism is high. In the present study, the expected heterozygosity in all popula-tions was between 0.6–0.8, and most were higher than the observed heterozygosity, indicating a deficit of het-erozygosity except in the SZ and SY populations [68]. Insecticides have been used frequently in some areas, and fragmentation of habitats can intensify inbreeding within small populations, leading to a heterozygosity deficit. For bottleneck testing, we used the two-phase mutation (TPM) model, which is considered the best-fit for micro-satellite data [44]. Our bottleneck test results indicated that only the SJZ population may have experienced a temporary bottleneck; this may be related to the wide use of insecticides [69] or sharp climatic changes [70] in the local area causing a decline in local populations.
Our results showed that FST-values in all pairwise
populations were not high, but most were significantly different, indicating genetic differentiation between populations. The low genetic distance and pairwise FST
may be related to the fact that most of the study sites
are central cities in their provinces and transportation between them is convenient. Jinghong, a busy tourist des-tination close to the Southeast Asian countries, connects to many cities via highways and airways but has no trains or high-speed rail, which explains the relatively high pairwise FST between Jinghong and other cities. Low FST
-values with no significant difference may be attributed to the close distance, convenient transportation, high traffic, and similar environmental conditions between popula-tions [71]. China is home to an ancestral population of
Ae. albopictus, and most populations in China have been stable for a long time [22]. Nm > 1 indicates that a popu-lation is sufficient to prevent the occurrence of genetic differentiation [72]. Our results showed strong gene flow between populations, which can reduce genetic differ-entiation. The results of genetic relatedness showed the individuals among different collection sites with long dis-tance had different degrees of kinship, indicating poten-tial human-aided dispersal of Ae. albopictus across the country. Extensive mosquito dispersal, probably aided by human transportation between these regions, also helps explain the low differentiation and the possible clustering between different regions.
There is some limitation for microsatellites compared to SNPs, the third generation DNA markers. Weaker sep-aration between populations was usually obtained with microsatellites compared to SNPs. A total of 934 SNPs showed stronger power in distinguishing closely related Fig. 5 Correlation between genetic distance [FST/(1 − FST)] and geographical distance [Ln (km)] for all locations in China. The relationship was
[image:10.595.59.540.88.326.2]individuals at a small spatial scale than 8 microsatellites in Ae. aegypti populations [73]. A total of 2185 SNPs out-performed nine highly variable microsatellites in parent-age and kinship assignment in An. darlingi populations, and the conventional approaches based on microsatellites may underestimate overall genetic distances in closely related vector populations [74]. The pairwise FST or the
degree of differentiation in the present study may be smaller for microsatellites than if SNPs have been used. Therefore, we might overestimate the gene flow between populations through the analysis of microsatellites. Mitochondrial DNA has been widely used for the study of molecular taxonomy, phylogenetic relationships and population genetics in mosquitoes [75–77]. However, microsatellites outperformed mtDNA in assessing spa-tial genetic structures. Only microsatellites not mtDNA showed small but positive and significant isolation-by-distance patterns in An. sinensis populations [78]. No genetic structure was detected through mtDNA data while a high level of genetic structure was detected using the microsatellite markers inside polymorphic inver-sions in An. arabiensis populations [79]. Guo et al. [31]
discovered the cryptic species in Wuzhou using mito-chondrial DNA cytochrome c oxidase subunit 1 (cox1) gene to analyze population genetics of Ae. albopictus in southern China. We also have collected Ae. albopictus
population from a different village in Wuzhou, but we did not find any individual belonging to a cryptic species by
cox1 sequencing. One of the possible reasons might be due to location-specific or seasonal abundance features of the cryptic species.
[image:11.595.54.543.100.396.2]The spread of dengue fever has been affected not only by the climate (e.g. temperature, rainfall, relative humid-ity and sunshine) [80, 81], but also by the vector indices (e.g. container, house, Breteau, pupal or adult indices) and genetic factors of the populations [82–84]. Aedes aegypti population from French Polynesia was more susceptible to infection and had higher ability to trans-mit DENV-1 than Ae. aegypti population from New Caledonia in the same experimental environment [84]. The genetic background of mosquito populations could influence the vector competence of mosquitoes, and the genetic indices can be utilized as a potential predictor of local dengue epidemiology [85]. The six genetic indices
Table 5 The correlation of dengue incidence with six genetic indices among Ae. albopictus populations in different provinces
a From 2011 to 2015 (per 100,000,000 persons)
b The annual dengue case data was rescaled with a log transformation using the equation Ln (µ), where µ is the number of cases per 100,000,000 people
Abbreviations: Ne, effective number of alleles; SI, Shannonʼs index; Ho, observed heterozygosity; FIS, inbreeding coefficient
Province Allelic richness Private allelic
richness Ne SI Ho FIS Annual dengue casesa
Hainan 7.171 0.181 4.754 1.748 0.548 0.278 56
Guangdong 6.453 0.047 3.983 1.559 0.633 0.093 9541
Yunnan 7.263 0.418 4.718 1.682 0.592 0.204 1548
Guangxi 6.183 0.094 3.542 1.459 0.591 0.152 371
Guizhou 6.106 0.005 3.784 1.487 0.577 0.159 3
Chongqing 6.530 0.029 4.485 1.586 0.647 0.081 42
Sichuan 6.320 0.016 4.000 1.530 0.561 0.214 20
Hunan 5.506 0.025 3.539 1.359 0.518 0.209 37
Jiangxi 6.379 0.090 3.982 1.539 0.553 0.195 16
Hubei 5.994 0.052 3.949 1.490 0.546 0.213 23
Shanxi (west) 5.579 0.000 3.657 1.394 0.644 0.028 11
Zhejiang 5.704 0.129 3.678 1.409 0.628 0.018 59
Henan 6.134 0.094 3.981 1.530 0.658 0.059 17
Shandong 5.811 0.002 3.917 1.447 0.582 0.136 9
Shanxi (east) 5.697 0.011 3.785 1.422 0.551 0.183 1
Hebei 5.827 0.001 3.855 1.434 0.564 0.133 8
Tianjin 5.713 0.002 3.435 1.359 0.633 0.031 4
Beijing 5.653 0.000 3.455 1.379 0.600 0.076 69
Liaoning 4.904 0.001 3.183 1.236 0.597 0.001 7
Pearson’s correlation
coefficientb 0.530 0.551 0.353 0.455 0.210 0.089
are the main indices of population genetics, which could directly reflect the actual genetic variability and diver-sity of local mosquitoes. But they were not significantly correlated with dengue incidence during 2011–2015. One possible reason might be that dengue outbreaks are mainly affected by climate and environment rather than genetic background of Ae. albopictus population in China. The other one might be that dengue incidence is associated with other genetic indices or other genetic markers rather than the six indices from 13 microsatel-lites in this study. One genetic index, the inbreeding coefficient (FIS) might be expected to show significant
positive correlation to dengue incidence, due to the ver-tical transmission of dengue virus to mosquito offspring [86, 87]. This natural transovarial transmission process has been demonstrated in field-collected Ae. aegypti
mosquitoes from some different areas [88–90]. The rate of vertical transmission initially increased in the few gen-erations (F1–F2) of Ae. aegypti mosquitoes, and in subse-quent generations it was found to be steady until at least the 7th generation through the inbreeding of each gen-eration [91]. We inferred that the inbreeding within the mosquito population might lead to a substantial number of offspring carrying the dengue virus and an increased disease transmission within local areas. Inbreeding coef-ficient has been found to be positively associated with dengue incidence in Ae. aegypti populations [85]. How-ever, our study detected no significant correlation. One plausible explanation is that the amount of viral infection in the mosquitoes collected in our study is not enough to spread vertically to offspring. In addition, the endosym-biotic bacteria Wolbachia existing in Ae. albopictus, not in Ae. aegypti naturally, has a blocking effect on the verti-cal transmission of dengue virus [92, 93]. Although the specific mechanism of Wolbachia inhibiting dengue virus is unclear, the cytoplasmic incompatibility (CI) induced by Wolbachia can reduce the mosquito populations [94], and Wolbachia can induce density-dependent inhibition to dengue virus in mosquito cells [95]. At present, mos-quitoes transfected with Wolbachia have been applied in the control of mosquitoes and mosquito-borne dis-eases [96, 97]. The application would change the popu-lation structure and genetic indices of local mosquitoes, and it would require our monitoring. Further research is needed to ascertain on whether these genetic indices could be supplementary indices for the prediction of the local dengue epidemiology.
Conclusions
This study reported not only the spatial genetic struc-ture of Ae. albopictus but also the correlation of genetic indices with dengue incidence. Our results may have implications for predicting future dengue outbreaks
and understanding the epidemiology, prevention and control of vector-borne diseases. Strong gene flow probably assisted by human activities inhibited popu-lation differentiation and promoted genetic diversity among Ae. albopictus populations. This may repre-sent a potential risk of rapid spread of mosquito-borne diseases. The data collected in this study, combined with other related factors such as climate, rainfall and human activities, will be valuable for vector con-trol efforts as well as epidemiological prediction and modeling of the incidence and spread of vector-borne diseases.
Supplementary information
Supplementary information accompanies this paper at https ://doi. org/10.1186/s1307 1-019-3801-4.
Additional file 1: Table S1. The Wolbachia infection status in populations. Additional file 2: Table S2. The pairwise genetic relatedness between individuals.
Additional file 3: Table S3. Analysis of Hardy–Weinberg equilibrium. Additional file 4: Table S4. Analysis of linkage disequilibrium. Additional file 5: Table S5. Genetic indices of 34 populations.
Additional file 6: Figure S1. Average allele richness of microsatellite loci in 34 populations.
Additional file 7: Figure S2. Scatter plots of Log probability of the data (Left) and Delta K (Right) for Ae. albopictus populations. Delta K plots are based on the rate of change in the log probability of the data between successive K values. a All populations. b 18 populations in southern and western areas. c 16 populations in central, eastern, central northern, and northern areas.
Additional file 8: Table S6. FST and Nm between 34 populations.
Additional file 9: Table S7. Genetic distance and geographical distance between 34 populations.
Abbreviations
AMOVA: analysis of molecular variance; PIC: polymorphic information content; SI: Shannonʼs index; HWE: Hardy–Weinberg equilibrium; LD: linkage disequilibrium.
Acknowledgements
We would like to thank Yuanhuan Wei, Ke Hu, Yulan Chen, Hao Zhang, Guangsheng Qiu, Weihao Zou, Yan Sun, Yijie Zhao, Denghua Wei, Weigui Ni, Jiayan Xie, Tianrenzheng Zhu and Yueyi Feng for their assistance in collecting mosquito samples from different provinces.
Authors’ contributions
YW, XZ, DZ and GZ conceived and designed the experiments. YW, JW, ZS, YH, ZZ, PF and DY performed the experiments. YW and DZ analyzed the data. YW, XZ, DZ and GZ wrote and revised the manuscript. All authors read and approved the final manuscript.
Funding
This work was supported by the National Natural Science Foundation of China (No. 31630011) and the Science and Technology Planning Project of Guang-zhou (No. 201804020084).
Availability of data and materials
Ethics approval and consent to participate
No specific permits were required for the field studies. After explanation of the purposes and activities of the study, oral consent was obtained from the local participating residents prior to mosquito collection. No sites were protected by law and this study did not involve endangered or protected species.
Consent for publication Not applicable.
Competing interests
The authors declare that they have no competing interests.
Author details
1 Department of Pathogen Biology, School of Public Health, Southern Medical
University, Guangzhou, China. 2 Program in Public Health, College of Health
Sciences, University of California, Irvine, USA.
Received: 27 June 2019 Accepted: 10 November 2019
References
1. Paupy C, Delatte H, Bagny L, Corbel V, Fontenille D. Aedes albopictus, an arbovirus vector: from the darkness to the light. Microbes Infect. 2009;11:1177–85.
2. Adhami J, Reiter P. Introduction and establishment of Aedes (Stegomyia)
albopictus Skuse (Diptera: Culicidae) in Albania. J Am Mosq Control Assoc.
1998;14:340–3.
3. Sprenger D, Wuithiranyagool T. The discovery and distribution of
Aedes albopictus in Harris County, Texas. J Am Mosq Control Assoc.
1986;2:217–9.
4. Forattini OP. Identification of Aedes (Stegomyia) albopictus (Skuse) in Brazil. Rev Saude Publica. 1986;20:244–5.
5. Laille M, Fauran P, Rodhain F. The presence of Aedes (Stegomyia) albopic-tus in the Fiji Islands. Bull Soc Pathol Exot. 1990;83:394–8.
6. Savage HM, Ezike VI, Nwankwo AC, Spiegel R, Miller BR. First record of breeding populations of Aedes albopictus in continental Africa: implica-tions for arboviral transmission. J Am Mosq Control Assoc. 1992;8:101–3. 7. Poelchau MF, Reynolds JA, Denlinger DL, Elsik CG, Armbruster PA.
Tran-scriptome sequencing as a platform to elucidate molecular components of the diapause response in the Asian tiger mosquito Aedes albopictus. Physiol Entomol. 2013;38:173–81.
8. Jia P, Chen X, Chen J, Lu L, Liu Q, Tan X. How does the dengue vector mosquito Aedes albopictus respond to global warming? Parasites Vectors. 2017;10:140.
9. Li Y, Xu J, Zhong D, Zhang H, Yang W, Zhou G, et al. Evidence for multiple-insecticide resistance in urban Aedes albopictus populations in southern China. Parasites Vectors. 2018;11:4.
10. Gratz NG. Critical review of the vector status of Aedes albopictus. Med Vet Entomol. 2004;18:215–27.
11. Goubert C, Minard G, Vieira C, Boulesteix M. Population genetics of the Asian tiger mosquito Aedes albopictus, an invasive vector of human diseases. Heredity. 2016;117:125–34.
12. Qiu FX, Gubler DJ, Liu JC, Chen QQ. Dengue in China: a clinical review. Bull World Health Organ. 1993;71:349–59.
13. Sang S, Gu S, Bi P, Yang W, Yang Z, Xu L, et al. Predicting unprecedented dengue outbreak using imported cases and climatic factors in Guang-zhou, 2014. PLoS Negl Trop Dis. 2015;9:e0003808.
14. Wu F, Liu Q, Lu L, Wang J, Song X, Ren D. Distribution of Aedes albopictus (Diptera: Culicidae) in northwestern China. Vector Borne Zoonotic Dis. 2011;11:1181–6.
15. Lu L, Lin H, Tian L, Yang W, Sun J, Liu Q. Time series analysis of dengue fever and weather in Guangzhou, China. BMC Public Health. 2009;9:395. 16. Guo YH, Lai SJ, Liu XB, Li GC, Yu HJ, Liu QY. Governmental supervision and
rapid detection on dengue vectors: an important role for dengue control in China. Acta Trop. 2016;156:17–21.
17. Li R, Xu L, Bjornstad ON, Liu K, Song T, Chen A, et al. Climate-driven variation in mosquito density predicts the spatiotemporal dynamics of dengue. Proc Natl Acad Sci USA. 2019;116:3624–9.
18. Liu QY, Guo YH. Coexistence of Aedes aegypti and Aedes albopictus in Jinghong City, Yunnan Province: a survey of Aedes aegypti invasion. J Trop Dis. 2016;04:1–6.
19. Jing Q, Wang M. Dengue epidemiology. Glob Health J. 2019;3:37–45. 20. Rezza G. Aedes albopictus and the reemergence of dengue. BMC Public
Health. 2012;12:72.
21. Robert MA, Christofferson RC, Silva NJ, Vasquez C, Mores CN, Wearing HJ. Modeling mosquito-borne disease spread in U.S. urbanized areas: the case of dengue in Miami. PLoS ONE. 2016;11:e0161365.
22. Manni M, Guglielmino CR, Scolari F, Vega-Rua A, Failloux AB, Somboon P, et al. Genetic evidence for a worldwide chaotic dispersion pattern of the arbovirus vector, Aedes albopictus. PLoS Negl Trop Dis. 2017;11:e0005332. 23. Guillemaud T, Beaumont MA, Ciosi M, Cornuet JM, Estoup A. Inferring
introduction routes of invasive species using approximate Bayesian computation on microsatellite data. Heredity. 2010;104:88–99. 24. Goldstein DB, Pollock DD. Launching microsatellites: a review of
muta-tion processes and methods of phylogenetic interference. J Hered. 1997;88:335–42.
25. Powell W, Morgante M, Andre C, Hanafey M, Vogel J, Tingey S, et al. The comparison of RFLP, RAPD, AFLP and SSR (microsatellite) markers for germplasm analysis. Mol Breed. 1996;2:225–38.
26. Maynard AJ, Ambrose L, Cooper RD, Chow WK, Davis JB, Muzari MO, et al. Tiger on the prowl: invasion history and spatio-temporal genetic structure of the Asian tiger mosquito Aedes albopictus (Skuse, 1894) in the Indo-Pacific. PLoS Negl Trop Dis. 2017;11:e0005546.
27. Beebe NW, Ambrose L, Hill LA, Davis JB, Hapgood G, Cooper RD, et al. Tracing the tiger: population genetics provides valuable insights into the
Aedes (Stegomyia) albopictus invasion of the Australasian Region. PLoS
Negl Trop Dis. 2013;7:e2361.
28. Oliveira DC, Raychoudhury R, Lavrov DV, Werren JH. Rapidly evolving mitochondrial genome and directional selection in mitochondrial genes in the parasitic wasp Nasonia (Hymenoptera: Pteromalidae). Mol Biol Evol. 2008;25:2167–80.
29. Sun JT, Jin PY, Hoffmann AA, Duan XZ, Dai J, Hu G, et al. Evolutionary divergence of mitochondrial genomes in two Tetranychus species distrib-uted across different climates. Insect Mol Biol. 2018;27:698–709. 30. Krzywinski J, Li C, Morris M, Conn JE, Lima JB, Povoa MM, et al. Analysis of
the evolutionary forces shaping mitochondrial genomes of a Neotropical malaria vector complex. Mol Phylogenet Evol. 2011;58:469–77. 31. Guo Y, Song Z, Luo L, Wang Q, Zhou G, Yang D, et al. Molecular evidence
for new sympatric cryptic species of Aedes albopictus (Diptera: Culicidae) in China: a new threat from Aedes albopictus subgroup? Parasites Vectors. 2018;11:228.
32. Manni M, Gomulski LM, Aketarawong N, Tait G, Scolari F, Somboon P, et al. Molecular markers for analyses of intraspecific genetic diversity in the Asian tiger mosquito, Aedes albopictus. Parasites Vectors. 2015;8:188. 33. Hulce D, Li X, Snyder-Leiby T, Liu CSJ. GeneMarker® genotyping software:
tools to increase the statistical power of DNA fragment analysis. J Biomol Tech. 2011;22:S35.
34. Lynch M, Ritland K. Estimation of pairwise relatedness with molecular markers. Genetics. 1999;152:1753–66.
35. Queller DC, Goodnight KF. Eestimating relatedness using genetic mark-ers. Evolution. 1989;43:258–75.
36. Peakall R, Smouse PE. GenAlEx 6.5: genetic analysis in Excel. Population genetic software for teaching and research—an update. Bioinformatics. 2012;28:2537–9.
37. Slatkin M. Isolation by distance in equilibrium and non-equilibrium popu-lations. Evolution. 1993;47:264–79.
38. Shaibi T, Lattorff HMG, Moritz RFA. A microsatellite DNA toolkit for study-ing population structure in Apis mellifera. Mol Ecol Resour. 2008;8:1034–6. 39. Van Oosterhout C, Hutchinson WF, Wills DPM, Shipley P. Micro-checker:
software for identifying and correcting genotyping errors in microsatel-lite data. Mol Ecol Notes. 2004;4:535–8.
40. Szpiech ZA, Jakobsson M, Rosenberg NA. ADZE: a rarefaction approach for counting alleles private to combinations of populations. Bioinformat-ics. 2008;24:2498–504.
41. Rousset F. Genepop’007: a complete re-implementation of the genepop software for Windows and Linux. Mol Ecol Resour. 2008;8:103–6. 42. Raymond M, Rousset F. Genepop (version 1.2): population genetics
43. Excoffier L, Lischer HEL. Arlequin suite ver 3.5: a new series of programs to perform population genetics analyses under Linux and Windows. Mol Ecol Resour. 2010;10:564–7.
44. Di Rienzo A, Peterson AC, Garza JC, Valdes AM, Slatkin M, Freimer NB. Mutational processes of simple-sequence repeat loci in human popula-tions. Proc Natl Acad Sci USA. 1994;91:3166–70.
45. Piry S, Luikart G, Cornuet J. BOTTLENECK: a computer program for detect-ing recent reductions in the effective size usdetect-ing allele frequency data. J Hered. 1999;90:502–3.
46. Miller MP. Alleles in space (AIS): computer software for the joint analysis of interindividual spatial and genetic information. J Hered. 2005;96:722–4. 47. Zheng S, Li S, Huang L, Chen Y. Visualization programming for batch
processing of contour maps based on VB and Surfer software. Adv Eng Softw. 2010;41:962–5.
48. Pritchard JK, Stephens M, Donnelly P. Inference of population structure using multilocus genotype data. Genetics. 2000;155:945–59. 49. Evanno G, Regnaut S, Goudet J. Detecting the number of clusters of
individuals using the software STRU CTU RE: a simulation study. Mol Ecol. 2005;14:2611–20.
50. Earl DA, Vonholdt BM. Structure Harvester: a website and program for visualizing STRU CTU RE output and implementing the Evanno method. Conserv Genet Resour. 2012;4:359–61.
51. Jakobsson M, Rosenberg NA. CLUMPP: a cluster matching and permuta-tion program for dealing with label switching and multimodality in analysis of population structure. Bioinformatics. 2007;23:1801–6. 52. Rosenberg NA. DISTRUCT: a program for the graphical display of
popula-tion structure. Mol Ecol Notes. 2004;4:137–8.
53. Rice WR. Analyzing tables of statistical tests. Evolution. 1989;43:223–5. 54. Brookfield JF. A simple new method for estimating null allele frequency
from heterozygote deficiency. Mol Ecol. 1996;5:453–5.
55. Ruiling Z, Peien L, Xuejun W, Zhong Z. Molecular analysis and genetic diversity of Aedes albopictus (Diptera, Culicidae) from China. Mitochon-drial DNA A DNA Mapp Seq Anal. 2018;29:594–9.
56. Hale ML, Burg TM, Steeves TE. Sampling for microsatellite-based popula-tion genetic studies: 25 to 30 individuals per populapopula-tion is enough to accurately estimate allele frequencies. PLoS ONE. 2012;7:e45170. 57. Shapiro LLM, Whitehead SA, Thomas MB. Quantifying the effects of
tem-perature on mosquito and parasite traits that determine the transmission potential of human malaria. PLoS Biol. 2017;15:e2003489.
58. Santos J, Meneses BM. An integrated approach for the assessment of
the Aedes aegypti and Aedes albopictus global spatial distribution, and
determination of the zones susceptible to the development of Zika virus. Acta Trop. 2017;168:80–90.
59. Lehmann T, Hawley WA, Collins FH. An evaluation of evolution-ary constraints on microsatellite loci using null alleles. Genetics. 1996;144:1155–63.
60. Paetkau D, Strobeck C. The molecular basis and evolutionary history of a microsatellite null allele in bears. Mol Ecol. 1995;4:519–20.
61. Lehmann T, Besansky NJ, Hawley WA, Fahey TG, Kamau L, Collins FH. Microgeographic structure of Anopheles gambiae in western Kenya based on mtDNA and microsatellite loci. Mol Ecol. 1997;6:243–53.
62. Meglecz E, Petenian F, Danchin E, D’Acier AC, Rasplus JY, Faure E. High similarity between flanking regions of different microsatellites detected within each of two species of Lepidoptera: Parnassius apollo and
Euphy-dryas aurinia. Mol Ecol. 2004;13:1693–700.
63. Chapuis MP, Loiseau A, Michalakis Y, Lecoq M, Estoup A. Characterization and PCR multiplexing of polymorphic microsatellite loci for the locust
Locusta migratoria. Mol Ecol Notes. 2005;5:554–7.
64. Chapuis MP, Estoup A. Microsatellite null alleles and estimation of popula-tion differentiapopula-tion. Mol Biol Evol. 2007;24:621–31.
65. Dakin EE, Avise JC. Microsatellite null alleles in parentage analysis. Hered-ity. 2004;93:504–9.
66. Gutiérrez-Espeleta GA, Kalinowski ST, Boyce WM, Hedrick PW. Genetic variation and population structure in desert bighorn sheep: implications for conservation. Conserv Genet. 2000;1:3–15.
67. Takezaki N, Nei M. Genetic distances and reconstruction of phylogenetic trees from microsatellite DNA. Genetics. 1996;144:389–99.
68. Weir BS, Cockerham CC. Estimating F-statistics for the analysis of popula-tion structure. Evolupopula-tion. 1984;38:1358–70.
69. Wondji C, Simard F, Lehmann T, Fondjo E, Same-Ekobo A, Fontenille D. Impact of insecticide-treated bed nets implementation on the genetic
structure of Anopheles arabiensis in an area of irrigated rice fields in the Sahelian region of Cameroon. Mol Ecol. 2005;14:3683–93.
70. Mendonca BAA, de Sousa ACB, de Souza AP, Scarpassa VM. Temporal genetic structure of major dengue vector Aedes aegypti from Manaus, Amazonas, Brazil. Acta Trop. 2014;134:80–8.
71. Lehmann T, Hawley WA, Kamau L, Fontenille D, Simard F, Collins FH. Genetic differentiation of Anopheles gambiae populations from east and west Africa: comparison of microsatellite and allozyme loci. Heredity. 1996;77:192–200.
72. Slatkin M. Estimating levels of gene flow in natural populations. Genetics. 1981;99:323–35.
73. Rasic G, Filipovic I, Weeks AR, Hoffmann AA. Genome-wide SNPs lead to strong signals of geographic structure and relatedness patterns in the major arbovirus vector, Aedes aegypti. BMC Genomics. 2014;15:275. 74. Campos M, Conn JE, Alonso DP, Vinetz JM, Emerson KJ, Ribolla PE.
Microgeographical structure in the major neotropical malaria vector
Anopheles darlingi using microsatellites and SNP markers. Parasites
Vec-tors. 2017;10:76.
75. Pfeiler E, Flores-Lopez CA, Mada-Velez JG, Escalante-Verdugo J, Markow TA. Genetic diversity and population genetics of mosquitoes (Diptera: Culicidae: Culex spp.) from the Sonoran Desert of North America. Scienti-ficWorldJournal. 2013;2013:724609.
76. Saraiva JF, Souto RNP, Scarpassa VM. Molecular taxonomy and evolu-tionary relationships in the Oswaldoi-Konderi complex (Anophelinae:
Anopheles: Nyssorhynchus) from the Brazilian Amazon region. PLoS ONE.
2018;13:e0193591.
77. Kamgang B, Ngoagouni C, Manirakiza A, Nakoune E, Paupy C, Kazanji M. Temporal patterns of abundance of Aedes aegypti and Aedes albopictus (Diptera: Culicidae) and mitochondrial DNA analysis of Ae. albopictus in the Central African Republic. PLoS Negl Trop Dis. 2013;7:e2590. 78. Kang S, Jung J, Kim W. Population genetic structure of the malaria
vector Anopheles sinensis (Diptera: Culicidae) sensu stricto and evidence for possible introgression in the Republic of Korea. J Med Entomol. 2015;52:1270–81.
79. Temu EA, Yan G. Microsatellite and mitochondrial genetic differentiation
of Anopheles arabiensis (Diptera: Culicidae) from western Kenya, the Great
Rift Valley, and coastal Kenya. Am J Trop Med Hyg. 2005;73:726–33. 80. Sumi A, Telan EF, Chagan-Yasutan H, Piolo MB, Hattori T, Kobayashi N.
Effect of temperature, relative humidity and rainfall on dengue fever and leptospirosis infections in Manila, the Philippines. Epidemiol Infect. 2017;145:78–86.
81. Lai YH. The climatic factors affecting dengue fever outbreaks in southern Taiwan: an application of symbolic data analysis. Biomed Eng Online. 2018;17:148.
82. Bowman LR, Runge-Ranzinger S, McCall PJ. Assessing the relationship between vector indices and dengue transmission: a systematic review of the evidence. PLoS Negl Trop Dis. 2014;8:e2848.
83. Houe V, Bonizzoni M, Failloux AB. Endogenous non-retroviral elements in genomes of Aedes mosquitoes and vector competence. Emerg Microbes Infect. 2019;8:542–55.
84. Calvez E, Guillaumot L, Girault D, Richard V, O’Connor O, Paoaafaite T, et al. Dengue-1 virus and vector competence of Aedes aegypti (Diptera: Culici-dae) populations from New Caledonia. Parasites Vectors. 2017;10:381. 85. Carvajal TM, Ogishi K, Yaegeshi S, Hernandez LFT, Viacrusis KM, Ho HT,
et al. Fine-scale population genetic structure of dengue mosquito vector,
Aedes aegypti and its association to local dengue incidence. BioRxiv. 2019.
https ://doi.org/10.1101/56162 1. Accessed 28 Apr 2019.
86. Zou L, Chen J, Feng X, Ruan S. Analysis of a dengue model with vertical transmission and application to the 2014 dengue outbreak in Guang-dong Province, China. Bull Math Biol. 2018;80:2633–51.
87. Murillo D, Murillo A, Lee S. The role of vertical transmission in the control of dengue fever. Int J Environ Res Public Health. 2019;16:E803. 88. Gutierrez-Bugallo G, Rodriguez-Roche R, Diaz G, Vazquez AA, Alvarez M,
Rodriguez M, et al. First record of natural vertical transmission of dengue virus in Aedes aegypti from Cuba. Acta Trop. 2017;174:146–8.
89. Cruz LC, Serra OP, Leal-Santos FA, Ribeiro AL, Slhessarenko RD, Santos MA. Natural transovarial transmission of dengue virus 4 in Aedes aegypti from Cuiaba, State of Mato Grosso, Brazil. Rev Soc Bras Med Trop. 2015;48:18–25.
•fast, convenient online submission
•
thorough peer review by experienced researchers in your field
• rapid publication on acceptance
• support for research data, including large and complex data types
•
gold Open Access which fosters wider collaboration and increased citations maximum visibility for your research: over 100M website views per year
•
At BMC, research is always in progress.
Learn more biomedcentral.com/submissions
Ready to submit your research? Choose BMC and benefit from: of dark and pale forms of Aedes aegypti from an urban area of Bangkok,
Thailand. Southeast Asian J Trop Med Public Health. 2012;43:1146–52. 91. Joshi V, Mourya DT, Sharma RC. Persistence of dengue-3 virus through
transovarial transmission passage in successive generations of Aedes
aegypti mosquitoes. Am J Trop Med Hyg. 2002;67:158–61.
92. Ant TH, Herd CS, Geoghegan V, Hoffmann AA, Sinkins SP. The Wolbachia strain wAu provides highly efficient virus transmission blocking in Aedes
aegypti. PLoS Pathog. 2018;14:e1006815.
93. Pacidonio EC, Caragata EP, Alves DM, Marques JT, Moreira LA. The impact
of Wolbachia infection on the rate of vertical transmission of dengue
virus in Brazilian Aedes aegypti. Parasites Vectors. 2017;10:296.
94. Jiggins FM. The spread of Wolbachia through mosquito populations. PLoS Biol. 2017;15:e2002780.
95. Lu P, Bian G, Pan X, Xi Z. Wolbachia induces density-dependent inhibition to dengue virus in mosquito cells. PLoS Negl Trop Dis. 2012;6:e1754. 96. Hoffmann AA, Montgomery BL, Popovici J, Iturbe-Ormaetxe I, Johnson
PH, Muzzi F, et al. Successful establishment of Wolbachia in Aedes popula-tions to suppress dengue transmission. Nature. 2011;476:454–7. 97. Zheng X, Zhang D, Li Y, Yang C, Wu Y, Liang X, et al. Incompatible and
sterile insect techniques combined eliminate mosquitoes. Nature. 2019;572:56–61.
Publisher’s Note


![Fig. 5 Correlation between genetic distance [FST/(1 − FST)] and geographical distance [Ln (km)] for all locations in China](https://thumb-us.123doks.com/thumbv2/123dok_us/8313421.293709/10.595.59.540.88.326/fig-correlation-genetic-distance-geographical-distance-locations-china.webp)