Open Access
Research article
Estimation of Pap-test coverage in an area with an organised
screening program: challenges for survey methods
Paolo Giorgi Rossi*
1, Gennaro Esposito
2, Silvia Brezzi
2, Angela Brachini
2,
Patrizio Raggi
3and Antonio Federici
1Address: 1Agency for Public Health, Lazio Region, Rome Italy. Via di S. Costanza, 53, 00198, Rome, Italy, 2Viterbo Local Health Unit, Department
of Prevention. Viale Trento 40, Viterbo 10100, Italy and 3Ospedale Belcolle, Strada Sammarinese, Viterbo 10100, Italy
Email: Paolo Giorgi Rossi* - [email protected]; Gennaro Esposito - [email protected]; Silvia Brezzi - [email protected]; Angela Brachini - [email protected]; Patrizio Raggi - [email protected]; Antonio Federici - [email protected]
* Corresponding author
Abstract
Background: The cytological screening programme of Viterbo has completed the second round of invitations to the entire target population (age 25–64). From a public health perspective, it is important to know the Pap-test coverage rate and the use of opportunistic screening. The most commonly used study design is the survey, but the validity of self-reports and the assumptions made about non respondents are often questioned.
Methods: From the target population, 940 women were sampled, and responded to a telephone interview about Pap-test utilisation. The answers were compared with the screening program registry; comparing the dates of Pap-tests reported by both sources. Sensitivity analyses were performed for coverage over a 36-month period, according to various assumptions regarding non respondents.
Results: The response rate was 68%. The coverage over 36 months was 86.4% if we assume that non respondents had the same coverage as respondents, 66% if we assume they were not covered at all, and 74.6% if we adjust for screening compliance in the non respondents. The sensitivity and specificity of the question, "have you ever had a Pap test with the screening programme" were 84.5% and 82.2% respectively. The test dates reported in the interview tended to be more recent than those reported in the registry, but 68% were within 12 months of each other.
Conclusion: Surveys are useful tools to understand the effectiveness of a screening programme and women's self-report was sufficiently reliable in our setting, but the coverage estimates were strongly influenced by the assumptions we made regarding non respondents.
Background
The Pap-test is an effective preventive measure in reducing cervical cancer incidence and mortality [1]. It is recom-mended by the EU commission guidelines for all women aged 25–64 once every 3–5 years [2]. These guidelines
also recommend implementing organised screening pro-grams, because they assure quality control, timeliness of testing, and equity of access [1,3].
Published: 17 March 2006
BMC Health Services Research2006, 6:36 doi:10.1186/1472-6963-6-36
Received: 17 October 2005 Accepted: 17 March 2006
This article is available from: http://www.biomedcentral.com/1472-6963/6/36 © 2006Rossi et al; licensee BioMed Central Ltd.
Italian law requires the operation of screening pro-grammes in every health district, but some have yet to be implemented [4]. However, even when a programme is successful at contacting the entire target population, com-pliance varies from 20% to 60%, with a mean of 39% (5, 6).
There are several indicators suggesting that most of the tar-get population undergoes opportunistic Pap-testing and that the total coverage of the population varies from area to area. For example, the total annual number of Pap-tests performed by opportunistic screening in Italy is about 5.000.000, i.e. enough to cover the Italian target popula-tion of 16.000.000 every three years; but evidence from the national health survey shows that coverage ranges from 34% to 78% in the different regions of Italy [7].
In addition to knowing the coverage of the target popula-tion, it is important to identify the use of opportunistic screening both in women who are compliant and those who are not compliant to screening programs: in fact, addressing inappropriate use of resources is essential to build an efficient and equitable health service.
For these objectives, the most used study design is the sur-vey and the most common method used is a telephone interview [7,8]. Several authors have questioned the valid-ity of surveys, and in particular two problems have been highlighted: the validity of recall [9-24] and the assump-tion about non respondents [25-30].
Objectives of the study
The goals of the survey were to:
Study flow chart
Figure 1
Study flow chart.
List of female residents
81000
(all invited by the screening program at least once)
Sample:
940
Compliant: 455
(address
checked)
Non-compliant: 485
(address
not checked)
Screening history
Interview
Interview
Yes
383
Refused
16
Unreachble
56
Yes
258
Refused
40
Unreachble
187
Stated that they did not receive the invitation
• Estimate the Pap-test coverage in the area of Viterbo where an organised screening program is active.
• Identify the reasons for non compliance to the screening invitation.
We addressed the following methodological issues in ana-lysing these data:
• We assessed the validity of the women's recall.
• We propose a sensitivity analysis on the assumptions about the non respondents.
• We developed a method to estimate the role of address accuracy in screening compliance.
Methods
The setting
The Viterbo Health District is a rural area in central Italy with 291.000 inhabitants (target population 81.000 25– 64 year old women). The screening program in Viterbo started in 1997 and the second round finished in the sum-mer of 2004. Every three years it invites all female
resi-dents aged 25–64 in the area to be screened. The average compliance is 42%. All mailings, reminders, Pap-tests, colposcopies, histological samples and treatments are recorded individually in the program database.
Study design
This is a study integrating data from a cross-sectional sur-vey and from the screening program registry (figure 1). We sampled 940 women aged 25–64, from the list of resi-dents in the Health District, in two strata: resiresi-dents of the city of Viterbo and residents of the rest of the district.
The sample size was determined to have a power of 80%, with alpha 0.05, to detect a 10% difference in coverage between the two population groups, with a mean preva-lence of 50%, the smallest group representing at least 30% of the sample. The resulting sample size is 600; the expected response rate was 65%. The resulting precision for a point estimate of a hypothetical 50% coverage is +/-2%.
The questionnaire
The questionnaire included the following sections: indi-vidual data (educational level, occupation, employment); hysterectomy; family history of cancer; screening history (when and where of last Pap-test; test frequency); reasons for not complying with screening program; satisfaction with service. The phone questionnaire took about 15 min-utes, and was conducted by three trained interviewers. The survey was conducted between May and October 2004. All women sampled were phoned up to 9 times, then a reminder was mailed to the women who had not yet been contacted, after which another 3 phone contacts were made. The phone calls were made at different hours of the day.
Analysis
The information collected in the interview about Pap-tests performed by the screening program was compared with the data in the screening archives.
We used an algorithm to estimate the proportion of women unreachable for screening, (31) based on the fol-lowing assumptions: 1) that we have the correct addresses and phone numbers of the women who have been com-pliant to screening at least once, but may not for women who were never screened; 2) that the difference between the proportion of not contacted women among the non-compliant women and the proportion of not contacted women among the compliant is due to the wrong addresses (and consequently phone numbers) in the non-compliant women; 3) that the women are honest when stating they have received the screening invitation letter; 4) and that the entire sampled population has been invited at least once. The resulting algorithm for the
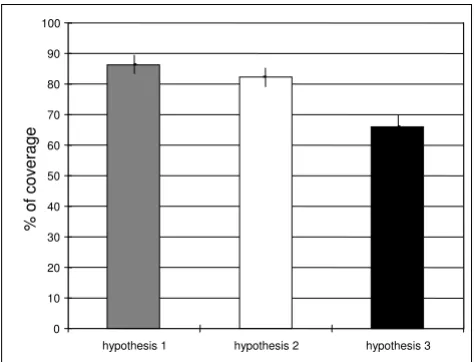
[image:3.612.57.295.88.269.2]pro-Results of the sensitivity analysis for 36-month coverage esti-mates
Figure 2
Results of the sensitivity analysis for 36-month coverage esti-mates. Hypothesis 1: crude coverage (hypothesis non-respondents = non-respondents); hypothesis 2: coverage in the non-respondents adjusted by screening compliance, i.e. cov-erage among non-respondents = (observed covcov-erage among screening non-compliant)*(proportion of non-compliant among non-respondents)+(observed coverage among screening compliant)*(proportion of non-compliant among non-respondents); hypothesis 3: all the non-respondents non-compliant to screening are not covered and only the compliant are covered. The bars represent the 95% confi-dence interval.
0 10 20 30 40 50 60 70 80 90 100
hypothesis 1 hypothesis 2 hypothesis 3
% o
f cov
era
portion of unreachable women is: (% of women who never received the letter)+((% of women not contacted in the group of the non compliant to screening)-(% not con-tacted in the screening compliant group)).
We performed a sensitivity analysis for 36-month cover-age and used three estimates according to different hypotheses on non-respondents:
1. We considered crude coverage (hypothesis: non-respondents = non-respondents), the least conservative hypothesis;
2. The intermediate hypothesis adjusted the coverage of non-respondents by screening compliance: coverage among non-respondents to the interview = (observed cov-erage among screening non-compliant)*(proportion of non-compliant among non-respondents)+(observed cov-erage among screening compliant)*(proportion of non-compliant among non-respondents);
3. In the third and most conservative hypothesis only the compliant are considered covered, so all non-respondents who were not compliant to screening are considered not covered.
Ethics and privacy
The Regional Ethics Committee stated that the Screening Program of each Health District must provide a Pap-test every three years to all residents in the target population, and this task involves the ascertainment of actual cover-age.
The interviews were anonymous, only a personal identifi-cation number, internal to the Screening Program data-base, permitted the linkage with screening history records.
Results
Response rate
We interviewed 641 women out of 940 sampled (68.2%), 6% refused to participate and 25.9% were unreachable. We did not find any difference in the response rate by age or residence.
We sampled 455 women who had had at least one Pap-test in the screening program and 485 who never com-plied with screening. We observed a highly significant dif-ference in response rate between the screening compliant and the non-compliant: we interviewed 84.2% of the screening compliant women and 53.2% of the non com-pliant; the difference was mostly due to the unreachable women (12.3% vs. 38.6%), rather than to refusals (3.5% vs. 8.3%).
Pap-test coverage
[image:4.612.52.554.98.301.2]We excluded from the analysis 22 (3.4%) women who had had a hysterectomy. Fifty-nine declared to never have had a Pap-test in their life, the crude coverage once in a lifetime is 90.1% (95%CI 87.3–92.8); only one woman stated that she did not know what a Pap-test is. Eighty-six point four percent (95%CI 83.3 – 89.5) reported having had a Pap within 36 months, and 88.5% (95%CI 85.6 – 91.4) within 60 months. We asked the compliant women what their Pap-test history was at their first appointment with the screening program, and 217 women answered:
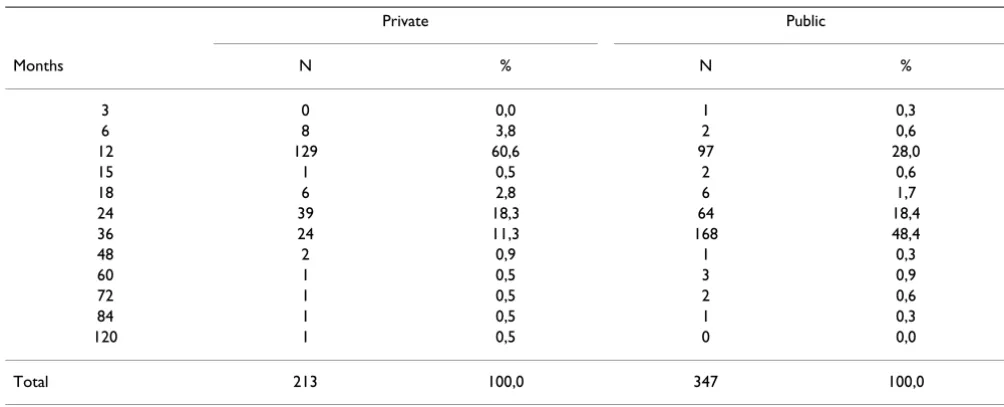
Table 1: Test periodicity. How frequently the women declared to repeat Pap-test in months, by type of provider.
Private Public
Months N % N %
3 0 0,0 1 0,3
6 8 3,8 2 0,6
12 129 60,6 97 28,0
15 1 0,5 2 0,6
18 6 2,8 6 1,7
24 39 18,3 64 18,4
36 24 11,3 168 48,4
48 2 0,9 1 0,3
60 1 0,5 3 0,9
72 1 0,5 2 0,6
84 1 0,5 1 0,3
120 1 0,5 0 0,0
18% (40) never had a Pap-test previously, only 5 of them were 25 years old at the time of the first invitation; 32% (70) had a Pap-test more than three years before.
We performed a sensitivity analysis of coverage at 36-months according to our different hypotheses on the cov-erage among non-respondent women. The covcov-erage among screening compliant was 92.4%, among non-com-pliant 69.0%; after adjusting for screening compliance the predicted coverage among non-respondents was 74.6% and 82.4% in the general population; according to the most conservative hypothesis, i.e. none of the non com-pliant who did not respond were covered, the estimate is 66.0% (figure 2).
The multivariate analysis showed a strong association with age, (women under 30 years old were less likely to be covered) and a weak association with having more than 5 years of education. We did not observe an association with residence.
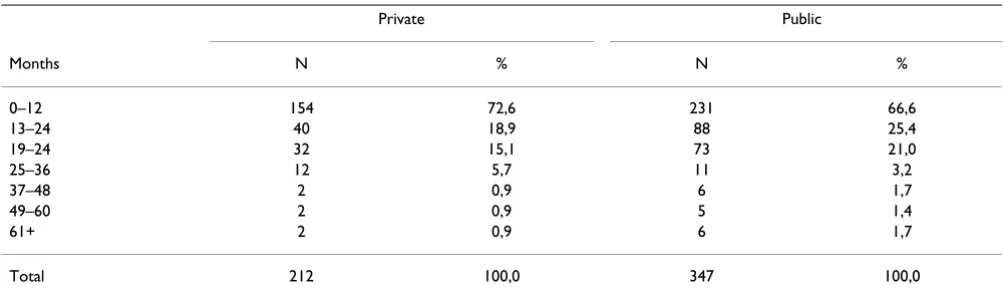
Tables 1 and 2 show the distribution of the answers to the question "when did you have your last Pap-test" and "how frequently do you have Pap-tests", by type of pro-vider. Women who were last tested by a public provider tended to have a bimodal distribution with peaks at one and at three year periods (the periods used by the screen-ing programme and recommended by the National Health Service Guidelines), while the women who had their last Pap-test in a private clinic had a single peak at one year.
Reasons for non compliance to screening invitation
The first reason for non compliance is not receiving the letter. We estimated the proportion of unreachable women, using the algorithm described in the methods: the not-reached proportion of the non compliant (38.6%), minus the not-reached proportion of the com-pliant (12.3%), plus those who reported not receiving the letter (9%). About 35% of the not compliant were not
screened because they did not receive the invitation, cor-responding to 20% of the general population.
Table 3 summarises the self-reported reasons for non compliance to screening invitation, by last Pap-test: women who never had a Pap reported "fear" as the main reason, while women who had had a Pap in the private sector reported "no trust in public services" or "exclusive trust in private gynaecologist".
Just over half of the interviewed women who had had at least one Pap-test were tested most recently by the screen-ing programme, 10.9% in another public clinic and 38.0% in a private clinic. We asked all women who had had their most recent Pap outside the screening program if they had ever had a Pap in the screening programme: 30% of them also had had a Pap in the screening program, a proportion that was higher in women who visit public clinics (43%).
We measured the women's satisfaction with the test pro-cedures (figure 3). Women who had the Pap in a private clinic were significantly more satisfied than women who were screened (90.0% vs 79.6%, chi2 = 9.7; p = 0.002), particularly those who had been tested in both places (90.0% vs. 51.7%, chi2 = 24.7: p < 0.00005). We did not observe differences in satisfaction by age, residence or educational level.
Validity of self-report (recall)
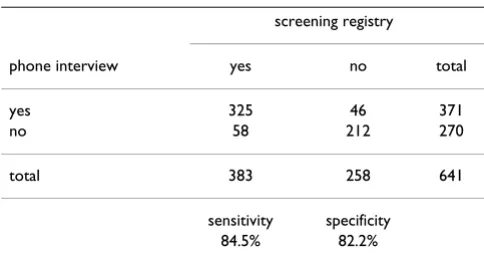
We compared the information from the screening registry with the answers given to the interview. Table 4 shows the sensitivity (84.5%; 95%CI 80.9–88.3) and specificity (82.2%; 95%CI 76.9–86.6) of the question "ever had a Pap-test in the screening program".
[image:5.612.54.556.99.248.2]Figure 4 shows the difference in months between the self-reported Pap-test date and the date self-reported in the screen-ing registry. The variable was present for the 267 women who reported having had their last Pap in the screening
Table 2: Self reported time elapsed from the last Pap-test in months, by type of provider.
Private Public
Months N % N %
0–12 154 72,6 231 66,6
13–24 40 18,9 88 25,4
19–24 32 15,1 73 21,0
25–36 12 5,7 11 3,2
37–48 2 0,9 6 1,7
49–60 2 0,9 5 1,4
61+ 2 0,9 6 1,7
program that was recorded in the screening registries. The mode of the distribution was +/- 1 month, 68% of the observations fell between +/- 12 months. There was asym-metry in the distribution: the self reported dates tended to be more recent than the dates in the registry.
Discussion
Surveys to measure test coverage for cancer prevention have been conducted in several countries [8] to monitor the efficacy of information campaigns and to understand non compliance to screening. In Italy however, although public screening programmes have been activated in almost all parts of the country, the compliance to screen-ing programs is low in many districts. The question is: what is the real Pap-test coverage rate? The National Health Interview gives an estimate of 68% for the country, and 77% for our region [7].
We tried to answer this question with this study, in response to a mandate from the Italian Group for
Cyto-logical Screening, but also had to address several method-ological issues common to all surveys that try to estimate the coverage achieved by screening tests.
The coverage
Our estimate for Pap-test coverage once in a lifetime is 90%, while the National Health Interview of 1999–2000 found it to be 77% in our region [7]. This difference is probably due to a real increasing trend in the area, conse-quent to cultural changes and to the activation of the first round of public screening in 1998–2001 that invited the entire target population and was promoted locally. We know that 50% of the women at their first appointment with the screening program were not adequately covered, consequently, because the compliance to screening was about 42%, the impact of the program showed an increase of at least 20% of the actual coverage.
[image:6.612.55.556.99.290.2]The coverage estimate changes according to the assump-tion we used regarding the non respondents. This prob-lem has been addressed in many surveys [25,29,32-34]. In this case, we were fortunate to know the Pap-test status for about 45% of the target population from the screening registries. Combining the information from the survey with that from the screening registry we observed that: 1) the non respondent population is very different from the respondent population regarding their utilisation of screening; 2) the unadjusted results of the survey overesti-mate Pap-test coverage. For the sensitivity analysis we used three different hypotheses. For the intermediate hypothesis, we adjusted for screening compliance assum-ing that the non respondent women compliant to screen-ing have the same coverage as the respondents compliant to screening, and that the respondent women non-compliant to screening have the same coverage as the
Table 3: Self-reported reasons for non compliance to screening invitation, by provider of last Pap-test.
private public never screened
reasons for non compliance N % N % N %
did not receive the letter 21 9,9 8 13,1 10 16,9
Forgot 40 18,8 27 44,3 22 37,3
pregnancy 10 4,7 1 1,6
no trust in public health services 13 6,1 1 1,7
exclusive trust in private gynaecologist 62 29,1
Fear 8 3,8 16 27,1
did not consider important 5 8,5
hysterectomized 1 1,7
Illness 1 1,7
Virgin 3 5,1
do not respond 59 27,7 25 41,0
Total 213 100,0 61 59 100,0
Table 4: Sensitivity and specificity of the phone interview question "Have you ever had a Pap-test performed by the public screening programme?", according to the screening registry.
screening registry
phone interview yes no total
yes 325 46 371
no 58 212 270
total 383 258 641
[image:6.612.54.296.596.725.2]respondent non-compliant to screening. This method gives results similar to those from other surveys interview-ing only non compliant women, proposed by several authors that was used to estimate the Pap-test coverage in areas where screening programs are active and have a reg-istry available [35,36].
The provider and the periodicity were associated: women who had their last Pap in a private clinic repeated Pap-tests more frequently than women who were last tested by the screening program. Given the cross-sectional design we cannot affirm that the provider influences the women's behaviour; it could be a self selection effect: women who want more Pap-tests go to private clinics because the screening programme only provides one Pap every three years. Nevertheless, although we cannot say that the screening program decreases over-screening, we can affirm that it is associated with more appropriate tim-ing.
Reasons for non compliance
The major barrier to screening was the low reliability of the address list for mailing the invitations, in fact, we esti-mated that 21% of the women could not be reached.
The algorithm we used to estimate the proportion of women who were unreachable is simple and is based on reasonable, although not perfect assumptions. This method however, in our opinion, is useful since there are no other simple solutions to assess the quality of the address lists.
The second reason for non compliance is the lack of trust in public service, an old problem in some areas of central and southern Italy.
Even though 75% of women were satisfied with the screening programme, it is significantly worse than for private providers; particularly concerning is the low satis-faction with screening in women who had been both pri-vately tested and screened. We have no indications about the reasons for the dissatisfaction, but it may be intrinsic to the organisation of our and other mass screening pro-grams where the physician does not reassure the patients [37] during the sampling, and negative results are com-municated only by a mail, about one month later.
Methodological remarks and limits
The validity of self-reported information about Pap-tests has been studied in several surveys, which have reached
Women's satisfaction according to the Pap-test provider
Figure 3
Women's satisfaction according to the Pap-test provider. 0
10 20 30 40 50 60 70 80 90 100
poor good
private clinics (N 213)
public clinics (N 61)
screening programme (N 250)
screening programme for women who experienced other (N 85)
different conclusions. It is evident from most of these studies that the validity of women's recall varies according to the socio-economic and cultural environment, so the results change according to geographical area, ethnicity, type of health care provider, and even neighbourhood [9,10,13,15-17]. Most of the literature about this topic has been published in the US, in order to validate the results of the NHIS [38] and other surveys [39] used to measure the progress in cancer prevention and the achievement of the National Cancer Institute goals. Few European studies have been published [40], and none in Italy recently (36, 41–43). In our population the validity of self-reported Pap-tests is high and only slightly overestimated coverage, because the sensitivity and the specificity are similar. The effect of telescoping [44], the tendency to report a test as having occurred more recently than it actually did, is
modest, nevertheless it must be taken into account that when the source of information to measure three years coverage is women's recall, what is actually being meas-ured is the percentage of women who had a Pap-test in the last 30–48 months. The district of Viterbo is mainly rural, with a pro-capita yearly income close to the Italian mean (24,000 €), the educational level of the population is sim-ilar (9% did not complete middle school and 31% have a high school degree; the national figures are 10% and 33%, data from the National Institute of Statistics – ISTAT), and it has an immigrant population of 3.4% (the Italian aver-age is 3.5%). This picture of the study population is con-sistent with the results about validity [18,45]. The major, and unavoidable, limit of our study for validating the self-reports is that we can only validate the tests performed within the screening programme, not those performed
[image:8.612.59.551.89.453.2]Frequency distribution of the difference between the self reported Pap-test dates and the dates reported in the screening reg-istry
Figure 4
Frequency distribution of the difference between the self reported Pap-test dates and the dates reported in the screening reg-istry. A positive value indicates that the woman's reported date was more recent than the registry date. The variable is defined for the 267 women who declared to have had the last Pap in the screening programme and had a Pap recorded in the screening registries.
0
.01
.02
.03
.04
.05
Dens
ity
-100
-50
0
50
100
privately or in other settings that have no registries, never-theless we do not see any reason for which women should preferentially forget the tests performed in a screening program or in another provider.
Conclusion
Surveys are a useful tool to determine the effectiveness of a screening program in maintaining high Pap-test cover-age, but the coverage estimates we can obtain are strongly influenced by the assumptions we make about non-respondents. Adjusting for screening compliance among non respondents give a more sound estimate than assum-ing equal coverage in respondents and non respondents.
In our setting the most important reason for non compli-ance to screening is that we were unable to contact 20% of the target population: every effort possible should be made to obtain reliable address lists.
List of abbreviations
EU European Union
CI confidence interval
Competing interests
The author(s) declare that they have no competing inter-ests.
Authors' contributions
PGR conceived and designed the study, conducted the sta-tistical analysis and wrote the paper. RE also conceived and designed the study, collected data, helped with the statistical analysis and writing the paper. AB was involved in designing the study and in data collection. SB con-ceived and designed the study, and helped writing the paper. AF was involved in conceiving the study and writ-ing the paper. All authors read and approved the final manuscript.
References
1. IARC Handbooks of Cancer Prevention: Cervix Cancer Screen-ing. IARC, Lion 2005, 10:.
2. The Council of the European Union, Council Recommenda-tion of 2 December 2003 on cancer screening (2003/878/EC) Official Journal of the European Union 16.12.2003. . 3. Bos AB, van Ballegooijen M, van Gessel-Dabekaussen AA, Habbema
JD: Organised cervical cancer screening still leads to higher coverage than spontaneous screening in The Netherlands. Eur J Cancer 1998, 34:1598-1601.
4. Ministero della Sanità: Linee Guida elaborate dalla Commis-sione Oncologica Nazionale in applicazione di quanto pre-visto dal Piano Sanitario Nazionale per il triennio 1994–1996, relative all'azione programmata "prevenzione e Cura delle malattie oncologiche", concernenti l'organizzazione della prevenzione e dell'assistenza in oncologia. Gazzetta Ufficiale N. 127 . 1/6/1996
5. Segnan N, Ronco G, Ciatto S: Cervical cancer screening in Italy. Eur J Cancer 2000, 36:2235-2239.
6. Ronco G, Iossa A, Naldoni C, Pilutti S, Anghinoni E, Zappa M, Dalla Palma P, Ciatto S, Segnan N: A first survey of organized cervical cancer screening programs in Italy. GISCi working group on
organization and evaluation. Gruppo Italiano Screening Citologico. Tumori 1998, 84:624-630.
7. ISTAT – Unit Struttura e dinamica sociale: Health interview sur-vey: Health status and use of health services – Years 1999– 2000. ISTAT, Roma 2003.
8. Thornberry OT, Wilson RW, Golden PM: Health promotion data for the 1990 objectives. Estimates from the National Health Interview Survey of Health Promotion and Disease Preven-tion: United States, 1985. Adv Data 1986:1-16.
9. Hoyo C, Ostbye T, Skinner CS, Yarnall KS, Chowdhary J: Reproduc-ibility of self-reported Pap test utilization in middle-aged African-American women. Ethn Dis 2005, 15(1):84-9. 10. McPhee SJ, Nguyen TT, Shema SJ, Nguyen B, Somkin C, Vo P, Pasick
R: Validation of recall of breast and cervical cancer screening by women in an ethnically diverse population. Prev Med 2002,
35:463-473.
11. Barratt A, Cockburn J, Smith D, Redman S: Reliability and validity of women's recall of mammographic screening. Aust N Z J Pub-lic Health 2000, 24:79-81.
12. Newell S, Girgis A, Sanson-Fisher R, Ireland M: Accuracy of patients' recall of Pap and cholesterol screening. Am J Public Health 2000, 90:1431-1435.
13. McGovern PG, Lurie N, Margolis KL, Slater JS: Accuracy of self-report of mammography and Pap smear in a low-income urban population. Am J Prev Med 1998, 14:201-208.
14. Bowman JA, Sanson-Fisher R, Redman S: The accuracy of self-reported Pap smear utilisation. Soc Sci Med 1997, 44:969-976. 15. Paskett ED, Tatum CM, Mack DW, Hoen H, Case LD, Velez R:
Val-idation of self-reported breast and cervical cancer screening tests among low-income minority women. Cancer Epidemiol Biomarkers Prev 1996, 5:721-726.
16. Hiatt RA, Perez-Stable EJ, Quesenberry C Jr, Sabogal F, Otero-Sab-ogal R, McPhee SJ: Agreement between self-reported early cancer detection practices and medical audits among His-panic and non-HisHis-panic white health plan members in north-ern California. Prev Med 1995, 24:278-285.
17. Johnson CS, Archer J, Campos-Outcalt D: Accuracy of Pap smear and mammogram self-reports in a southwestern Native American tribe. Am J Prev Med 1995, 11:360-363.
18. Montano DE, Phillips WR: Cancer screening by primary care physicians: a comparison of rates obtained from physician self-report, patient survey, and chart audit. Am J Public Health
1995, 85:795-800.
19. Gordon NP, Hiatt RA, Lampert DI: Concordance of self-reported data and medical record audit for six cancer screening pro-cedures. J Natl Cancer Inst 1993, 85:566-570.
20. Whitman S, Lacey L, Ansell D, Chen EH, Dell J, Phillips CW: Do chart reviews and interviews provide the same information about breast and cervical cancer screening? Int J Epidemiol
1993, 22:393-397.
21. Brown JB, Adams ME: Patients as reliable reporters of medical care process. Recall of ambulatory encounter events. Med Care 1992, 30:400-411.
22. Bowman JA, Redman S, Dickinson JA, Gibberd R, Sanson-Fisher RW:
The accuracy of Pap smear utilization self-report: a method-ological consideration in cervical screening research. Health Serv Res 1991, 26:97-107.
23. Michielutte R, Dignan MB, Wells HB, Bahnson J, Smith M, Wooten R, Hale LN: Errors in reporting cervical screening among public health clinic patients. J Clin Epidemiol 1991, 44:403-408. 24. Sawyer JA, Earp JA, Fletcher RH, Daye FF, Wynn TM: Accuracy of
women's self-report of their last Pap smear. Am J Public Health
1989, 79:1036-1037.
25. Sogaard AJ, Selmer R, Bjertness E, Thelle D: The Oslo Health Study: The impact of self-selection in a large, population-based survey. Int J Equity Health 2004, 3:3.
26. Van Loon AJ, Tijhuis M, Picavet HS, Surtees PG, Ormel J: Survey non-response in the Netherlands: effects on prevalence esti-mates and associations. Ann Epidemiol 2003, 13:105-110. 27. Korkeila K, Suominen S, Ahvenainen J, Ojanlatva A, Rautava P,
Hele-nius H, Koskenvuo M: Non-response and related factors in a nation-wide health survey. Eur J Epidemiol 2001, 17:991-999. 28. Etter JF, Perneger TV: Analysis of non-response bias in a mailed
health survey. J Clin Epidemiol 1997, 50:1123-1128.
Publish with BioMed Central and every scientist can read your work free of charge "BioMed Central will be the most significant development for disseminating the results of biomedical researc h in our lifetime."
Sir Paul Nurse, Cancer Research UK
Your research papers will be:
available free of charge to the entire biomedical community
peer reviewed and published immediately upon acceptance
cited in PubMed and archived on PubMed Central
yours — you keep the copyright
Submit your manuscript here:
http://www.biomedcentral.com/info/publishing_adv.asp
BioMedcentral and non-users in Scotland. J Epidemiol Community Health 1994,
48:586-589.
30. Diehr P, Koepsell TD, Cheadle A, Psaty BM: Assessing response bias in random-digit dialling surveys: the telephone-prefix method. Stat Med 1992, 11:1009-1021.
31. Giorgi Rossi P, Federici A, Bartolozzi F, Farchi S, Borgia P, Guasticchi G: Understanding non-compliance to colorectal cancer screening: a case control study, nested in a randomised trial [ISRCTN83029072]. BMC Public Health 2005, 5:139.
32. Giorgi Rossi P, Faustini A, Spadea T, Perucci CA: Choosing immu-nization coverage indicators at the local level. Eur J Epidemiol
2004, 19:979-985.
33. Wolf HK, Kuulasmaa K, Tolonen H, Sans S, Molarius A, Eastwood BJ:
WHO MONICA Project. Effect of sampling frames on response rates in the WHO MONICA risk factor surveys. Eur J Epidemiol 2005, 20:293-299.
34. Tennant A, Badley EM: A confidence interval approach to inves-tigating non-response bias and monitoring response to postal questionnaires. J Epidemiol Community Health 1991,
45:81-85.
35. Ronco G, Segnan N, Giordano L, Pilutti S, Senore C, Ponti A, Volante R: Interaction of spontaneous and organised screening for cervical cancer in Turin, Italy. Eur J Cancer 1997, 33:1262-1267. 36. Ronco G, Senore C, Giordano L, Quadrino S, Ponti A, Segnan N:
Who does Pap-test? The effect of one call program on cov-erage and determinants of compliance. Epidemiol Prev 1994,
18:218-223.
37. Schofield MJ, Sanson-Fisher R, Halpin S, Redman S: Notification and follow-up of Pap test results: current practice and women's preferences. Prev Med 1994, 23:276-283.
38. Thornberry OT, Wilson RW, Golden PM: Health promotion data for the 1990 objectives. Estimates from the National Health Interview Survey of Health Promotion and Disease Preven-tion: United States, 1985. Adv Data :1-16. 1986 Sep 19 39. Centers for Disease Control (CDC): Pap smear screening –
Behavioral Risk Factor Surveillance System, 1988. MMWR Morb Mortal Wkly Rep 1989, 38:777-779.
40. van Ballegooijen M, van den Akker-van Marle E, Patnick J, Lynge E, Arbyn M, Anttila A, Ronco G, Dik J, Habbema F: Overview of important cervical cancer screening process values in Euro-pean Union (EU) countries, and tentative predictions of the corresponding effectiveness and cost-effectiveness. Eur J Can-cer 2000, 36:2177-2188.
41. Abrami R, Cattaneo A: [Determinant factors for the use of screening for cervical cancer in Friuli Venezia Giulia]. Min-erva Ginecol 1999, 51:335-341.
42. Ravaioli A, Scarpellini M, Livi C, Monti F, Desiderio F, Tononi A, Nico-lini M: Patterns of Pap smear use in the Rimini area: an anal-ysis of women's attitudes to the test. Eur J Cancer Prev 1993,
2:307-312.
43. Perucci CA, Rapiti E, Davoli M, Lagorio S, Arca M, Miller AB: Rome women's screening study: knowledge, attitudes and prac-tices of women regarding screening for breast and cervical cancer. Tumori 1990, 76:365-369.
44. Lawrence VA, De Moor C, Glenn ME: Systematic differences in validity of self-reported mammography behavior: A problem for intergroup comparisons? Prev Med 1999, 29:577-580. 45. Barratt A, Cockburn J, Smith D, Redman S: Reliability and validity
of women's recall of mammographic screening. Aust N Z J Pub-lic Health 2000, 24:79-81.
Pre-publication history
The pre-publication history for this paper can be accessed here: