6Li(n, t) and 10B(n, α) standards from thermal to 170 keV neutron energy range at n_TOF
.
White Rose Research Online URL for this paper:
http://eprints.whiterose.ac.uk/151248/
Version: Published Version
Article:
Amaducci, S., Cosentino, L., Barbagallo, M. et al. (118 more authors) (2019) Measurement
of the 235U(n, f) cross section relative to the 6Li(n, t) and 10B(n, α) standards from
thermal to 170 keV neutron energy range at n_TOF. European Physical Journal A. 120.
ISSN 1434-601X
https://doi.org/10.1140/epja/i2019-12802-7
[email protected] https://eprints.whiterose.ac.uk/
Reuse
This article is distributed under the terms of the Creative Commons Attribution (CC BY) licence. This licence allows you to distribute, remix, tweak, and build upon the work, even commercially, as long as you credit the authors for the original work. More information and the full terms of the licence here:
https://creativecommons.org/licenses/
Takedown
If you consider content in White Rose Research Online to be in breach of UK law, please notify us by
DOI 10.1140/epja/i2019-12802-7
Regular Article – Experimental Physics
P
HYSICAL
J
OURNAL
A
Measurement of the
235
U
(
n
,
f
)
cross section relative to the
6
Li
(
n
,
t
)
and
10
B
(
n
, α
)
standards from thermal to 170 keV
neutron energy range at n TOF
S. Amaducci1,35, L. Cosentino1, M. Barbagallo2, N. Colonna2, A. Mengoni3,4, C. Massimi4,5, S. Lo Meo3,4,
P. Finocchiaro1,a, O. Aberle6, J. Andrzejewski7, L. Audouin8, M. Bacak9,6,10, J. Balibrea11, F. Beˇcv´aˇr12,
E. Berthoumieux10, J. Billowes13, D. Bosnar14, A. Brown15, M. Caama˜no16, F. Calvi˜no17, M. Calviani6, D.
Cano-Ott11, R. Cardella6, A. Casanovas17, F. Cerutti6, Y.H. Chen8, E. Chiaveri6,13,18, G. Cort´es17, M.A. Cort´es-Giraldo18,
L.A. Damone2,19, M. Diakaki10, C. Domingo-Pardo20, R. Dressler21, E. Dupont10, I. Dur´an16, B. Fern´
andez-Dom´ınguez16, A. Ferrari6, P. Ferreira22, V. Furman23, K. G¨obel24, A.R. Garc´ıa11, A. Gawlik7, S. Gilardoni6,
T. Glodariu25, I.F. Gon¸calves22, E. Gonz´alez-Romero11, E. Griesmayer9, C. Guerrero18, F. Gunsing10,6, H. Harada26,
S. Heinitz21, J. Heyse27, D.G. Jenkins15, E. Jericha9, F. K¨appeler28, Y. Kadi6, A. Kalamara29, P. Kavrigin9,
A. Kimura26, N. Kivel21, I. Knapova12, M. Kokkoris29, M. Krtiˇcka12, D. Kurtulgil24, E. Leal-Cidoncha16, C. Lederer30,
H. Leeb9, J. Lerendegui-Marco18, S.J. Lonsdale30, D. Macina6, A. Manna4,5, J. Marganiec7,31, T. Mart´ınez11,
A. Masi6, P. Mastinu32, M. Mastromarco2, E.A. Maugeri21, A. Mazzone2,33, E. Mendoza11, P.M. Milazzo34,
F. Mingrone6, A. Musumarra1,35, A. Negret25, R. Nolte31, A. Oprea25, N. Patronis36, A. Pavlik37, J. Perkowski7,
I. Porras38, J. Praena38, J.M. Quesada18, D. Radeck31, T. Rauscher39,40, R. Reifarth24, C. Rubbia6, J.A. Ryan13,
M. Sabat´e-Gilarte6,18, A. Saxena41, P. Schillebeeckx27, D. Schumann21, P. Sedyshev23, A.G. Smith13, N.V. Sosnin13,
A. Stamatopoulos29, G. Tagliente2, J.L. Tain20, A. Tarife˜no-Saldivia17, L. Tassan-Got8, S. Valenta12, G. Vannini4,5,
V. Variale2, P. Vaz22, A. Ventura4, V. Vlachoudis6, R. Vlastou29, A. Wallner42, S. Warren13, C. Weiss9, P.J. Woods30,
T. Wright13, and P. ˇZugec14,6
1
INFN Laboratori Nazionali del Sud, Catania, Italy 2
Istituto Nazionale di Fisica Nucleare, Sezione di Bari, Bari, Italy 3
Agenzia nazionale per le nuove tecnologie (ENEA), Bologna, Italy 4
Istituto Nazionale di Fisica Nucleare, Sezione di Bologna, Bologna, Italy 5
Dipartimento di Fisica e Astronomia, Universit`a di Bologna, Bologna, Italy 6
European Organization for Nuclear Research (CERN), Gen`eve, Switzerland 7
University of Lodz, Lodz, Poland 8
Institut de Physique Nucl´eaire, CNRS-IN2P3, Univ. Paris-Sud, Universit´e Paris-Saclay, F-91406 Orsay Cedex, France 9
Technische Universit¨at Wien, Wien, Austria 10
CEA Irfu, Universit´e Paris-Saclay, F-91191 Gif-sur-Yvette, France 11
Centro de Investigaciones Energ´eticas Medioambientales y Tecnol´ogicas (CIEMAT), Madrid, Spain 12
Charles University, Prague, Czech Republic 13
University of Manchester, Manchester, UK 14
Department of Physics, Faculty of Science, University of Zagreb, Zagreb, Croatia 15
University of York, York, UK 16
University of Santiago de Compostela, Santiago de Compostela, Spain 17
Universitat Polit`ecnica de Catalunya, Barcelona, Spain 18
Universidad de Sevilla, Sevilla, Spain 19
Dipartimento di Fisica, Universit`a degli Studi di Bari, Bari, Italy 20
Instituto de F´ısica Corpuscular, CSIC - Universidad de Valencia, Valencia, Spain 21
Paul Scherrer Institut (PSI), Villingen, Switzerland 22
Instituto Superior T´ecnico, Lisbon, Portugal 23
Joint Institute for Nuclear Research (JINR), Dubna, Russia 24
Goethe University Frankfurt, Frankfurt, Germany 25
Horia Hulubei National Institute of Physics and Nuclear Engineering, Bucharest, Romania 26
Japan Atomic Energy Agency (JAEA), Tokai-mura, Japan 27
European Commission, Joint Research Centre, Geel, Retieseweg 111, B-2440 Geel, Belgium 28
Karlsruhe Institute of Technology, Campus North, IKP, 76021 Karlsruhe, Germany 29
30
School of Physics and Astronomy, University of Edinburgh, Edinburgh, UK 31
Physikalisch-Technische Bundesanstalt (PTB), Bundesallee 100, 38116 Braunschweig, Germany 32
INFN Laboratori Nazionali di Legnaro, Legnaro (PD), Italy 33
Consiglio Nazionale delle Ricerche, Bari, Italy 34
Istituto Nazionale di Fisica Nucleare, Sezione di Trieste, Trieste, Italy 35
Dipartimento di Fisica e Astronomia, Universit`a di Catania, Catania, Italy 36
University of Ioannina, Ioannina, Greece 37
University of Vienna, Faculty of Physics, Vienna, Austria 38
University of Granada, Granada, Spain 39
Department of Physics, University of Basel, Basel, Switzerland 40
Centre for Astrophysics Research, University of Hertfordshire, Hatfield, UK 41
Bhabha Atomic Research Centre (BARC), Mumbai, India 42
Australian National University, Canberra, Australia
Received: 21 March 2019 / Revised: 30 May 2019 Published online: 26 July 2019
c
The Author(s) 2019. This article is published with open access at Springerlink.com Communicated by A. Obertelli
Abstract. The 235
U(n,f) cross section was measured at n TOF relative to6
Li(n,t) and10
B(n, α), with high resolution (L = 183.49(2) m) and in a wide energy range (25 meV–170 keV) with 1.5% systematic uncertainty, making use of a stack of six samples and six silicon detectors placed in the neutron beam. This allowed us to make a direct comparison of the yields of the 235
U(n,f) and of the two reference re-actions under the same experimental conditions, and taking into account the forward/backward emission asymmetry. A hint of an anomaly in the 10–30 keV neutron energy range had been previously observed in other experiments, indicating a cross section systematically lower by several percent relative to major eval-uations. The present results indicate that the cross section in the 9–18 keV neutron energy range is indeed overestimated by almost 5% in the recently released evaluated data files ENDF/B-VIII.0 and JEFF3.3, as a consequence of a 7% overestimate in a single GMA node in the IAEA reference file. Furthermore, these new high-resolution data confirm the existence of resonance-like structures in the keV neutron energy re-gion. The results here reported may lead to a reduction of the uncertainty in the 1–100 keV neutron energy region. Finally, from the present data, a value of 249.7±1.4(stat)±0.94(syst) b·eV has been extracted for the cross section integral between 7.8 and 11 eV, confirming the value of 247.5±3 b·eV recently established as a standard.
1 Introduction
The235U(n,f) cross section is one of the most important
and widely used cross sections. Although it is a standard at the 0.025 eV thermal neutron energy point and between 0.15 and 200 MeV, it is used as reference at all energies for a variety of purposes, such as for the measurement of the neutron fluence for various applications, or for the mea-surement of the fission cross section of other actinides. Together with other reactions, the neutron-induced fis-sion of 235U is routinely used at the n TOF facility at
CERN for the neutron beam characterization. A recent high-accuracy determination of the n TOF neutron flux in the first experimental area (EAR1) for Phase-II, covering the years 2009–2011 [1], made use of four independent de-tection systems based on three different neutron convert-ing reactions. The Silicon-based SiMon device [2], relyconvert-ing on the6Li(n,t)4He converting reaction, was used to cover
the neutron energy range between thermal and 100 keV. The same range was also covered by a MicroMegas detec-tor exploiting the10B(n, α)7Li reaction [3]. For the higher
energy range the 235U(n,f) reaction was used, with
dif-ferent fission fragment detectors: the MicroMegas, a cali-brated ionization chamber from PTB [4] and finally Paral-lel Plate Avalanche Counters up to 1 GeV neutron energy range [5]. After properly normalizing the data to the re-spective standard cross sections at thermal energy, the flux extracted on the basis of the6Li(n,t)4He and10B(n, α)7Li
reactions mostly agreed with each other and with the re-sults of FLUKA simulations of the neutron beam [6]. Con-versely, the flux extracted on the basis of the235U(n,f) re-action, determined independently with the PTB and Mi-cromegas detectors, resulted several percent lower in the energy range 10–30 keV [1]. A possible explanation was that the evaluated fission cross section in that neutron energy region was overestimated by several percent. Al-though the 235U(n,f) cross section in that range is not
a standard, such a large difference was unexpected, in particular since most of the evaluations available at that time quoted an uncertainty on this cross section below or around 1% (see for example the compilation of standard cross sections in refs. [7] and [8]).
a
The235U(n,f) cross section is one of the neutron data
standards that were recently re-evaluated as a result of an international effort led by the Cross Section Evaluation Working Group (CSEWG) and the International Atomic Energy Agency (IAEA) [8]. Since neutron cross section standards are used as reference for measurements and evaluations of all other neutron cross sections, a periodic update of their value is a pre-requisite for improving the accuracy of the major nuclear data libraries that use such standards. This is the case, in particular, of the recently released ENDF/B-VIII.0 evaluated nuclear data library that, like other existing libraries, now fully incorporates the new IAEA standards.
The evaluation of neutron standards is performed with GMAP, a modified version of the GMA least-squares code, used to fit in one full analysis all types of cross section (absolute and shape), their ratios, spectrum averages and thermal constants, with an uncertainty propagation law based on the use of full covariance matrices for the exper-imental data. More details on the evaluations of neutron standards can be found in [8]. As a result of the GMAP analysis, the standard cross section is provided in a fixed grid of neutron energy points, called nodes, from which the point-wise cross section can be determined by following a prescribed interpolation procedure. This is somewhat dif-ferent from what is used in major evaluated nuclear data files, the so-called ENDF-6 format, in which the cross sec-tion is given in a variable number of points, depending on how fast it varies as a function of energy. Point-wise cross sections from ENDF-6 formatted files can be obtained di-rectly or by means of suitable post-processing codes.
The evaluated235U fission cross section (in
ENDF/B-VII.1 [9] and more recently in ENDF/B-VIII.0 [10] and JEFF3.3 [11]) in the 10–30 keV neutron energy region re-lies on the available EXFOR data which mostly date back to the 70s and 80s [12–18]. Those data are shown in the re-gion of interest in fig. 1, in comparison with the two more recent evaluations which apparently tend to overestimate most datasets.
It is also interesting to notice the presence of structures in the cross section, most probably related to the grouping of unresolved resonances, similar to those determined in a measurement of the Au(n, γ) cross section at n TOF [19]. Moreover, in a recent paper [20] Jandelet al.measured the
235U(n, γ) capture cross section relative to235U(n,f), and
found that their data between 10 and 30 keV are about 10% larger than the corresponding data from the evalua-tions in ENDF/B-VII.1 and JENDL-4.0 [21]. While they concluded that the problem was related to the capture cross section, the observed discrepancy could be at least partially attributed to an overestimate of the evaluated fission cross section used as reference.
Such a possible difference in cross section, which has a negligible influence on thermal reactors, can be important for future fast critical or subcritical reactors. Furthermore, the interest in the235U(n,f) reaction is more general as it
is often used at that energy to determine the neutron flux, or as a reference in measurements of fission cross section of other actinides, of interest for transmutation projects
as well as of key importance in nuclear astrophysics for the correct modeling of the fission recycling in r-process nucleosynthesis [22]. In order to clarify this issue and re-duce the uncertainty in this energy region, a high-accuracy high-resolution measurement of the 235U(n,f) cross sec-tion was performed at n TOF in EAR1, relative to two cross section standards commonly used as reference. Data were collected in a wide energy range from thermal neu-tron energy to 170 keV. We focus here on the unresolved resonance region (from ≈ 2 keV upward), while the de-tailed analysis of the resonance region will be the subject of a forthcoming paper. The paper is organized as follows: in sect. 2 the experimental setup and the data analysis procedure are described, sect. 3 reports the results, sect. 4 shows the comparison of the measured data with the IAEA reference data and with the evaluated libraries, and a final discussion is presented in sect. 5 followed by the conclu-sions.
2 Experimental setup
The experiment was performed at n TOF in EAR1, at the end of a flight path of 183.49(2) m length. In this area, the neutron beam has an instantaneous flux of 105–106n/bunch, an energy ranging from thermal up to
∼ 1 GeV and an energy resolution of 10−4 up to a few
keV. More details on the n TOF facility and EAR1 can be found in ref. [23]. The235U(n,f) cross section was
deter-mined relative to the two main reference reactions, namely
6Li(n,t) and10B(n, α), whose cross sections are standards
of measurement. The reference reactions, their decay prod-ucts and kinetic energies (for incident thermal neutrons) are listed below:
6Li + n→3H (2.73 MeV) +α(2.05 MeV),
10B + n→7Li (1.01 MeV) +α(1.78 MeV)
ground state, BR≈6%,
10B + n→7Li (0.84 MeV) +α(1.47 MeV)+γ (0.48 MeV)
excited state, BR≈94%.
At variance with the235U(n,f) cross section, adopted
as standard at 0.0253 eV and between 150 keV and 200 MeV, the cross section for the two reference reactions are considered standard between 0.0253 eV and 1 MeV. The choice of the ratio method (described later in more detail), ensures a minimization of the systematic errors re-lated to the determination of the neutron flux, as well as to geometrical details of the setup and other experimental effects.
Fig. 1.A few235
U(n,f) cross section datasets from EXFOR in comparison with two evaluations, in the energy range 5–40 keV.
Table 1.Characteristics of the six samples (two for each type of deposit).
Deposit Size (mm) Nominal Backing Isotope Enrichment Atoms/cm2 Preparation
thickness (µm) method
LiF 47×47 1.97 (3) Al 50µm 6
Li 95% 1.14·1019
evaporation
B4C 70×70 0.080 (5) Al 18µm 10
B 99% 8.28·1017
plasma deposition
H2O2U 40 0.1450 (16) Al 250µm 235
U 99.999% 6.18·1017
molecular plating
that each reaction was measured with a separate sample-detector pair in the forward and in the backward direc-tion with respect to beam (it is worth remarking that due to the thickness of samples and substrates, only reaction products exiting from one side are detected). The rea-son of this arrangement was to introduce a redundancy and compensate (to a large extent) the forward/backward emission asymmetry of the products of the n +10B and
n +6Li reactions. The six silicon detectors had an active
area of 50×50 mm2, and 200µm thickness, with a 0.5µm
aluminum dead layer on top. The characteristics of the six samples are listed in table 1. As for the beam shape, the geometrical distribution of the neutrons in the transverse plane is Gaussian with a standard deviation of 7 mm.
The front-end electronics for the silicon detectors consisted of the MPR-16-LOG multichannel linear-logarithmic preamplifier, produced by Mesytec [24], fol-lowed by six ORTEC 474 timing filter amplifier mod-ules [25]. The preamplifier has a linear behavior up to 10 MeV deposited energy, while above this energy its re-sponse becomes logarithmic. Its use allowed us to accom-modate into a single range the low energy alphas and tri-tons as well as the highly energetic fission fragments and, especially, to minimize the effect of the so-called γ-flash,
i.e. the prompt signal produced in the detector by
rela-tivistic particles and γ-rays from the spallation process. Such a signal was particularly large in this measurement,
considering that the detectors were directly exposed to the beam. The data for each neutron bunch were collected by sampling the amplifiers’ output signals by means of flash ADCs and recording the waveforms for 100 ms. In the fol-lowing the six silicon detectors will be named as Li f, Li b, B f, B b, U f, U b, standing respectively for6Li,10B,235U,
forward and backward with respect to the beam direction.
2.1 Data analysis
The procedure for converting the time of flight into neu-tron kinetic energy made use of the high resolution time information taken from the U f detector. A preliminary calibration of the flight path length was performed by means of a linear fit of the time-to-energy relation for forty prominent resonances between 2 and 35 eV neutron en-ergy. The energy calibration was subsequently refined by minimizing theχ2between the measured cross section and
the ENDF-B/VIII evaluation, using a parametrization as in ref. [26], with a final path length L = 183.49 (2) m. A final check was performed by looking at the position of the aluminum dip, which resulted 5903.28±1.05 eV to be compared with 5904.47 eV reported on all the major evaluated data libraries.
[image:5.595.50.549.353.434.2]Fig. 2. The experimental setup, with the six targets and six silicon detectors used in the measurement.
high intensity neutron beam could have resulted in a degradation of their performances [27, 28]. The counting rates of the six detectors as a function of the neutron en-ergy throughout the measurement (about one month of beam time) showed fluctuations of the order of 1% over the whole energy range, proving that the detectors remained stable and suffered no significant performance worsening. Two-dimensional scatter plots of the deposited energy
versus the incident neutron energy were built with the aim
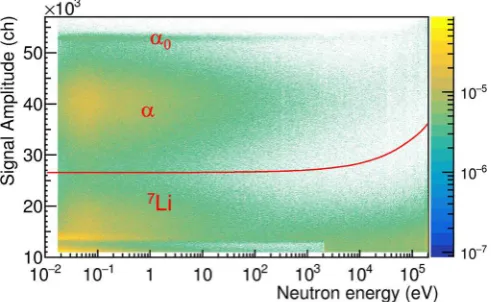
of selecting the reaction products, discriminating them from electronic noise and other background sources. Ex-amples of such plots are shown in fig. 3, fig. 4 and fig. 5, for Li b, B f and U f respectively. In fig. 3 the two re-gions corresponding to the detection of alphas and tritons emitted in the6Li(n,t) reaction are clearly distinguished.
With increasing neutron energy, the number of counts de-creases, as expected from the 1/v behavior of the cross section, while the deposited energy slightly decreases be-cause of the kinematics, since the detector is positioned in the backward direction. In a similar fashion fig. 4 shows the data of the B f detector, where two regions correspond-ing to the detection of α-particles and7Li emitted in the
n+10B reaction can be clearly identified (in the upper part
Fig. 3. Scatter plot of deposited energy vs. neutron energy for the Li b detector (backward emission from6
[image:6.595.307.552.93.243.2]Li). The two regions corresponding to the detection ofα-particles and tri-tons are clearly distinguished. The line represents the energy-dependent threshold applied to select only the triton region, used in the analysis (see text).
Fig. 4. Scatter plot of deposited energy vs. neutron energy for the B f detector (forward emission from10
B). The two re-gions corresponding to the detection ofα-particles and7
Li are clearly distinguished (in the upper part also the higher energy α-particles from the (n, α0) reaction are visible). The line is the energy-dependent threshold applied to select the α-particles used in the analysis (see text).
of the plot the higher energyα-particles from the (n, α0)
reaction are also visible). Being this detector in the for-ward direction, the kinematics produces a slight increase in the deposited energy with increasing neutron energy.
[image:6.595.307.553.328.479.2]Fig. 5. Scatter plot of deposited energy vs. neutron energy for the U f detector (forward emission from 235
U). The two regions corresponding to the detection ofα-particles from the natural radioactivity of the sample, and fission fragments are clearly distinguished. The line shows the energy-dependent threshold applied to select the fission fragments for the anal-ysis (see text). The logarithmic behavior of the preamplifier shows clearly in the compressed range of the vertical axis. The behavior of the amplitude at high neutron energies is related to the effect of theγ-flash.
we selected the centroid of the band in 7 neutron energy regions, and then adapted a polynomial function to these points. Such a function was used to straighten the plot that was then projected on the Y axis. In the resulting plot shown in fig. 6(top) the two-bump structure of each bell-shaped curve clearly indicates the detection of fission fragments. We renormalized all the curves in order to have the same integral above the threshold (10500). The new plot, shown in fig. 6(bottom), proves that the low energy tail is the same independently of the neutron energy, thus implying that the fraction of fission events lost below the threshold is the same at all energies. Consequently the efficiency of the selection cut for fission fragments was evaluated as 0.9680 (34).
The curves in the 2D plots for the reference reactions (fig. 3 and fig. 4) represent the conditions used to select the tritons and theα-particles for the6Li(n,t) and10B(n, α)
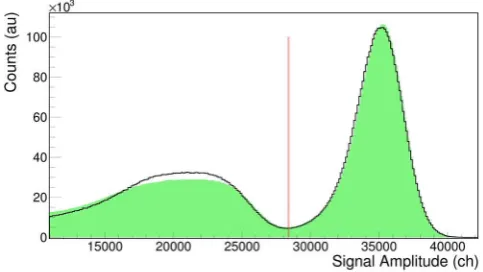
reactions, respectively. These curves were obtained by an-alyzing the 1D amplitude spectra for different neutron en-ergies. The optimal identification threshold, determined as the minimum in the valley between the reaction products (fig. 7), was fitted as a function of energy with a polyno-mial function. The same could not be done for the Li f detector since, due to kinematical reasons and a slightly worse resolution, at increasing neutron energy the two structures from tritons and α-particles were not clearly separated. In this case the threshold was safely chosen at
−1 standard deviation from the maximum of the triton peak. For the U f and U b detectors, the threshold for each neutron energy was chosen just above theα-particle peak, in a position where the counts drop by two to three orders of magnitude (see also fig. 6). A polynomial fit sim-ilar to the previous ones provided the analytical
[image:7.595.48.293.93.251.2]energy-Fig. 6. Top: Y-projection of fig. 5, for seven neutron energy intervals, after straightening the plot by means of a polynomial function. The two-bump structure of the bell-shaped curves proves that these are fission events. Bottom: the same plot, after renormalizing the curves to the same integral between 10500 (threshold) and 40000, shown in log-scale to prove that the fraction of fission fragments lost below the threshold is independent of the neutron energy (see the text).
Fig. 7. Deposited energy spectrum for the Li b detector at thermal neutron energy. The two structures correspond to the detection of tritons and alphas. Filled area: experimental data. Line: simulation result. Vertical line: identification threshold used in the analysis. The slight difference between data and simulation for alpha particles is likely due to the uncertainty on the thin dead layer on top of the silicon detector.
dependent threshold curve (the one for the U f detector is shown in fig. 5).
The residual background surviving the amplitude cuts was measured by means of dummy samples,i.e.only made
[image:7.595.307.549.445.581.2]the lithium and uranium samples with respect to the re-action count rates, therefore it was neglected in the anal-ysis. For the boron samples we found that above 1 keV neutron energy this background contributed ≈ 2% and was subtracted. No background could be expected from C, O and F present in the samples, as their (quite small) cross sections for the production of charged particles have thresholds of the order of several MeV. As for hydrogen, that is contained in the uranium samples, elastic scatter-ing could yield lower energy neutrons which in principle could be captured in the samples and produce additional counts. However, due to the low thickness of the samples, the maximum background contribution from such multiple interactions, i.e. at thermal energy, was<10−5 on 235U
and10B, and<10−3 on6Li, not even taking into account
the backward placement and the reduced solid angle of the10B and6Li samples, and therefore was neglected. The
same holds for background produced by neutrons (back) scattered from uranium.
2.2 Neutron beam fraction and detection efficiency
The measurement aimed at determining the 235U(n,f)
cross section relative to the standard ones of6Li(n,t) and 10B(n, α) reference reactions. This goal can be achieved by
means of the so-called “ratio method”, according to the following equation:
σ235
U=
C235
Ufrefρrefεref
Creff235Uρ235Uε235U
σref. (1)
Here,CXis the number of counts for a given sample X,
ρX is the areal density for that sample,fX is the neutron
beam fraction intercepting it and εX the detection
effi-ciency for the corresponding reaction products. All these quantities, apart from ρX, are a function of neutron
en-ergy. The main advantage of the ratio method is that it al-lows one to almost completely neglect the neutron fluence and its energy dependence, because the neutron beam in-cident on the235U and reference samples is practically the
same. Small differences in the neutron beam impinging on each sample, related to the geometrical shape of the sam-ple and to the neutron beam absorption along the setup (i.e.in the various samples and detectors) are taken into
account by the correction factorfX. This was estimated by
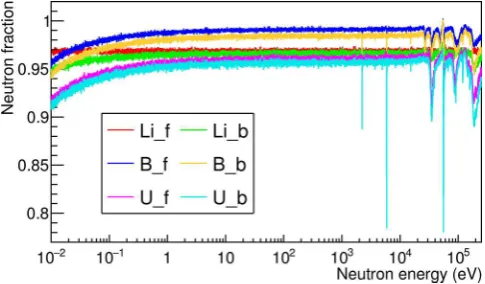
[image:8.595.308.551.91.233.2]Monte Carlo simulations of the neutron interaction with all the layers of different materials encountered along its trajectory. To this purpose the full geometry of the appa-ratus was implemented in detail in the GEANT4 Monte Carlo code [29]. 1.25·107 incident neutrons per decade were randomly generated in the 10 meV to 1 MeV energy range, each decade divided into 1000 bins, with a uniform probability inside each bin. The geometrical distribution of these neutrons in the transverse plane was Gaussian with a standard deviation of 7 mm, reflecting the known spatial profile of the neutron beam. The propagation of the simulated beam through the experimental apparatus allowed us to evaluate the effective fraction of neutrons impinging on each sample. The results for the different
Fig. 8.Simulation of the fraction of the neutron beam imping-ing on each sample. Between 1 eV and 30 keV neutron energy, the neutron absorption is rather flat. In the thermal region, and above 30 keV where the capture resonances in the silicon and in the aluminum of the sample backing set in, the absorption reaches several percent.
samples are shown in fig. 8. Between 1 eV and 30 keV the neutron beam fraction is rather flat for all samples, whereas in the thermal region, and above 30 keV where the capture resonances in the silicon and in the aluminum backings set in, the absorption may reach several percent, and is particularly large for the last sample and for the main Al and Si resonances.
The detection efficiency εX in eq. (1) needs also to
be determined with high accuracy for all measured re-actions, taking into account the geometrical efficiency of the silicon detector as well as the detection threshold and other conditions used in the analysis. To this aim, the same Monte Carlo simulations previously described were also employed. The only difference is that instead of start-ing from a neutron beam impstart-ingstart-ing on the sample, which would have been time consuming due to the tiny reaction probabilities, the GEANT4 simulations were performed by generating directly the reaction products, uniformly emit-ted from the reference samples according to the transverse beam profile. In the simulations, the angular distribution of the particles emitted from the samples was generated according to ENDF-B/VIII data [10, 30], for twelve neu-tron energies from thermal to 170 keV.
In each of the twelve simulations, the neutron energy was also considered to account for the kinematic boost of the reaction products. For each of the6Li and10B samples,
and for each neutron energy, 105reactions were simulated,
with the reaction products from each sample transported until they hit the detectors or exited the experimental setup. The energy deposited in the silicon detectors was recorded and a suitable resolution was applied so as to re-produce the measured amplitude spectra, as can be seen for instance in fig. 7 for the Li b detector. As for the235U
Fig. 9.Detection efficiency as a function of the neutron energy for the Li f (solid line) and Li b (dotted line) detectors. The reduced efficiency of Li f is due to the higher threshold adopted, which only considers part of the tritons for the data analysis (see text).
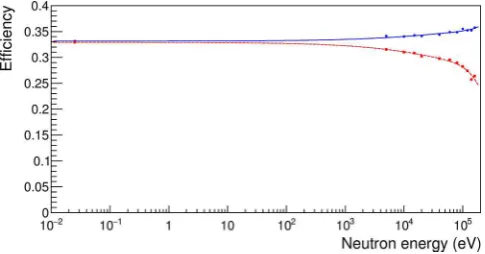
Fig. 10. Detection efficiency as a function of the neutron en-ergy for the B f (solid line) and B b (dotted line) detectors.
normalize the final cross section to a standard value (see also sect. 3.2).
The detection efficiency depends on the threshold used in the analysis,i.e.the one shown by the curves in figs. 3–
5. In order to use in the simulations a threshold consistent with the one used on the data, the amplitude spectra for the detectors Li f, Li b, B f and B b were calibrated in en-ergy by fitting them to the simulated ones, thus allowing us to calculate the energy-dependent thresholds in energy units. Finally, a polynomial fit of the efficiency as a func-tion of the neutron energy for the twelve simulated points provided a reliable analytical form of the detection effi-ciency, as shown in fig. 9 for Li f, Li b, and in fig. 10 for B f, B b. The reduced efficiency of Li f in fig. 9 is a conse-quence of the high threshold previously mentioned, which rejects a fraction of the tritons in the data analysis. Above about 1 keV neutron energy the efficiency in the forward direction increases, with a corresponding decrease in the backward direction, as expected from the kinematic boost. Above 10 keV the angular distribution of tritons from the
6Li(n,t) reaction becomes forward peaked, due to the
p-wave resonance at 235 keV, and this affects the shape of the efficiency of the Li f and Li b detectors (fig. 9). An overall check of this procedure, done by comparing the plots in fig. 9 and fig. 10 with the expected distributions
from ENDF-B/VIII for two single angles (0◦ and 180◦)
showed a very similar behavior.
2.3 Systematic uncertainties
The systematic uncertainty on the areal density of the samples was 1% for U, 1.5% for Li, and 6% for B. Two other sources of systematic uncertanty were investigated, namely the choice of the event selection cuts and the align-ment of the setup with respect to the beam. The former influences the number of counts (see eq. (1)) for the indi-vidual reactions, as well as the calculated detection effi-ciency, whereas the latter could bear some impact on the fraction of the neutron beam impinging on the various samples. The data analysis and Monte Carlo efficiency calculations were performed with six different cuts ob-tained by shifting the nominal energy-dependent threshold by±1%,±2%,±3% (which lead to relevant variations in terms of counts). Nonetheless, the variation of the reaction yields corresponding to the ±3% shift of the amplitude cuts (worst case scenario) is±0.3% for the6Li data and
≤1% for10B data. No appreciable effect was observed for
the235U data.
The experimental apparatus was initially aligned to the nominal beam position. However, the real posi-tion of the neutron beam was then checked throughout the measurement by means of a photographic emulsion (Gafchromic foil) placed in front of the vacuum chamber hosting the setup. The effective beam center position was found to be displaced by 10.0 (7) mm and 5.0 (7) mm, re-spectively in the horizontal and vertical direction, with respect to the detector center. This was adopted as the reference beam center for the efficiency simulations and data analysis. To estimate the uncertainty related to the detector alignment, the data analysis and Monte Carlo ef-ficiency calculations were performed again by shifting the reference beam center up to±2 mm (about 3 standard de-viations) in X and Y. We verified that such a shift leads to a slight change of efficiency which is roughly linear with the displacement, resulting≤1% for a shift of one stan-dard deviation.
These sources of systematic uncertainty, combined in quadrature, would point to a reasonable (and conserva-tive) estimate for the systematic uncertainty of the abso-lute yield of about 1.3% for U, 1.6% for Li, and 6% for B. However, as the data were later normalized as shown in sect. 3.2, these uncertainties do not play any role. The only remaining uncertainties are on the IAEA reference value used for normalization (1.2%), the beam attenua-tion correcattenua-tions at low energy (0.3%) and, finally, the un-certainty on the efficiency corrections for the forward and backward emission of6Li and10B products which at high
[image:9.595.48.291.297.424.2]3 Results
3.1 The 6Li(n,t)to 10B(n, α)cross section ratio
A validation of the experimental technique and analysis method can be obtained from the results of the 6Li(n,t)
and10B(n, α) reactions. In particular, although the
deter-mination of the 235U(n,f) cross section does not require
the knowledge of the neutron flux, it is useful in this con-text to reconstruct it from the data relative to the two reference reactions (the term “neutron flux” refers here for simplicity to the energy distribution of the total num-ber of neutrons in a bunch, a quantity that should be more appropriately called “instantaneous intensity”). In this work, the neutron flux was reconstructed indepen-dently with each of the four Li f, Li b, B f and B b targets and detectors, according to the following expressions:
ΦLi f = CLi f
fLi f·(1−e−ρLi f·σLi f)·εLi f
;
ΦLi b=
CLi b
fLi b·(1−e−ρLi b·σLi b)·ε
Li b
(2)
ΦB f =
CB f
fB f·ρB f ·σB f·εB f
;
ΦB b =
CB b
fB b·ρB b·σB b·εB b
. (3)
Here C represents the number of counts normalized to the nominal proton bunch of 7×10¹² protons, andσ
the standard cross sections for the two reference reactions (taken from the IAEA reference file [31]), with all the other factors defined as in eq. (1). Except for the areal density, all quantities in the expressions are a function of neutron energy. Since the two Li samples are rather thick, the self-absorption of the neutron beam in the sample is taken into account in eq. (2) (by means of a simplified expression), while on the contrary, for both the10B and235U samples,
such a correction is very small, of the order of 10−4, and
can therefore be neglected. Ideally, the four expressions above should give the same flux. However, while the shape (i.e.the neutron energy dependence) is similar for the four
detectors, a few percent difference in the absolute value is observed. A comparison of the integral in the 1–10 eV range leads to a ratioΦLi f/ΦLi b= 0.967 andΦB f/ΦB b=
1.109, hinting at a difference of about 3% between the areal densities of the two 6Li samples and of about 10%
between the 10B ones.
To overcome the effect of the different areal densities, the four different results on the neutron flux were all nor-malized to each other in the 1–10 eV range. The weighted averages were then calculated between the two6Li and
be-tween two10B samples, so as to obtain a unique flux for
each of the two reference reactions (referred to hereafter as ΦLi and ΦB). The corresponding results are shown in
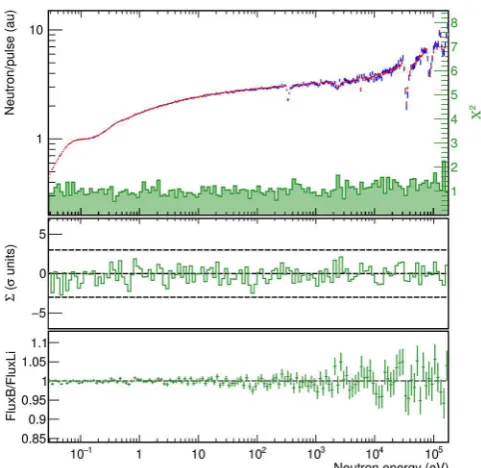
[image:10.595.307.548.90.324.2]fig. 11, where an almost perfect agreement can be seen. For a more quantitative comparison between the two different results, the following three statistical indicators were constructed, as a function of the neutron energy:
Fig. 11.The neutron flux as evaluated in the present work by using data from the6
Li and the10
B samples. See the text for the meaning of the other statistical indicators.
– The ratio between the flux extracted on the basis of the two reference reactions, which provides a numerical indication of the mutual deviation in relative units. – The normalized deviationΣbetween the two
distribu-tions, in standard deviation units, rebinned in groups of 50 points so to increase its statistical significance. This quantity provides a numerical indication of sta-tistically relevant systematic deviations between two distributions.
– The reduced χ2 between the two distributions,
cal-culated in groups of 50 points, which provides infor-mation on their mutual agreement (typically between data and a reference model). χ2 is quite useful as an
indication of the shape (dis)agreement between the two distributions mentioned above, where we took as model the6Li data because of the better statistics.
The following expressions were used for the two statis-tical indicators mentioned above:
χ2
k=
1 50
50
i=1
(yi−Yi)2 σ2
yi
, Σk=
50
i=1(yi−Yi)
50
i=1σ2yi
. (4)
Equations (4) indicate how χ2 and Σ are calculated in a wider bink by means of 50 consecutive smaller bins indexed byi. Herey stands for the data values with un-certaintyσy,Y for the model values. These indicators are
quite useful to identify possible statistically significant de-viations between two distributions, and are reported in the three panels of fig. 11. In particular, the ratioΦB/ΦLi is
shown as a function of energy, along with the normalized deviationΣ in standard deviation units and the reduced
χ2ofΦ
Fig. 12.Ratio of the corrected10 B to6
Li count rates (dots), along with the corresponding ratio between the standard cross sections from the evaluated data files [31] (line).
1 within ≈1% up to 1 keV, while fluctuations of several percent are present above a few keV, due to the higher sta-tistical uncertainty in that region forΦB, in consequence of
the small mass of the10B samples. As expected, theχ2 is
uniformly distributed around 1, while the normalized de-viationΣkeeps symmetrical around±1–2 standard devia-tions, proving that the two independent reconstructions of the incident neutron flux are consistent with each other. It is worth noticing that in the neutron energy region below 100 meV the quantity Σ points to a statistically signifi-cant difference between the B and Li results, likely due to small uncertainties in the neutron beam fractions whose effect is amplified by the higher cross section at low en-ergy. However, this difference is below 1% and within the estimated systematic uncertainty.
While the results discussed above show the correct-ness of the data for the reference reactions, a more direct evidence of the reliability of the 10B and 6Li data can
be obtained by constructing the ratio of the respective count rates (corrected by the neutron beam fraction and efficiency previously described). Figure 12 shows such a ratio, compared with the ratio between the10B(n, α) and 6Li(n,t) standard cross sections (from the evaluated data
files [31]). In this case as well, the relatively large uncer-tainty related to the sample thickness has been eliminated by normalizing the measured ratio to the evaluated one, in the 1–10 eV neutron energy range.
3.2 The 235U(n
,f)cross section
As in the case of the reference reactions, to determine the 235U(n,f) cross section the weighted average of the
count rate in the backward and forward detector CU b
and CU f, respectively, was computed. In this case, the
two distributions are virtually identical (i.e. no
statisti-cally significant difference between the two data sets is observed, as expected in consideration of the isotropic emission of the fission fragments). Two different235U(n,f)
cross sections were computed according to eq. (1), rel-ative to the 6Li(n,t) and to the 10B(n, α) reactions
us-Fig. 13.Ratio between the235
U(n,f) cross section at the ther-mal point and the integrated cross section in the 7.8–11.0 eV neutron energy interval for several evaluations and the data of this work, separately with respect to Li and B, and their weighted average. The error bars for our data only include sta-tistical uncertainty.
ing the corresponding weighted average of the forward and backward distributions. The individual cross sec-tions shown throughout this work have been calculated at 1000 bin/decade. They are available in table 4 in the appendix, rebinned at 20 bin/decade, together with the yield ratios corrected according to eq. (1). For the sake of simplicity all results shown in sect. 4.2 will refer to a single235U(n,f) cross section obtained from a single
refer-ence flux, computed as weighted average betweenΦB and
ΦLi.
In order to rule out the unknown detection efficiency
εU the three versions of the cross section were
normal-ized to a standard value of the 235U(n,f) cross section
[image:11.595.310.549.92.234.2]Table 2.Comparison of the relevant standard values between IAEA and the present work computed using6
Li and10
B reference fluxes.
Ratioσ(0.025 meV)/integral (σ) [7.8,11] eV [eV−1] integral (σ) [7.8,11] eV [b·eV]
IAEA 2.373±0.029 247.5±3
6
Li ref. flux 2.353±0.013(stat)±0.007(syst) 249.6±1.4(stat)±0.94(syst)
10
B ref. flux 2.343±0.019(stat)±0.007(syst) 250.7±2.0(stat)±0.95(syst)
(6 Li +10
B) ref. flux 2.352±0.013(stat)±0.007(syst) 249.7±1.4(stat)±0.94(syst)
Table 3. Cross section values by IAEA, and corresponding values from n TOF separately with reference to lithium and boron, in the intervals defined by the GMA nodes [7, 8]. The values for the energy groups (@) are averaged in the corresponding interval, above 20 keV the cross sections are point values. The normalized deviationΣand the ratio are also listed.
En [keV] Range IAEA unc. n TOF [Li] stat. n TOF [B] stat. n TOF Li/ stat. n TOF B/ stat. Σ Σ
GMA node [keV] c.s. [b] [b] c.s. [b] unc. [b] c.s. [b] unc. [b] IAEA unc. IAEA unc. [Li - IAEA] [B - IAEA]
0.15 @ 0.1–0.2 21.267 0.276 21.069 0.102 21.028 0.138 0.991 0.005 0.989 0.006 −1.9 −1.7
0.25 @ 0.2–0.3 20.782 0.270 20.853 0.132 20.714 0.184 1.003 0.006 0.997 0.009 0.5 −0.4
0.35 @ 0.3–0.4 13.194 0.172 13.149 0.125 12.888 0.159 0.997 0.009 0.977 0.012 −0.4 −1.9 0.45 @ 0.4–0.5 13.845 0.180 13.706 0.138 13.682 0.185 0.990 0.010 0.988 0.013 −1.0 −0.9 0.55 @ 0.5–0.6 15.244 0.198 14.920 0.156 15.244 0.223 0.979 0.010 1.000 0.015 −2.1 0.0
0.65 @ 0.6–0.7 11.566 0.150 11.564 0.146 11.259 0.187 1.000 0.013 0.973 0.016 0.0 −1.6
0.75 @ 0.7–0.8 11.153 0.145 11.203 0.158 11.197 0.212 1.005 0.014 1.004 0.019 0.3 0.2
0.85 @ 0.8–0.9 8.252 0.107 7.860 0.132 7.862 0.171 0.953 0.016 0.953 0.021 −3.0 −2.3
0.95 @ 0.9–1 7.538 0.098 7.452 0.127 7.417 0.163 0.989 0.017 0.984 0.022 −0.7 −0.7
1.5 @ 1–2 7.339 0.095 7.289 0.056 7.350 0.075 0.993 0.008 1.002 0.010 −0.9 0.1
2.5 @ 2–3 5.412 0.070 5.550 0.065 5.399 0.083 1.025 0.012 0.998 0.015 2.1 −0.2
3.5 @ 3–4 4.808 0.063 4.739 0.067 4.713 0.089 0.986 0.014 0.980 0.018 −1.0 −1.1
4.5 @ 4–5 4.282 0.056 4.302 0.072 4.329 0.097 1.005 0.017 1.011 0.023 0.3 0.5
5.5 @ 5–6 3.857 0.050 3.732 0.075 3.708 0.098 0.967 0.019 0.961 0.025 −1.7 −1.5
6.5 @ 6–7 3.308 0.043 3.251 0.070 3.169 0.090 0.983 0.021 0.958 0.027 −0.8 −1.5
7.5 @ 7–8 3.251 0.042 3.231 0.079 3.187 0.103 0.994 0.024 0.980 0.032 −0.3 −0.6
8.5 @ 8–9 3.019 0.039 3.030 0.080 2.915 0.101 1.004 0.026 0.965 0.033 0.1 −1.0
9.5 @ 9–10 3.135 0.041 2.928 0.077 2.919 0.103 0.934 0.025 0.931 0.033 −2.7 −2.1
15 @ 10–17.5 2.504 0.033 2.518 0.033 2.592 0.047 1.006 0.013 1.035 0.019 0.4 1.9
20 17.5–22 2.353 0.042 2.276 0.047 2.280 0.064 0.967 0.020 0.969 0.027 −1.7 −1.1
24 22–27 2.162 0.028 2.143 0.046 2.109 0.062 0.991 0.021 0.976 0.029 −0.4 −0.8
30 27–37.5 2.080 0.027 2.089 0.043 1.984 0.059 1.004 0.021 0.954 0.028 0.2 −1.6
45 37.5–50 1.852 0.024 1.849 0.038 1.828 0.054 0.999 0.020 0.987 0.029 −0.1 −0.4
55 50–60 1.814 0.024 1.829 0.043 1.757 0.060 1.008 0.024 0.969 0.033 0.4 −1.0
65 60–70 1.755 0.023 1.775 0.042 1.786 0.063 1.012 0.024 1.018 0.036 0.5 0.5
75 70–80 1.682 0.022 1.611 0.042 1.610 0.062 0.958 0.025 0.957 0.037 −1.7 −1.2
85 80–90 1.598 0.021 1.629 0.055 1.570 0.080 1.019 0.035 0.983 0.050 0.6 −0.3
95 90–97.5 1.577 0.021 1.661 0.063 1.693 0.092 1.053 0.040 1.074 0.059 1.3 1.3
100 97.5–110 1.587 0.021 1.577 0.042 1.466 0.061 0.994 0.027 0.924 0.038 −0.2 −2.0 120 110–135 1.500 0.020 1.480 0.029 1.473 0.045 0.986 0.019 0.982 0.030 −0.7 −0.6
150 135–160 1.436 0.019 1.363 0.033 1.384 0.055 0.949 0.023 0.964 0.039 −2.2 −0.9
[image:12.595.55.546.246.700.2]We assumed a conservative value of 0.3%. For the sys-tematic uncertainty in the integral we also included the uncertainty in the standard thermal cross section, that was added in quadrature. This is an important result, as it supports the validity of the integral between 7.8 and 11 eV as a reference for normalization.
The following remarks summarize the calculations de-scribed above and the corresponding results:
– The independent normalization of the count rate of the reference reactions in the 1–10 eV region, eliminates completely the systematic uncertainty related to the areal density of the used reference samples, or their possible inhomogeneity. Furthermore, normalizing in this energy range, rather than at thermal energy, fur-ther minimizes the overall uncertainty, considering the larger uncertainty in the thermal neutron energy re-gion previously seen (fig. 11).
– An additional systematic uncertainty is related to the angular distributions of the products in the 6Li(n,t)
and 10B(n, α) reactions as a function of neutron
en-ergy. Indeed, even though reasonable evaluations are available [10], the true angular distributions are not ex-actly known. This has an impact on the efficiency cal-culations. Due to possible differences between ENDF-B/VIII and the real angular distributions, slight resid-ual differences between results from the forward and backward detectors could still be present. These pos-sible differences were however further smeared out by using the weighted average between forward and back-ward data, thus obtaining two distinct reference data sets (lithium and boron).
– These two data sets, after checking their mutual statis-tical consistency (fig. 11), were further combined into a weighted average in order to be used as a final refer-ence for the235U(n,f) cross section in all the following
plots.
– A further normalization of the ratio between the
235U(n,f) data and the combined ones for the
refer-ence reactions was performed relative to the integral in the 7.8–11.0 eV range, thus eliminating the uncer-tainty on the areal density (and inhomogeneities) of the235U sample and on the detection efficiencyε
U.
Based on the above considerations, it can be estimated that the235U(n,f) cross section (or cross section ratio
rel-ative to the individual reference reactions) are affected by an overall systematic uncertainty of about 1.5% in the whole energy region.
4 Comparisons
Even though the initial purpose of the present experi-ment and data analysis was to investigate in better detail the cross section in the neutron energy range around 10– 30 keV, the combination of the convenient features of the n TOF neutron beam with the high performance of the newly developed experimental apparatus and technique has led to high accuracy, high-resolution data in a much wider range, from thermal neutron energy to 170 keV.
4.1 Comparison with the IAEA reference data
A check of the measured cross section was performed ver-sus the neutron cross section reference recommended by
IAEA [8]. Such a reference is provided as a set of cross sec-tion values at predetermined energy points named GMA nodes, which come from a complex minimization proce-dure (named GMAP) over many datasets from different experiments. In order to calculate the values to be com-pared to the IAEA cross section we followed the prescrip-tions in refs. [7] and [8]: the reference values between the GMA nodes at 0.15 and 15 keV are to be intended as average cross sections in the corresponding energy inter-vals, whereas those above 15 keV are pointwise cross sec-tions; linear-linear interpolation is recommended between GMA nodes. Therefore the measured cross section was averaged in the recommended intervals up to the GMA node at 15 keV. We remark that the boundary between the GMA nodes at 9.5 and 15 keV was modified with re-spect to ref. [8] from 12.25 to 10 keV, according to ref. [32]. In order to obtain statistically stable pointwise cross sec-tions for the higher energy GMA nodes, due to the lower statistics, we performed linear fits of the data points in the prescribed intervals and interpolated at the requested energy.
The resulting values with their respective statisti-cal uncertainties, separately statisti-calculated with lithium and boron as reference, are listed in table 3 along with the IAEA recommended values with comparable uncertain-ties. Their ratios to the IAEA values and the normalized deviationsΣ are listed in the table and plotted in fig. 14. By looking at the plot one observes a few points hint-ing at statistically significant differences between the data and the IAEA reference, possibly indicating the need of further investigations by the evaluators. Additional hints come from the comparison with the evaluated libraries, as will be shown in sect. 4.2.
4.2 Comparison with the evaluated libraries
The235U(n,f) cross sectionσ235U, in the full energy range
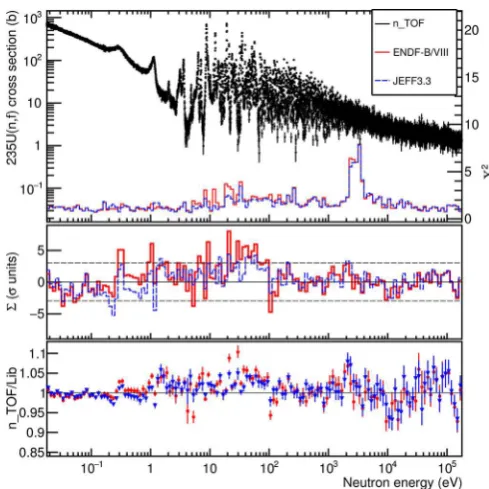
explored (0.02 eV–170 keV), is shown in the top panel of fig. 15 which summarizes the main issues. One can ob-serve four distinct energy intervals (below 1 eV, between 1–100 eV, between 100–1000 eV, above 1 keV). The eval-uated libraries are based on various sets of fission cross sections which are normalized to each other. The present data, encompassing the full energy range in a single mea-surement, could definitively solve all the existing discrep-ancies. The lower part of the panel shows the reducedχ2
with respect to the ENDF-B/VIII and JEFF3.3 evalua-tions, the middle panel contains the normalized deviation
Σ between the current results and the libraries, whereas the lower panel shows the ratios of the current data to the two libraries. The same plots for the ENDF-B/VII and JENDL-4.0 libraries are shown in fig. 16.
Fig. 14. Top panel: ratio between the n TOF and the IAEA 235
U(n,f) cross section in the GMA nodes recommended by IAEA. The n TOF cross section is reported separately with ref-erence to boron and to lithium. The horizontal bars indicate the averaging interval, the symbols are placed at the corre-sponding GMA node energy. From 20 keV up the cross section is to be intended as pointwise, therefore no horizontal bar was drawn. Bottom panel: the normalized deviationΣ.
JENDL-4.0 fail to reproduce the current data in several regions: both at low energy (<1 eV) and in the resolved resonance region up to 200 eV the quantity Σ indicates a statistically significant deviation which is also visible in the bottom panel as a shift of several percent. This is not the case with the more recent evaluations (ENDF-B/VIII and JEFF3.3) of fig. 15, where |Σ| ≤ 3 almost everywhere, especially for JEFF3.3. In particular, up to 1 eV neutron energy the present data agree with the re-cent evaluations within 1%, whereas differences of several percent (up to 10% in some regions) are observed in the re-solved resonance region, up to 100 eV. Such differences are most likely related to local mismatches in the amplitude or shape of some resonances, which lead to a correspond-ing sharp fluctuation ofΣ(mismatched amplitude) or to a peak inχ2(mismatched shape), thus probably indicating
a lower accuracy of the evaluation in that region. From 100 eV to 10 keV a reasonable agreement, of the order of 2%, is again observed.
The large χ2 between data and evaluations observed
[image:14.595.46.292.92.362.2]in fig. 15 in the 2–4 keV region is simply related to the presence, in the n TOF data, of resonance-like structures not reported in the evaluations (we remark here that the boundary between resolved and unresolved resonance re-gions in the evaluations is somewhat arbitrary). For the
Fig. 15. Top panel: the final measured235
U(n,f) cross sec-tion of this work, obtained from the ratio method relative to the weighted average of the6
Li(n,t) and10
B(n, α) data; in the lower part the reducedχ2
with respect to the ENDF-B/VIII and the JEFF3.3 evaluations is shown. Middle panel: the nor-malized deviationΣbetween the current data and the two li-braries; the dashed lines indicate the±3σlevel. Bottom panel: the ratio of the current data to the two libraries.
same reason a very large peak inχ2is visible even at lower energy in fig. 16 for the JENDL-4.0 evaluation, starting at 500 eV that is where the resolved resonance region stops in such library. Finally, in the region from 30 to 100 keV differences of several percent are observed between the present data and all evaluations, although with a rela-tively low statistical significance because of the larger sta-tistical error. In the following we will focus on the region above 2.2 keV and in particular up to 30 keV, leaving to a forthcoming paper a more detailed analysis of the resolved resonance region.
5 Discussion
A zoom of fig. 15 in the neutron energy range from 1 to 10 keV is shown in fig. 17. As previously mentioned, above 2.25 keV the evaluations do not report any struc-tures but rather an average behavior. This is likely due to the lack of experimental data [33] or perhaps to the fact that in the evaluation process these structures might have been attributed to statistical fluctuations in the data sets adopted as reference. On the contrary, the present results unambiguously show that several structures do exist, as proved by the behavior of the statistical indicators, with theχ2 rising up to 8 between 2.25 and 4 keV to indicate
a definite shape mismatch (the χ2 behavior is the same
Fig. 16. Top panel: the final measured235
U(n,f) cross sec-tion of this work, obtained from the ratio method relative to the weighted average of the 6
Li(n,t) and 10
B(n, α) data; in the lower part the reduced χ2
with respect to the ENDF-B/VII and the JENDL-4.0 evaluations is shown. Middle panel: the normalized deviationΣ between the current data and the two libraries; the dashed lines indicate the ±3σlevel. Bottom panel: the ratio of the current data to the two libraries.
Fig. 17. Top panel:235
[image:15.595.310.550.92.443.2]U(n,f) cross section of this work (with χ2,Σand ratio), in the 1–10 keV neutron energy range, along with the corresponding data from the ENDF-B/VIII and the JEFF3.3 evaluations.
Fig. 18.Top: simulation of the235
U(n,f) cross section where a resonance grouping shows up clearly, due primarily to Doppler broadening (see the text). Bottom: n TOF and ENDF-B/VIII cross section data in the same energy range.
theΣ behaviour, with no relevant deviation, signals that on average the data trend correctly follows the latest eval-uations. These indicators clearly show that the observed structures are significant and not due to statistical fluctu-ations.
In order to prove this, similarly to the procedure ex-ploited in ref. [19], the level sequence of compound states distribution in235U + n was simulated just above the
neu-tron separation energy S(n) = 6.544 MeV, assuming a GOE surmise [34] and adopting an average level spacing
D0 = 0.54 eV. From the generated sets of neutron reso-nances, the neutron induced fission cross section for235U was simulated. It can be shown that, up to approximately 2 keV neutron energy, the various components of the en-ergy resolution at EAR1 are dominated by the Doppler broadening. This effect can be seen in the top panel of fig. 18, which clearly shows the resonance grouping result-ing from this simulation, qualitatively compatible with the observed structures in the measured data (fig. 18, bot-tom). Above 4 keV the χ2 decreases, because of the
[image:15.595.44.291.450.695.2]Fig. 19. 235
U(n,f) measured cross section of this work, in the 2–100 keV neutron energy range (withχ2
,Σ and ratio), compared to the ENDF-B/VIII and JEFF3.3 evaluations.
therefore no significant statement can be made about pos-sible structures in the cross section.
Between 8 and 100 keV the present data show system-atic deviations from the evaluations, as can be clearly ob-served in fig. 19. The trend is not unique: below 30 keV the present data are lower than the evaluations by up to 8%, while between 30 and 100 keV the measured n TOF cross section is slightly higher. The observed discrepancy in the 10–30 keV region seems to confirm the previous indication of a shortcoming of major evaluated data libraries in that energy region [1].
For a more quantitative assessment of the observed discrepancy, fig. 20 reports the ratio between the n TOF cross section, integrated in a few relevant neutron en-ergy regions, and the corresponding evaluated data. For completeness we included the evaluations from ENDF-B/VII, ENDF-B/VIII, JEFF3.3, JENDL-4.0. We also in-cluded the IAEA data obtained following the prescription of linear interpolation between GMA nodes. The measured cross section, integrated between 9 and 30 keV, shows a de-viation of 1.5–2.5% relative to the evaluated data, point-ing to a slight overestimate in the latter, as previously mentioned. An interesting conclusion can be drawn by splitting this energy range into two separate intervals, 9– 18 keV and 18–30 keV and comparing the integrals with the corresponding integrals from the libraries. For the first integral a deviation up to 4.5% is observed (Σ < −3 for ENDF-B/VIII, JEFF3.3 and IAEA), and this is a sig-nificant indication that in that neutron energy range the cross section evaluation is overestimated and likely calls for a revision of these libraries.
[image:16.595.309.550.90.271.2]The second integral (18–30 keV) is in agreement with the evaluations within the statistical uncertainty. Between
Fig. 20.Top panel: ratio between the measured cross section, integrated in a few relevant intervals, and the corresponding values for the five reference libraries B/VII, ENDF-B/VIII, JEFF3.3, JENDL-4.0, IAEA. Bottom panel: the cor-responding normalized deviationΣ(standard deviation units).
Fig. 21.Detail of the cross section around the GMA nodes at 8.5, 9.5 and 15 keV for n TOF, ENDF-B/VIII and the IAEA prescribed linear interpolation. The plot shows how a single inaccurate value (in this case the point at 9.5 keV) can give rise to a systematic overestimate of the cross section. This is the reason whyΣ <−3 in the 9–18 keV interval in fig. 20.
[image:16.595.308.550.347.513.2]Table 4. 235
U(n,f) cross section, referred to6 Li, 10
B and to the weighted average between6
Li and10
B data. Also listed are the ratios U/Li and U/B between the normalized yields. The data were binned at 20 bin/decade.
Bin start Bin end σ235
U 235
U/6
Li
∆% σ
235
U 235
U/10
B
∆% σ
235
U
∆%
(eV) (eV) (ref6
Li) yield ratio (ref10
B) yield ratio (ref6
Li,10
B)
1.78E-02 2.00E-02 694.07 0.639 0.7 684.92 0.154 0.7 692.43 0.7
2.00E-02 2.24E-02 643.14 0.628 0.6 639.41 0.153 0.7 642.47 0.6
2.24E-02 2.51E-02 602.93 0.623 0.6 601.49 0.152 0.7 602.67 0.6
2.51E-02 2.82E-02 570.69 0.624 0.6 571.92 0.153 0.6 570.91 0.6
2.82E-02 3.16E-02 533.29 0.618 0.5 531.10 0.151 0.6 532.90 0.5
3.16E-02 3.55E-02 493.36 0.606 0.5 495.46 0.149 0.6 493.74 0.5
3.55E-02 3.98E-02 467.64 0.608 0.5 465.53 0.148 0.6 467.26 0.5
3.98E-02 4.47E-02 437.21 0.602 0.5 436.26 0.147 0.5 437.04 0.5
4.47E-02 5.01E-02 411.06 0.600 0.5 413.04 0.147 0.5 411.42 0.5
5.01E-02 5.62E-02 380.15 0.588 0.5 378.56 0.143 0.5 379.87 0.5
5.62E-02 6.31E-02 354.89 0.581 0.5 355.79 0.143 0.5 355.05 0.5
6.31E-02 7.08E-02 331.46 0.575 0.5 330.96 0.140 0.5 331.37 0.5
7.08E-02 7.94E-02 310.92 0.571 0.5 309.54 0.139 0.5 310.67 0.5
7.94E-02 8.91E-02 291.45 0.567 0.5 290.60 0.138 0.6 291.29 0.5
8.91E-02 1.00E-01 266.77 0.550 0.5 267.30 0.135 0.6 266.87 0.5
1.00E-01 1.12E-01 248.33 0.542 0.5 248.36 0.133 0.6 248.34 0.5
1.12E-01 1.26E-01 229.90 0.532 0.6 228.82 0.130 0.6 229.70 0.6
1.26E-01 1.41E-01 216.60 0.531 0.6 215.79 0.129 0.6 216.45 0.6
1.41E-01 1.58E-01 201.30 0.523 0.6 200.57 0.127 0.7 201.17 0.6
1.58E-01 1.78E-01 191.20 0.526 0.6 190.22 0.128 0.7 191.03 0.6
1.78E-01 2.00E-01 183.61 0.535 0.6 183.88 0.131 0.7 183.66 0.6
2.00E-01 2.24E-01 181.06 0.559 0.6 180.59 0.136 0.7 180.97 0.6
2.24E-01 2.51E-01 185.66 0.607 0.6 185.77 0.149 0.7 185.68 0.6
2.51E-01 2.82E-01 197.06 0.682 0.6 196.32 0.166 0.6 196.92 0.6
2.82E-01 3.16E-01 196.16 0.719 0.5 195.84 0.176 0.6 196.11 0.5
3.16E-01 3.55E-01 168.63 0.655 0.6 167.11 0.159 0.6 168.36 0.6
3.55E-01 3.98E-01 133.11 0.547 0.6 132.29 0.133 0.7 132.96 0.6
3.98E-01 4.47E-01 108.24 0.472 0.7 108.16 0.115 0.7 108.22 0.7
4.47E-01 5.01E-01 90.82 0.419 0.7 89.92 0.102 0.8 90.66 0.7
5.01E-01 5.62E-01 78.05 0.382 0.8 77.90 0.093 0.8 78.02 0.8
5.62E-01 6.31E-01 68.69 0.356 0.8 68.81 0.087 0.9 68.72 0.8
6.31E-01 7.08E-01 61.31 0.336 0.8 61.65 0.083 0.9 61.37 0.8
7.08E-01 7.94E-01 57.65 0.335 0.9 57.46 0.082 0.9 57.61 0.9
7.94E-01 8.91E-01 55.70 0.343 0.9 55.04 0.083 0.9 55.59 0.9
8.91E-01 1.00E+00 61.93 0.404 0.8 61.46 0.098 0.9 61.84 0.8
1.00E+00 1.12E+00 90.05 0.623 0.7 89.34 0.151 0.8 89.92 0.7
1.12E+00 1.26E+00 72.43 0.529 0.7 72.61 0.129 0.8 72.46 0.7
1.26E+00 1.41E+00 22.98 0.178 1.3 22.94 0.043 1.3 22.97 1.3
1.41E+00 1.58E+00 16.70 0.137 1.5 16.59 0.033 1.5 16.68 1.5
1.58E+00 1.78E+00 14.84 0.129 1.5 14.84 0.032 1.6 14.84 1.5
1.78E+00 2.00E+00 14.85 0.137 1.5 14.79 0.033 1.6 14.84 1.5
2.00E+00 2.24E+00 17.16 0.167 1.4 17.07 0.041 1.5 17.15 1.4
2.24E+00 2.51E+00 10.74 0.111 1.8 10.66 0.027 1.8 10.72 1.8
2.51E+00 2.82E+00 9.15 0.100 1.9 9.19 0.025 1.9 9.16 1.9
2.82E+00 3.16E+00 30.15 0.351 1.1 30.26 0.086 1.1 30.17 1.0
3.16E+00 3.55E+00 28.69 0.353 1.1 28.52 0.086 1.2 28.66 1.1
3.55E+00 3.98E+00 29.92 0.390 1.1 30.33 0.095 1.3 30.00 1.1
3.98E+00 4.47E+00 2.72 0.038 3.4 2.71 0.009 3.4 2.72 3.4
4.47E+00 5.01E+00 7.80 0.114 2.0 7.73 0.028 2.1 7.79 2.0
5.01E+00 5.62E+00 10.64 0.165 1.7 10.64 0.040 1.8 10.64 1.7
5.62E+00 6.31E+00 27.93 0.459 1.1 27.73 0.111 1.2 27.90 1.1
6.31E+00 7.08E+00 39.06 0.677 0.9 39.19 0.166 1.2 39.08 0.9
Table 4.Continued.
Bin start Bin end σ235
U 235
U/6
Li
∆% σ
235
U 235
U/10
B
∆% σ
235
U
∆%
(eV) (eV) (ref6
Li) yield ratio (ref10
B) yield ratio (ref6
Li,10
B)
7.94E+00 8.91E+00 153.59 3.011 0.6 154.00 0.739 1.1 153.66 0.6
8.91E+00 1.00E+01 69.42 1.428 0.7 69.12 0.348 0.9 69.36 0.7
1.00E+01 1.12E+01 17.72 0.386 1.3 17.64 0.094 1.4 17.71 1.3
1.12E+01 1.26E+01 79.93 1.846 0.8 77.18 0.447 1.1 79.43 0.7
1.26E+01 1.41E+01 40.86 1.005 0.9 41.02 0.246 1.1 40.89 0.9
1.41E+01 1.58E+01 28.86 0.749 1.0 28.44 0.182 1.2 28.79 1.0
1.58E+01 1.78E+01 25.06 0.688 1.1 24.65 0.167 1.3 24.99 1.1
1.78E+01 2.00E+01 114.45 3.330 0.7 114.11 0.815 1.2 114.39 0.7
2.00E+01 2.24E+01 34.66 1.079 1.0 34.72 0.260 1.5 34.67 1.0
2.24E+01 2.51E+01 49.72 1.627 0.8 50.24 0.401 1.1 49.81 0.8
2.51E+01 2.82E+01 44.48 1.547 0.8 44.59 0.379 1.1 44.50 0.8
2.82E+01 3.16E+01 12.96 0.475 1.5 12.84 0.115 1.7 12.94 1.4
3.16E+01 3.55E+01 102.81 4.022 0.7 103.18 0.991 1.1 102.87 0.6
3.55E+01 3.98E+01 34.15 1.413 1.0 34.27 0.346 1.4 34.17 1.0
3.98E+01 4.47E+01 32.95 1.439 0.9 32.95 0.353 1.2 32.95 0.9
4.47E+01 5.01E+01 34.80 1.606 0.9 34.64 0.392 1.3 34.78 0.9
5.01E+01 5.62E+01 67.30 3.293 0.7 66.58 0.799 1.1 67.17 0.7
5.62E+01 6.31E+01 43.96 2.276 0.9 44.26 0.561 1.4 44.01 0.9
6.31E+01 7.08E+01 20.12 1.104 1.3 19.84 0.267 1.9 20.07 1.3
7.08E+01 7.94E+01 27.88 1.611 1.0 27.97 0.398 1.4 27.89 1.0
7.94E+01 8.91E+01 28.81 1.771 1.0 29.13 0.442 1.4 28.87 1.0
8.91E+01 1.00E+02 22.64 1.476 1.1 22.86 0.365 1.5 22.68 1.1
1.00E+02 1.12E+02 17.33 1.203 1.3 17.38 0.293 1.6 17.34 1.2
1.12E+02 1.26E+02 23.21 1.701 1.1 22.72 0.413 1.5 23.12 1.1
1.26E+02 1.41E+02 26.71 2.074 1.1 26.61 0.509 1.5 26.69 1.1
1.41E+02 1.58E+02 19.32 1.590 1.2 19.53 0.393 1.6 19.36 1.2
1.58E+02 1.78E+02 23.44 2.053 1.1 23.76 0.505 1.6 23.50 1.1
1.78E+02 2.00E+02 16.61 1.535 1.3 16.37 0.372 1.7 16.57 1.3
2.00E+02 2.24E+02 22.16 2.172 1.2 22.02 0.526 1.6 22.13 1.1
2.24E+02 2.51E+02 21.20 2.199 1.2 21.23 0.541 1.6 21.20 1.1
2.51E+02 2.82E+02 25.29 2.772 1.1 24.87 0.665 1.6 25.21 1.1
2.82E+02 3.16E+02 11.44 1.327 1.5 11.37 0.324 2.0 11.43 1.5
3.16E+02 3.55E+02 16.15 1.973 1.5 15.80 0.475 1.9 16.09 1.4
3.55E+02 3.98E+02 11.39 1.488 1.6 11.19 0.361 2.0 11.35 1.5
3.98E+02 4.47E+02 13.61 1.878 1.4 13.70 0.468 1.9 13.63 1.4
4.47E+02 5.01E+02 13.51 1.986 1.4 13.39 0.481 1.9 13.49 1.4
5.01E+02 5.62E+02 14.89 2.316 1.4 15.04 0.574 1.9 14.91 1.3
5.62E+02 6.31E+02 13.66 2.250 1.4 13.80 0.552 2.0 13.69 1.4
6.31E+02 7.08E+02 11.07 1.923 1.6 10.86 0.469 2.1 11.04 1.5
7.08E+02 7.94E+02 11.40 2.099 1.5 11.43 0.520 2.1 11.40 1.5
7.94E+02 8.91E+02 7.92 1.546 1.8 7.89 0.379 2.3 7.91 1.7
8.91E+02 1.00E+03 7.70 1.588 1.8 7.68 0.392 2.3 7.69 1.8
1.00E+03 1.12E+03 7.92 1.729 1.8 8.11 0.439 2.4 7.95 1.8
1.12E+03 1.26E+03 9.24 2.149 1.7 9.28 0.528 2.3 9.25 1.7
1.26E+03 1.41E+03 7.80 1.917 1.8 7.85 0.479 2.4 7.80 1.8
1.41E+03 1.58E+03 6.46 1.687 1.9 6.42 0.413 2.5 6.45 1.9
1.58E+03 1.78E+03 6.67 1.839 1.9 6.73 0.459 2.5 6.68 1.9
1.78E+03 2.00E+03 6.65 1.946 2.0 6.73 0.489 2.6 6.66 1.9
2.00E+03 2.24E+03 5.62 1.728 2.2 5.34 0.411 2.8 5.57 2.2
2.24E+03 2.51E+03 5.93 1.944 2.2 5.94 0.483 2.9 5.93 2.1
2.51E+03 2.82E+03 5.46 1.895 2.2 5.08 0.442 2.9 5.40 2.2

![Fig. 12. Ratio of the corrected 10B to 6Li count rates (dots),along with the corresponding ratio between the standard crosssections from the evaluated data files [31] (line).](https://thumb-us.123doks.com/thumbv2/123dok_us/1769886.130850/11.595.51.289.86.249/ratio-corrected-count-corresponding-standard-crosssections-evaluated-les.webp)
![Table 3. Cross section values by IAEA, and corresponding values from n TOF separately with reference to lithium and boron,in the intervals defined by the GMA nodes [7,8]](https://thumb-us.123doks.com/thumbv2/123dok_us/1769886.130850/12.595.65.527.120.196/cross-section-corresponding-separately-reference-lithium-intervals-dened.webp)