An earlier version of this paper was prepared for the European Parliament's Committee on Economic and Monetary Affairs − this Working Document is published with the kind permission of the EP Committee.
CEPS Working Documents are intended to give an indication of work being conducted within CEPS’ research programmes and to stimulate reactions from other experts in the field. The opinions expressed in this document are the sole responsibility of the authors and do not necessarily represent the official position of CEPS.
ISBN 978-94-6138-546-8
Available for free downloading from the CEPS website (www.ceps.eu) © CEPS 2016
Ultra-low or Negative Yields on
Euro-Area Long-term Bonds:
Causes and Implications for Monetary Policy
Daniel Gros
No. 426 / September 2016
Abstract
The importance of monetary policy for the current ultra-low interest rates is often over-estimated. As emphasised by ECB President Draghi himself, monetary policy cannot determine long-term rates directly, and its influence on long-term real rates is even more limited and indirect.
Moreover, long-term bond yields have fallen to unprecedented low levels throughout developed countries. The influence of any single central bank on bond yields in its currency area must be quite limited if global capital markets are integrated.
The importance of the ECB’s policy in driving down rates in the euro area is widely assumed to be substantial. But even the ECB does not attribute more than a one- percentage point decline in rates to QE. The author of this study believes that the impact of QE has been much smaller, due to the state of global markets.
C
ONTENTS
Executive Summary ... i
1. Introduction ... 1
2. ‘Secular’ drivers of bond yields ... 2
2.1 What drives real long-term rates? The framework ... 3
2.2 What drives bond yields? The evidence: a savings glut? ... 5
2.3 What drives bond yields? The evidence II: an investment strike? ... 8
3. What can the ECB achieve? Global versus local interest rates ... 10
4. Conclusions ... 12
References ... 13
Appendix ... 15
[image:2.595.76.501.119.323.2]List of Figures
Figure 1. Long-term interest rates in major currency areas since 1990 ... 3Figure 2. Savings and investment - possible equilibria ... 4
Figure 3. Global investment and savings ... 4
Figure 4. Emerging market and developing country saving rates as a % of GDP, 1980 to 20207 Figure 5. Impact of an increase in the equity risk premium ... 8
Figure 6. The equity risk premium, 2000-16, beginning of year data ... 9
Figure 7. The impact of shifting savings and investment schedules with globally integrated capital markets ...10
i
Executive Summary
Long-term rates have been subject to a strong global trend over the last decade, which is common to all developed economies.
Rates are generally lower in savings surplus countries (i.e. countries with persistent current account surpluses) such as Germany, Japan and most smaller northern European countries, than in savings deficit countries, such as the UK or the US.
But the differences have narrowed recently.
The existence of this global trend suggests that the influence of any one central bank might be limited. Real rates, i.e. nominal interest rates adjusted for inflation, are the key variable for savings and investment decisions. Their decline over the last few decades remains difficult to explain.
Latest research suggests that the decline is due to combination of factors, like lower growth plus higher savings and lower investment propensities.
But estimates of the right, or ‘equilibrium’ long-term real rate today are highly uncertain. Recent results vary from small positive (about 1%) to zero. If bond yields are driven by a global trend there is little the ECB can achieve by itself.
President Draghi has stated that, while monetary policy cannot change the long-term rate trend or equilibrium value of bond rates, it should try to lower rates below their equilibrium when there is a negative output gap and inflation persistently stays below target. The ECB thus tries to influence long-term rates by buying bonds, negative rates on its policy instruments and by providing ‘forward guidance’.
1
Ultra-low or Negative Yields on
Euro-Area Long-term Bonds:
Causes and Implications for Monetary Policy
Daniel Gros
*CEPS Working Document No. 426 / September 2016
1.
Introduction
The period since the beginning of the global financial crisis in 2008 has been an extraordinary one for central banks around the world, in the sense that policy rates have been close to zero in most advanced countries for several years. Yet the focus on the period since the crisis hides the important fact that the decline in long-term rates had been going on for a long time. This trend raises a profound issue: what is the importance of the actions of any one central bank if long-term rates throughout the developed world are driven by a common trend? Gros (2015) discusses a particular aspect of this issue by showing that long-term bond rates have tended to move together on both sides of the Atlantic and that there is little evidence that bond buying by central bank(s) has had a significant impact on this relationship.
Moreover, central banks can usually determine only most short-term rates directly via their own policy instruments, which usually involve only short-term operations. This limited influence of central banks in the long term, especially long-term real rates, is universally accepted. President Draghi has thus laid out the position of the ECB:
While structural factors drive long-term real rates, monetary policy influences interest rates over the short term. But it does so only at the margin: central banks steer market rates relative to the level dictated by those structural forces. This alters the relative attractiveness of saving versus spending, and in doing so helps keep output around potential and ensures price stability.
Today, faced with a persistent output gap and too-low inflation, our monetary policy is stimulating the economy by steering market rates below their long-term levels. And since those long-term rates have fallen very low, it is inevitable that market rates have fallen to very low and even negative levels for an extended period of time to achieve the right level of demand support.
This has been the case not just for the euro area, but also for Japan, where central bank policy rates have been near zero since the mid-90s; for the US, where they have stayed near zero since 2008 and have been raised only once since, at the end of last year; and for the UK, where policy rates have been just above zero for 7 years now.
If central banks did not do this – i.e. if we kept interest rates too high relative to their real levels – investing would be unattractive, because the cost of borrowing would exceed the return. So the economy would stay stuck in recession. Conversely, by
2 DANIEL GROS
holding market rates below the real rate of return, we encourage the investment and consumption that is needed to bring the economy back to potential. That in turn creates the conditions for monetary policy to eventually normalise.
This view is at first sight coherent in that it provides an explanation for why the policy stance of the ECB is both important and of limited importance in explaining the persistence of ultra-low rates.
This contribution will focus on one aspect, namely the global trend in bond yields and what this common global trend implies for the effectiveness of monetary policy in any one country. The next section briefly illustrates the common trend in global long-term bond yields.
It then discusses the longer-term, or ‘secular’ drivers of bond yields at the global level, looking separately at drivers on the savings and investment side. The next section then discusses the implications of this view of globally integrated markets for the effectiveness of the ECB’s policy. Section 4 concludes.
2.
‘Secular’ drivers of bond yields
The widely accepted view that the period since the beginning of the global financial crisis in 2008 has been an extraordinary one for financial markets and central banks is potentially misleading because the focus on the post-crisis period obscures the fact that rates had been declining for decades before the crisis.
ULTRA-LOW OR NEGATIVE YIELDS ON EURO-AREA LONG-TERM BONDS | 3
Figure 1. Long-term interest rates in major currency areas since 1990
Source: OECD, 2016.
2.1
What drives real long-term rates? The framework
In order to find an explanation for the observed trend decline in global real interest rates, both theoretical and empirical literature has recently aimed to identify the secular drivers in a framework that takes the interest rate as the price that leads to equilibrium between the demand for investment and the supply of savings. This approach assumes that national capital markets are linked by one global market that leads to one global interest rate; it is an approach that focuses on global variables, for example the investment or savings to GDP ratios for the entire world and some weighted average of national interest rates.
The usual approach is simple: one assumes that there is a schedule that represents the supply of savings and the demand problem for investment, as depicted in Figure 2, below. The demand for investment is assumed to decline if interest rates go up, and vice-versa for savings. The key point is that these supply and demand schedules can shift if other factors shift. For example, it is widely assumed that ageing might at first increase the amount of desired savings at any given interest rate. Ageing might thus lead, under certain conditions, to a shift of the supply curve of savings to the right, as depicted in the figure below. Investment demand is also widely assumed to be affected by growth prospects. This implies that a fall in trend or expected growth rates would lead to lower investment demand at any given interest rate, i.e. the demand curve for investment would shift to the left, as shown in Figure 2, below. The implication is that an ageing world that grows more slowly as population growth slows might lead to much lower interest rates.
-2 0 2 4 6 8 10 12 14 1 9 9 0 1 9 9 0 1 9 9 1 1 9 9 2 1 9 9 3 1 9 9 4 1 9 9 5 1 9 9 6 1 9 9 7 1 9 9 8 1 9 9 9 2 0 0 0 2 0 0 1 2 0 0 1 2 0 0 2 2 0 0 3 2 0 0 4 2 0 0 5 2 0 0 6 2 0 0 7 2 0 0 8 2 0 0 9 2 0 1 0 2 0 1 1 2 0 1 2 2 0 1 2 2 0 1 3 2 0 1 4 2 0 1 5 2 0 1 6
4 DANIEL GROS
Figure 2. Savings and investment - possible equilibria
Source: Ludolph and Barslund (2016).
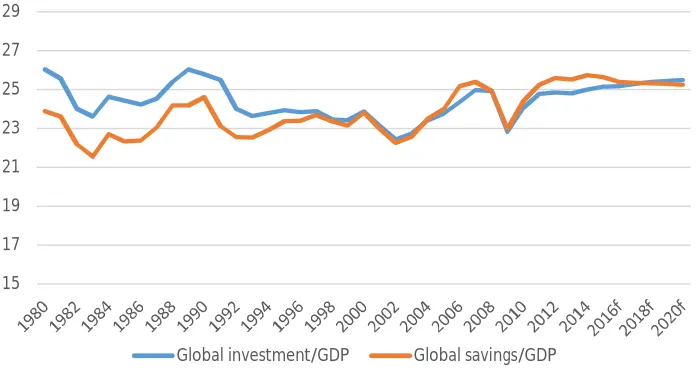
One should note that a shift in any one schedule alone would lead to lower rates and a change in the equilibrium savings and investment rates. But another stylised fact is that at the global level savings and investment rates have been rather stable over the same period as the observed decline in interest rates, as shown in Figure 3, below.
Figure 3. Global investment and savings
Source: IMF WEO 2016.
The natural conclusion is that only a contemporaneous shift in both supply and demand can have produced the combination of much lower rates and stable investment and savings rates. The slope of the investment and savings curves is very difficult to pin down empirically. Bean et al. (2015) emphasise that even extreme cases, i.e. a complete insensitivity of either desired
0 1 2 3 4 5 6 7
R
ea
l i
n
te
re
st
in
%
Investment/Savings (volume)
Investment Savings
15 17 19 21 23 25 27 29
[image:8.595.121.470.469.656.2]ULTRA-LOW OR NEGATIVE YIELDS ON EURO-AREA LONG-TERM BONDS | 5
investment or desired savings, cannot be ruled out.1
But most of the literature assumes that this is not the case. Central banks are especially loath to accept this hypothesis as it would mean that their models of how interest rates are transmitted to the economy do not reflect reality.
The sensitivity of both savings and investment to changes in the interest rate has been analysed in a number of empirical studies. DeFina (1984) summarises all estimates that had been put forward by researchers by the time and finds that the percentage change in savings associated with a one percentage point increase in real interest rates varies widely between 0% and 5.8%. Recent calculations by the IMF (2014a) estimate the (semi-)elasticity of investment to the real interest rate to be about −0.5, and a (semi-)elasticity of saving to the real rate of about 0.15. The strength of any reaction of savings or investment to interest rates can of course vary from country to country, but any analysis of the global capital market must assume that there is a meaningful global average. The values of the (semi-)elasticities mentioned above imply that even small shifts in the curves can lead to significant changes in interest rates. For example, if the (global) savings schedule were to shift by only 1%, it would take a fall in interest rates of 6% to re-establish savings at the previous level. Conversely, this also implies that central banks would have to engineer huge falls in interest rates if the target were to lower savings. For investment the assumed sensitivity to interest rates is about three-times higher. But even here major change would be required if policy were to target an increase in investment. For example, it would take a fall of four percentage points in the relevant interest rate to increase investment by 2%. Given that investment represents only about 20% of GDP (in the euro area), this implies that the 2% increase in investment stimulated by a fall in interest rates of four percentage points would represent an increase in demand of only 0.4% of GDP.
The uncertainty about the investment and savings schedules makes it difficult to explain why the observed phenomena are still high. Recent contributions have nevertheless analysed secular trends that coincide with the decline in real interest by using the averages of the estimates of the slopes mentioned above.
The following section thus briefly reviews recent analyses of secular drivers that may have shifted desired savings and investment. The period since the beginning of the global financial crisis in 2008 has been an extraordinary one for central banks around the world.
2.2
What drives bond yields? The evidence: a savings glut?
As shown above, both the savings and investment schedules must have changed to produce lower rates with constant savings (and investment) ratios. We start with factors that might have moved the savings schedule.
Age-saving profiles
Analyses of the effect of ageing on the real interest rate often assume a hump shape of savings, which is predicted by the lifecycle model developed in the seminal contribution by Brumberg and Modigliani in 1954. The theory convincingly argues that saving takes place when people are in their high-earning years, typically starting in their late 30s, until they reach retirement. While the theoretical basis has been further established in extensions to the initial model, the fundamental empirical problem is that reliable country-level age-saving profiles cannot be studied using cross-sections. In order to disentangle cohort and time effects from the
6 DANIEL GROS
related propensity to save, panel data with sufficient waves and all relevant financial, and socio-economic variables, is required.
Börsch-Supan (2003) conducts the most comprehensive study on the issue by constructing synthetic panels from cross-sectional data. The author analyses six advanced countries - the US, the UK, Germany, the Netherlands, Italy and Japan – and their results indeed show the abovementioned hump shape for most countries. However, the analyses find differences in the exact shape of the age-savings profiles across countries that cannot be easily accounted for. Once again, available data does not allow us to disentangle the drivers of national propensities to save. Parts of the cross-country variation can be attributed to the generosity of domestic welfare systems and down-payment ratios; but many other variables are not captured by standard survey data and therefore enter the residual, likely leading to unobserved heterogeneity.2 Further problems arise from the level of aggregation in typical survey data. While some household characteristics can be controlled for, defining age as the age of the head of a particular household raises further issues because the head might change over the course of a panel.
It is for all the above reasons that the intuitive negative causal relationship from relative number of middle-aged citizens to the real interest rate is subject to uncertainty. The timing of the two appears to be too perfect for us not to ascribe at least parts of the decline in real interest rates to the increased number in the age cohort with the highest propensity to save. Yet despite the fact that this cohort will gradually enter into retirement over the next two decades, a complete reversion of the trend does not follow from the most sophisticated empirical analyses.
Within-country income inequality
While inequality between countries has fallen, within-country inequality has risen over the past few decades.3
This observation has most notably been signalled by Piketty (2014). He illustrates the rising share of income held by the top decile of the population for a number of advanced and emerging economies.
The rising marginal propensity to save with an increase in income has been stressed by several country-level US studies, starting with Dynan et al. (2004) who present evidence that the rich do indeed save more than the less well-off. These findings are supported by later US studies (Saez and Zucman, 2014). We hesitate to establish a link between rising within-country inequality and the decline in real interest rates, however, for two main reasons:
First, while within-country inequality has indeed risen in many OECD countries, detailed studies on the effect of rising inequality on savings are only available for the US. Second, as Bean et al. (2015) point out, the argument does not pass the timing test as the rise in within-country inequality began more than two decades before global real interest rates started declining.
2 Standard panel data techniques cannot be applied to synthetic panels in the same way to eliminate
confounding factors. In addition, even if longitudinal data were available, eliminating important factors obviously also limits our understanding of the underlying processes.
3 Note that we do not consider catch-up growth in this review as the mapping to real interest is highly
ULTRA-LOW OR NEGATIVE YIELDS ON EURO-AREA LONG-TERM BONDS | 7
Regardless of the causal effect of within-country inequality on global real interest rates, there appears to be no evidence of a trend reversal in the short to medium term.
Emerging markets savings and Chinese financial market integration
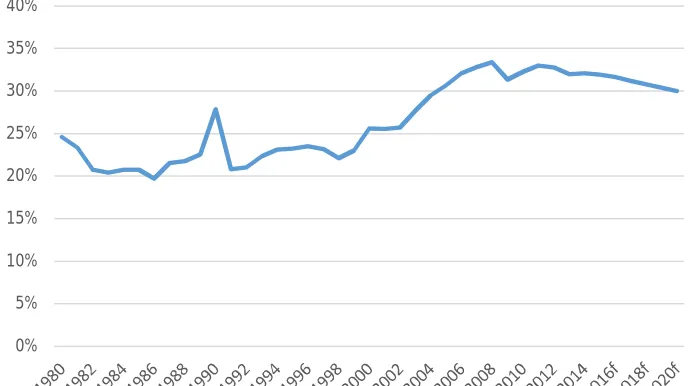
[image:11.595.121.465.217.410.2]After 2000, emerging markets savings relative to GDP increased significantly. Figure 4 shows developments from 1980 to forecast values of 2020.
Figure 4. Emerging market and developing country saving rates as a % of GDP, 1980 to 2020
Source: IMF WEO, 2016.
The IMF (2014) notes that global saving rates went up by 1.7 percentage points in emerging economies between 2000 and 2007, of which 1.5 percentage points were due to higher emerging market savings, 0.8 percentage points were due to the higher share of emerging markets in global GDP and a 0.6 percentage point decline is explained by lower relative saving rates in advanced economies.
While foreign exchange accumulation in the aftermath of the 1997-98 crisis in the whole of Asia has certainly contributed to higher demand for safe advanced-economy assets, Bean et al. (2015) stress that China, in particular, has been a drag on global interest rates. The combination of a rise in savings and large current account surpluses caused by China’s export-led growth model export-led to an extensive outflow of funds. These went mainly into advanced economies where they dragged down real interest rates, enabled by Chinese financial market integration. Underlying drivers for high net saving rates are manifold and deeply rooted in all three sectors (Tao Yang, 2012). Ma and Yi (2010) identify corporate restructuring, the Lewis model of transformation and rapid ageing as the main driving forces. Ma and Tao Yang (2013) argue that in the medium term, these forces will plateau and slightly reverse. This is confirmed by IMF forecasts that predict a decline in both Chinese gross national savings and a more moderate current account. In the same vein, Chinese foreign exchange reserves dropped sharply between the end of 2014 and 2016; however, latest numbers show that this trend is already halting (IMF, 2016a).
All in all, China and other emerging markets are unlikely to put further downward pressure on global real interest rates; but a complete reversal of current forces cannot be expected.
8 DANIEL GROS
2.3
What drives bond yields? The evidence II: an investment strike?
We now turn to factors that might have reduced investment (Ludolph and Barslund, 2016).
The price of risk may have risen
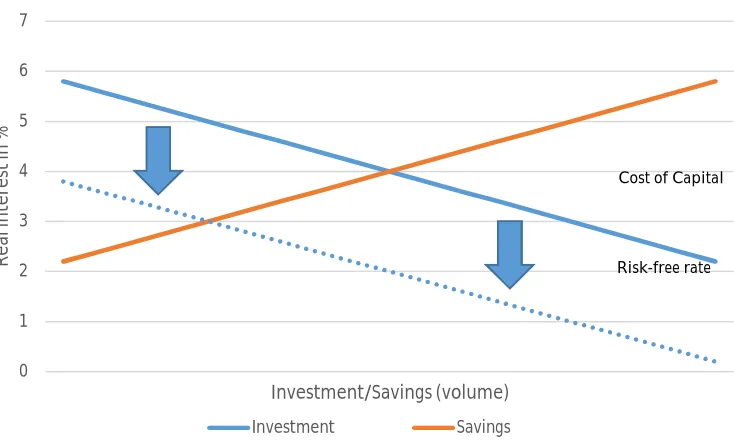
The focus here is on explaining the decline in the yield on government bonds yields, which typically represent the free interest rate. Investment decisions do not depend on the free rate, however, but on the cost of capital, which in turn can be decomposed into? a risk-free rate plus a risk premium. If the risk premium increases one would expect that desired investment falls, even if the riskless rate does not change. An increase in the risk premium can thus be thought of as a shift downwards of the investment schedule, which would lead (at an unchanged savings schedule) to a lower risk-free rate. An increase in the risk premium (on the financing of investment) is thus equivalent to a shift of the investment schedule to the right. A similar decomposition can be seen if one looks at how investment decisions are taken at the level of the enterprise. The key decision variable for investment decisions is usually the expected rate of return from a project relative to the weighted average cost of capital (WACC), the weighted average of a company’s debt servicing costs and its cost of equity. When the equity risk premium goes up, the WACC increases vis-à-vis the risk-free rate, making corporate investment less attractive.4
[image:12.595.88.455.387.608.2]
Figure 5. Impact of an increase in the equity risk premium
Source: Ludolph and Barslund (2016).
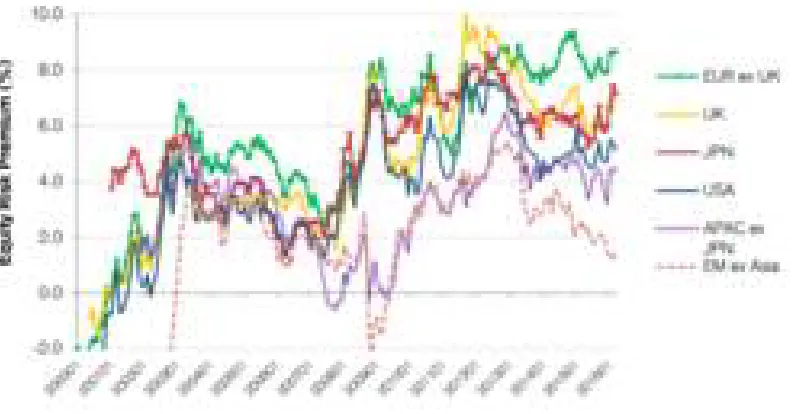
The risk premium seems indeed to have been rather volatile over the last decade or so. Figure 6 below shows estimates of the aggregate equity risk premium for most advanced and emerging economies between 2000 and 2016.
4 Note that it is the rise in the equity premium, not its existence as such that triggers the result.
0 1 2 3 4 5 6 7
R
ea
l i
n
te
re
st
in
%
Investment/Savings (volume)
Investment Savings
Cost of Capital
ULTRA-LOW OR NEGATIVE YIELDS ON EURO-AREA LONG-TERM BONDS | 9
Figure 6. The equity risk premium, 2000-16, beginning of year data
Source: Credit Suisse (2016).
Overall, the equity risk premium has increased globally, with the exception of emerging market economies where it fluctuated around a constant level over the time period under consideration.
It needs to be emphasised that the risk premium can only be roughly estimated, usually from dividend yields and stock market prices. However, many different estimates of the risk premium yield similar results in that there appears to have been a clear increase in the risk premium. The reasons for this increase in the risk premium are not quite clear. A shift in preferences towards safe assets among investors is one that is often cited.
The increase in risk aversion among investors is mostly observed across asset classes, however, not within them. Emerging market sovereign bonds premia have not risen over the past two decades, while the spread between corporate and sovereign bonds has remained more or less constant (Bean et al., 2015; Rachel and Smith, 2015).
Relative price of capital goods
Cheaper capital may have two effects on investment: first, it may trigger more investment as lower returns are needed. Second, a given amount of investment can be maintained by dedicating a smaller share of overall production to capital-intensive projects. As illustrated convincingly by Rachel and Smith (2015), the 30% decline in the relative price of capital goods since the 1980s had an overall negative effect on investment as the elasticity of substitution between labour and capital is not sufficiently high (see also Thwaites, 2015).
Reduced profitability of investment
10 DANIEL GROS
The decline of public investment in advanced economies
Public investment in advanced economies has been on a declining path since the 1980s, putting downward pressure on real interest rates (IMF, 2014b). Latest IMF (2016b) analyses do not predict a reversal of this trend in the near future.
3.
What can the ECB achieve? Global versus local interest rates
As mentioned above, the literature on the determinants of global interest rates assumes that all relevant national capital markets are linked via the global capital market so that in the end the interest rate is the same everywhere. If one accepts this hypothesis national central banks could not influence bond yields in their own jurisdiction because any slight change in a national (or currency area) interest rate would attract such large capital flows that any incipient interest rate differential would disappear very quickly.
[image:14.595.79.482.371.594.2]With a globally integrated capital market, any shifts in local investment and savings schedules would have no effect on interest rates and result only in shifts in the variable whose schedule has shifted.
Figure 7. The impact of shifting savings and investment schedules with globally integrated capital markets
Source: Ludolph and Barslund (2016).
Figure 7 shows how the equilibrium would change, assuming the same shifts in the savings and investment schedules used so far. If these shifts occur in only one country, which is not large enough to affect the global equilibrium, the impact would be totally different from the one hypothesised before: the interest rate would not change, but investment would fall and savings would increase. This implies that the country in question would develop a current account surplus.
This insight that savings and investment should be able to evolve independently if global capital markets were fully integrated was first developed and tested empirically by Feldstein and Horioka (1980).
0 1 2 3 4 5 6 7
R
e
al
in
te
re
st
in
%
Investment/Savings (volume)
ULTRA-LOW OR NEGATIVE YIELDS ON EURO-AREA LONG-TERM BONDS | 11
Figure 8. Investment and savings in the euro area
Source: Own calculations on IMF (WEO) data.
Figure 8 shows the data for the eurozone since 1991. These data do not suggest any relationship between savings and investment. This would tend to support the hypothesis of globally integrated capital markets. The changes since the crisis confirm this impression: since 2008 investment has fallen severely in the euro area, whereas savings have tended to remain roughly constant.
As mentioned above, it becomes difficult to see a major role for the ECB in affecting (long-term, real) bond yields if the euro area capital market is integrated into the global capital market. Under the hypothesis of full integration action by the ECB would be totally ineffective to change rates in the euro area. One can of course imagine channels through which the ECB would still have some influence on euro area bond yields. For example, capital market integration might not be 100%, for example, because of currency risk, implying that a difference between domestic savings and investment is not always fully offset by capital flows, permitting a small difference between euro area and global interest rates. Moreover, one could argue that the global ‘equilibrium’ rate represents some long-term value that might be the same for all countries (with open capital markets), but in the short term local interest rates could remain slightly different from this global long-term equilibrium value.
Even if one accepts these arguments, however, it remains clear that action by the ECB can at most have a temporary and probably marginal impact on bond yields in the euro area. This is also the impression one gains from the data on (nominal) bonds yields presented above, which showed that the transatlantic interest rate differential has rarely been larger than one percentage point. 1991 1992 1993 1994 1995 1996 1997 1998 1999 2000 2001 2002 2003 2004 2005 2006 2007 2008 2009 2010 2011 2012 2013 2014 2015 2016
y = 0.108x + 20.33 R² = 0.057
20.5 21.0 21.5 22.0 22.5 23.0 23.5 24.0 24.5
19.0 20.0 21.0 22.0 23.0 24.0 25.0 26.0 27.0
Sa vi n g as p e rc en t o f G D P
12 DANIEL GROS
4.
Conclusions
This paper has focused on the secular drivers of long-term interest rates. Recent empirical literature has found that it might be possible to reconcile two observations: first, that interest rates have declined throughout the developed world, following a common trend, and second, that the global investment and savings ratios have remained roughly constant.
It seems possible to explain these two developments through the impact of ageing, lower growth and an increase in the risk premium on global capital markets. Since these secular drivers of lower rates are unlikely to change quickly, one must conclude that low rates are likely to remain for some time.
One conclusion that is often drawn from this perspective of ‘low for long’ is that inflation targets should increase because the world capital market might need negative real rates to remain in equilibrium. Since bond yields cannot go much into negative territory, under certain circumstances this might require an inflation rate higher than 2%. Given the uncertainty surrounding the level of equilibrium rates today (as opposed to the decline, which seems indisputable) the need for higher inflation targets seems debatable. But this issue was not discussed here.
This paper has instead emphasised another implication for monetary policy, which is often overlooked: if global drivers are behind low bond yields everywhere, the ECB might not be able to influence them in the euro area.
In other words, with integrated global capital markets national monetary policy can no longer be expected to have an impact on bond yields at home. The evidence seems to support this view. Activism by the ECB, for example, extending the bond purchase programme, might thus be largely ineffective.
ULTRA-LOW OR NEGATIVE YIELDS ON EURO-AREA LONG-TERM BONDS | 13
References
Allianz Global Investors (2016), "QE Monitor April 2016 - Focusing on policy implementation (for now) (www.allianzglobalinvestors.de/MDBWS/doc/QE+Monitor_May+2015_ e.pdf?4bc8334c2b03239835b06160629ef69e41f64da6).
Bean, C., C. Broda, T. Ito and R. Kroszner (2015), “Low for long? Causes and consequences of persistently low interest rates”, Geneva Reports on the World Economy, CEPR Press. Börsch-Supan, A. (2003), Life-Cycle Savings and Public Policy: A Cross-National Study of Six
Countries, San Diego: Academic Press.
Breedon, F., J.S. Chadha and A. Waters (2012), “The financial market impact of UK quantitative easing”, BIS Papers No. 65, Bank for International Settlements, Basel.
Brumberg, R. and F. Modigliani (1954), “Utility Analysis and the Consumption Function: An Interpretation of Cross-Section Data” in K. Kurihara (ed.), Post Keynesian Economics, New Brunswick: Rutgers University Press.
Credit Suisse (2016), “HOLT Macro Insights – March 2016”, Credit Suisse Market Commentary.
DeFina, R.H. (1984), “The link between savings and interest rates: a key element in the tax policy debate”, Business Review, Federal Reserve Bank of Philadelphia.
Draghi, M. (2016), “Addressing the causes of low interest rates”, speech held at the panel on “The future of financial markets: A changing view of Asia” at the Annual Meeting of the
Asian Development Bank, Frankfurt am Main, 2 May
(https://www.ecb.europa.eu/press/key/date/2016/html/sp160502.en.html).
Dynan, K.E., J. Skinner and S.P. Zeldes (2004), “Do the Rich save more?”, Journal of Political Economy, Vol. 112, No. 2.
Feldstein, M. and Ch. Horioka (1980), “Domestic Saving and International Capital Flows”, Economic Journal, 90(358): 314–329.
Gros, D. (2016), “Effectiveness of the ECB programme of asset purchases: Where do we stand?”, Monetary Dialogue, 21 June 2016 (www.europarl.europa.eu/
committees/en/econ/monetary-dialogue.html).
Gros, D. (2016), “QE infinity: What risks for the ECB?”, In-depth analysis,
IP/A/ECON/2016-01, February (www.europarl.europa.eu/committees/en/econ/
monetary-dialogue.html).
International Monetary Fund (2014a), “Perspectives on Global Real Interest Rates, Chapter 3 in IMF World Economic Outlook April, Washington, D.C. (http://www.imf.org/external/Pubs/ft/weo/2014/01/pdf/text.pdf).
International Monetary Fund (2014b), “Is it time for an infrastructure push? The macroeconomic effects of public investment”, Chapter 3 in IMF World Economic Outlook October, Washington, DC.
International Monetary Fund (2016a), “Time Series Data on International Reserves and
Foreign Currency Liquidity”, Washington, DC.
14 DANIEL GROS
International Monetary Fund (2016b), “Fiscal Monitor: Acting Now, Acting Together”, Washington, D.C., April.
International Monetary Fund (2016c), “Article IV consultation on Belgium”, IMF Country Report No. 16/77, Washington, DC.
Ludolph, L. and M. Barslund (2016), “Could the decrease in Belgian government debt servicing costs offset increased age-related expenditure?”, Forthcoming working paper within the framework of the BelAge project.
Ma, G. and D. Tao Yang (2013), “China’s High Saving Puzzle”, IZA Discussion Paper No. 7223. Ma, G. and W. Yi (2010), “China’s high saving rate: myth and reality”, BIS Working Paper No.
312.
Organisation for Economic Co-operation and Development (2015), “OECD Economic Outlook”, Volume 2015 Issue 1.
Piketty, T. (2014), Capital in the 21st Century, Harvard: Harvard University Press.
Rachel, L. and T. Smith (2015), “Secular drivers of the global real interest rate”, Bank of England Staff Working Paper No. 571.
Saez, E. and G. Zucman (2014), “Wealth inequality in the United States since 1913: evidence from capitalized income tax data”, NBER Working Paper No. 20625.
Tao Yang, D. (2012), “Aggregate Savings and External Imbalances in China”, IZA Discussion Paper No. 6964.
ULTRA-LOW OR NEGATIVE YIELDS ON EURO-AREA LONG-TERM BONDS | 15
Appendix
Investment insensitive to changes in the real interest rate
Source: Ludolph and Barslund, 2016.
Savings insensitive to changes in the real interest rate
Source: Ludolph and Barslund, 2016. 0
1 2 3 4 5 6 7
R
ea
l i
n
te
re
st
(
in
%)
Investment and savings (volume)
Savings and investment (insensitive to real interest)
Investment Savings
0 1 2 3 4 5 6 7
R
ea
l i
n
te
re
st
(
in
%)
Investment and savings (volume)