Rochester Institute of Technology
RIT Scholar Works
Theses
Thesis/Dissertation Collections
1997
A Study of package drops in global distribution
environment
Donald Appleton
Follow this and additional works at:
http://scholarworks.rit.edu/theses
This Thesis is brought to you for free and open access by the Thesis/Dissertation Collections at RIT Scholar Works. It has been accepted for inclusion in Theses by an authorized administrator of RIT Scholar Works. For more information, please [email protected].
Recommended Citation
A STUDY OF PACKAGE DROPS IN A GLOBAL DISTRIBUTIONENVIRONMENT
By
Donald J. Appleton
A Thesis
Submittedto the
Departmentof
Packaging
Science CollegeofApplied ScienceandTechnology
inpartialfulfillmentoftherequirements
forthedegreeof
MASTEROF SCIENCE
Rochester Instituteof
Technology
Department of Packaging Science
College of Applied Science and Technology
Rochester Institute of Technology
Rochester, New York
CERTIFICATE OF APPROVAL
M. S. DEGREE THESIS
The M.S. degree thesis of Donald J. Appleton
has been examined and approved
by the thesis committee as satisfactory
for the thesis requirements for the
Master of Science Degree
Thomas
L. Howath
Stephen
B.
Buice
John M. Fin
COpy RELEASE
A STUDY OF PACKAGE DROPS IN A GLOBAL DISTRIBUTION ENVIRONMENT
I, Donald J. Appleton, hereby grant permission to the Wallace Memorial Library of RIT to
reproduce this thesis in whole or in part. Any reproduction will not be for commercial use
or profit.
ACKNOWLEDGMENTS
Firstand
foremost,
IwouldliketothankThomas L. Horvath andStephen R. PierceMS.,
from Eastman Kodak
Company
fortheirencouragement andsupport of methroughout thisstudy, aswellastheentire graduate program.
Steve,
throughhiscontinuedlong-termpassion for
Packaging
Science,
servedtosparkmy interest inenrollmentandcompletion of theprogram. Tom hasgiven meunwavering support and workedvery hard behindthescenestoenablethisopportunitytohappen.
IwouldalsoliketothankSteve foruse ofhis data recording devicesand wealth of
knowledgeand globalcontacts, without whichthisstudy would nothave beenpossible.
IwanttoexpressmygratitudetoJohn
Siy
for hisparticipation onmycommittee andhissupport and encouragement overtheyears.
Iwouldliketo thankMark E. BrooksfromthePEGDtest
laboratory
for hisworkontestfixture
fabrication,
test shipmentexecution, andeventsorting.IwanttoexpressmyappreciationtoMerilee
Ritter,
MS. from Eastman KodakCompany
for herstatisticalanalysis ofthedatacollected.Ialsowantto thankMelissaMannionfor
helping
me navigatethroughMicrosoft WordVersion6.
Iwouldliketo thankDr. Harold J.
(Pete)
Raphaelfor hisworkin establishingthePackaging
Scienceprogram atRIT. Inaddition, Iwouldliketo thankhim forconvincingme, in
1980,
topursue a carrierinPackaging
Science.Finally,
last but certainlynotleast,
Iwouldliketo thankmyparentsRalph E. andJean S.DEDICATION
Thisthesis isdedicated tomy family:
Kathy,
Teddy,
andKelly
Appleton,
whohave hadtoputupwith numerous sacrificeswhileIhavepursuedthis goal. Withouttheir
love,
support,understanding,andcompromises, Iwouldnothave been abletosucceed.
A STUDY OF PACKAGE DROPS IN A GLOBAL DISTRIBUTIONENVIRONMENT
By
DonaldJ. Appleton
ABSTRACT
Thefocusofthis studywasto compileandinterpret
drop
heights anddrop
frequenciesdata forsmallparcel packagesmovingthrough theEastman Kodak
Company
global distributionnetwork. Theneedforthisstudy arosefromtheinclusionof
drop
height probabilitycurvesinto Kodak's shippingtestsforpackaged productweighing less than 100 lb. Kodak packagingengineers suspectedthedrop
heights included intheprobability curvesweretoohigh in
drop
heightandtoomany infrequency
when compared totheactualdistributionenvironment. The data forthis studyresultedfrom dozensoftestshipmentsusing
dummy
-loadpackagesthroughoutthe Kodakglobaldistributionnetwork.Thetestshipments were conductedintheUnited
States, Europe,
andAustralia. Thetestpackages were equipped with adrop-height recording devicecalled aSAVERtorecord whena
drop
occurredandfromwhatheightthepackagewasdropped. Data fromtherecorder was
downloaded,
"real"
events were sorted outfromeventsthatwere nottrue
drops. Once sortingwascompleted, the
"real"
datawas analyzedutilizingvarious
statisticaltechniques. Theresults oftheanalysisledto thedevelopmentofdata-derived statisticaltestplansbasedontheactualfield-measured data. Theresultsofthis experiment, whencomparedto theprobabilitycurvecurrently inuse,showthat the
drop
heightsoutlinedintheprobabilitycurvearetoohighandtoomany are calledfor. Thisexperiment will serveasthebasis fornewshippingtestsbasedon actualfieldmeasurements. The field data indicatesthat thecurrenttestmay have ledtoovertestingandoverpackagingof our
products. Thesefindings
identify
anopportunity forwaste reductionas well as anoverall reductioninexpenditureforpackaging.CONTENTS
CERTIFICATE OF APPROVAL II
COPY RELEASE Ill
ACKNOWLEDGMENTS IV
DEDICATION VI
ABSTRACT VII
CONTENTS VIII
1.0 INTRODUCTION 1
BUSINESS CLIMATE 1
SHIPPING TEST PROCEDURE OPTIONS 2
REASON FORSTUDY 5
probabilitycurves 5
STUDY ASSUMPTIONS: 6
STUDY OBJECTIVES: 7
2.0 LITERATURE REVIEW 8
DEFINITIONOF DISTRIBUTION ENVIRONMENT 8
SIGNIFICANCEOF DROP HEIGHT 8
LINKAGETO REAL WORLD EVENTS 9
3.0 TEST MATERIALS AND METHODS 11
MATERIALS 11
MeasuringDevice 11
Test Packages 12
METHODS 13
Data Collection 73
Figure1 ]4
Routes Measured 15
4.0 RESULTS AND DISCUSSION 17
EUROPEAN DROP HEIGHT DATASUMMARY, HISTOGRAM,STATISTICS 18
EUROPEAN DROPS PER TRIP DATASUMMARY,HISTOGRAM AND STATISTICS 20
AUSTRALIAN DROP HEIGHT DATASUMMARY, HISTOGRAM,STATISTICS 22
AUSTRALIAN DROPS PER TRIP DATASUMMARY, HISTOGRAM, AND STATISTICS 24
LESS THAN TRUCK LOAD(LTL)DROP HEIGHT DATASUMMARY, HISTOGRAM,STATISTICS26
LESS THAN TRUCKLOAD(LTL)DROPS PER TRIP DATASUMMARY, HISTOGRAM,AND
STATISTICS 28
DOMESTIC PARCEL DROP HEIGHT DATASUMMARY, HISTOGRAM,STATISTICS 30
DOMESTIC PARCEL DROPS PER TRIP DATASUMMARY, HISTOGRAM,AND STATISTICS..32
ALL DROP HEIGHT DATASUMMARY, HISTOGRAM,STATISTICS 34
ALL DROPS PER TRIP DATASUMMARY, HISTOGRAM, STATISTICS 36
TEST PLANS 38
Test Plan 1 38
Test Plan 2 40
5.0 CONCLUSIONS AND RECOMMENDATIONS 4 2
RECOMMENDATIONSFOR FUTURE AREAS OF STUDY 43
6.0 REFERENCES 4 4
1.0 INTRODUCTION
BUSINESS CLIMATE
Inthebusinessenvironment ofthe
90s,
pressures oncost controlandcontinuousimprovementare greaterthanever. Thesetwoareashave been identifiedasfertileground
toimprove corporate earnings. Companiesmustdomore with
less,
and whatwas"WorldClass"
yesterday is
barely
acceptabletoday.Theareaof packageengineering has not escapedtheinfluxofthesenew pressures.
Theoptimum packageisnolongerthe
lofty
goal of acorporation. It isnowthedemandofeverynew program. Thepackagehastodo all ofthe traditionalfunctionswhich packages
havealwaysperformed
(contain,
protect,identify,
sell), butnowitmust executethesefunctionsatlowerunit costsandwith moreenvironmentally-friendlymaterialthanever
before.
Packagedevelopmentcosts are also under scrutiny. Packagedevelopmentcycle
timesmustbereducedtoimprove projectdevelopmentcosts.
Moreover,
packagedevelopmentcycleshave becomecompressedtomatch much shorter productdevelopment
cycletimes. The packagingengineernolongerenjoysthe
luxury
ofgoingthroughnumerousdesign iterationsonthewaytoan effectivepackaging solution.
Althoughnotasprevalentasintheearly
90s,
thepackagingprofessionalis stillfacedwith
building
environmentalresponsibility intopackagingsolutions. The grayareabetweenenvironmentalrealityandperceptionrages on. There
is, however,
little debatethatsourcereduction/wasteavoidance
is,
bothin realityandperception,an effectiveenvironmentaldesignapproach. Representative (notexcessive) shippingtestsallowthe
packagingengineertodesignapackageusingtheminimumamount of materials.
Reducing
thepercentageofproductdelivered damaged has alsobeenidentifiedasan areatoimprovecosts. Acontinuousbalancemustbeconsideredbetween using less
packaging (higherriskof
damage)
andreducing damagerates(higheruse/cost ofpackaging). The idealpackagesolution employs all oftheinherentruggednessofthe
product,plusjustenoughpackagingprotectiontoequaltheforces andhazardsofthe
distributionenvironment.
Thereare obvious,and-not-so obvious,costs of
delivering
damagedgoods toacustomer. Fromthepointdamage is
incurred,
all timeandmoneyspent ondesign,
development,
manufacturinganddistributionexpendituresforthedamagedproductarelost. Additionalcostsarerequiredfor distribution (forreturn shipment)andreplacement
and/orrepairofthedamagedproduct. Somenot so obvious costs are customer
dissatisfaction,
channelpartnerdissatisfaction,
lossofbrandequity, andpotentialloss of futureproductsales.SHIPPING TEST PROCEDURE OPTIONS
The packagingprofessionalhasaninfluenceon cost reduction and productdamage
rate
by
conductingthecorrect andeffectiveshippingtests onthepackage design.Typically,
packagedesignsmustsuccessfullypass ashippingtest towards theendofdevelopment,
which serves as a verificationofthepackagedesign integrity. Thereare several philosophiesonwhatdefinesa"correctandeffective"
shipping
test. Thephilosophiescanbe broken down intothreebroadcategories:
Integrity
Testing,
General Simulation andFocusedSimulation1 .
An
Integrity
Testproceduredetermineswhetheror nottheproduct pluspackageisstrongenoughtowithstandtestconditionsthatareviewedas representative of generic
distribution hazards. In an
Integrity
Test,
thepackagingengineerneedstoknow littleornothingaboutthespecific shippingenvironmentthepackage willtravel through. The
packagingengineer reliesonorganizationslike International Safe TransitAssociation
(ISTA)
todevelop
atestprocedurethateffectivelychallengestheproductplus packagesystemtoensuredamage-freereceipt oftheproduct. Thesetypesoftestsdonot represent
DennisYoung,"Strategic TransportPackagingPerformance:LinkingProductandPackageEvaluationtoCorporate
real
(measured)
occurrences derived from field data.Generally,
this typeoftesting
is veryconservative,
leading
tolowdamagerates attheexpense ofhigher packagingcosts. Thistypeoftestprocedurehas beenusedfor manyyears andis generallyused
by
companieswhichmaynothavetheresourcesfor field datameasurement. In addition,itisagoodtest
proceduretouseif knowledge islimitedasto theparticularsofhowa company's product
gets toitscustomers.
A General Simulation Testprocedureis derived fromactualfield
data,
whichissorted andblendedtorepresenttheworst combination of conditions. Thefield
data,
however,
isnotnecessarily from"your"
distributionenvironment. Avibration spectrum
fromenvironment
'A'
and shockinput fromenvironment 'B'
areblendedtogethertocreate
atestprocedure,whichtends tobeontheconservativeside. ASTM D-4169isan example
of aGeneral Simulation Test. Thistestis divided intothreeassurancelevelsto givesome
flexibility
to testintensity. Althoughnot as conservative asIntegrity
Testing,
ifthecorrectassurancelevel isnotused,General Simulation may leadtohigherthanneededpackaging
costs.
Any
given company's environmentmayneverbe as severe asthe"worstofthe worst."Thesetypesoftestsare used
by
companies whichknow howtheirproducts areshipped,but maynothavethe timeandresources requiredtoconduct afieldmeasurement study.
A Focused Simulation Testprocedure is derived fromoneparticular company's
actualfield data. On-boardshockrecorders,liketheSAVERfrom Lansmont
Corporation,
makeitpossibleforcompaniestomeasuretheirown specific shippingenvironment(s).
Measuring
devices liketheSAVER,
weighing inat2.2 lb. and whosedimensionsare
5" x
3"
x
2",
are capable ofrecording "onboard"measurements ofthenumerousforceswhich act uponapackageasitpassesthrough thedistribution environment.
Among
theattributesmeasured are shock, vibration,temperature, andtime. Oncemeasured, thedata
utilizing Focused Simulation isthat themeasuredfield datawill allowpackagingengineers
toknowthe shippingenvironmentingreatdetail. Thistechniqueyields quantitativedataon
thenature ofhazards. This"real"datawill allowforcreationofarepresentativeshipping
testfora specificenvironment,
leading
tooptimumpackage designs. The downsidetoFocused Simulationuseisthecapital andtimeexpenditure requiredtoconduct astudyof
this type.
Among
othercosts, adata measuringandrecording devicemustbeprocured,aclosed
loop
foroutbound andreturntripsmustbeestablished, andshippingchargesmustbepaid. Anothermajor costinvolves
downloading,
sorting,andinterpreting
data. Oncethatiscompleted statisticalanalysisofthedatamusttakeplace.
Clearly,
FocusedSimulationis notforeveryone.
Anexperiencedpackagingengineermaymake a reasonablejudgmentastofield
performance when evaluation of packagesdamaged fromthefieldare comparedto similar
typepackagesyieldingsimilarresultsfromthe testlaboratory. Thistypeof prediction
basedon an engineer's evaluationdoes have a certaindegreeofrisk.
However,
issignificantlymorecost effectivethenafullscalefieldstudy.
Thetruemeasure ofhowwellashippingtestperformsistocomparetestedpackage
results with "real"
field data. Damageis definedaswhenthestresses of
handling
exceedthestrength ofthepackageplusproduct.
Monitoring
theperformance of packagesinthefield is extremely importantas noshippingtestcanabsolutely,
fully
reproducefieldconditions. Anaccurate measureoffield damage mayrequire
developing
adamagereportingprocessandactivemonitoring dozens of shipments. Damageratesthatarebased
on apassive process of customer complaints andclaimsfor damage may be very lowwhen
comparedto theactualdamage
rate.2
;
Sheehan,Richard"PredictingField Performance fromLaboratoryTesting"
REASON FOR STUDY
Generally,
shippingtests are comprisedoftwomajor components.Vibration,
usedto simulateinputfromtransportationhazards
(truck,
plane,train,ship) andShock,
usedtosimulate inputfrom
handling
hazards(drops,
kicks,
otherimpacts). The focus ofthisstudy isontheshock portion
(Drop
Test)
oftheEastman KodakCompany
shippingtestforsmall parcel products shippedinavarietyofdistributionenvironments. The shock
(drop)
measurements willberecorded
by
adata recording device intheformof equivalentdrop
heights. This studywas selected as atopicbecauseoftheintroductionofthe
"Probability
Curvesfor
Handling
Shocks"3(shown
below)
intotheTS 21 1 shippingtestusedby
Kodakforpackaged product under 100pounds.
probabilitycurves
Probability
Curves CO tu _: u C CT "53 x a o _ a 600.01 %Prob ability
50
40
^
^
0.1 % Probability
% Probe
30
^
20
s
1.0%Probability
V
I
I
10%Probability
10
50 100 150
Weight
(lbs.)
200
'Richard K.
Brandeburg, Ph.D.,JulianJune-Ling Lee, Ph.D.,FundamentalsofPackagingDynamics p.106(MTS Systems).
Althoughtheintroductionofthis curvewasdonewiththebest
intentions,
nodatawaseverintroduced servingas alink between Kodak's distributionenvironment andthe
probabilitycurve.
Moreover,
skepticismincreasedasefforts directedtowards thecurves'
publisherhave failedtoyieldany hard dataused as abasisforthecurve. Thisproblemis
confounded
by
thefactthat thecurveisatleast 12years old and responsible partieshavelong
sincemoved on. Onequestionshowsuch a curvecouldbe developedwhenconsideringthe
technology
availabletomeasuredistributionenvironmentspriorto 1985.In
fact,
theauthors state,"Unfortunately,
very little is known aboutthedrop
heightsandshocklevelsencounteredin
distribution,
exceptthatevery distributionsystemhasa uniqueandcomplex
profile."4
This studywill serve asafoundation fora
truly
representativedrop
testportion ofKodak's smallparcelshippingtest. The shippingtestwillbecreatedtoreproducethe
dynamicswhich were
directly
measuredinthefield. A realitycheck ofa goodtestprocedureisthe abilitytoreproducedamageobservedinthefield
by
runningashippingtestinthelaboratory. Ifthat
"reality
check"isnotmet, then thevalidityoftheirshipping
testmustbequestioned. Oncea goodshippingtestiscreated,a connectioncanbemadeas
to the appropriatetypeandamount ofpackagingmaterials neededtoprotecttheproduct.5
STUDYASSUMPTIONS:
1)
Hypothesis: The"Probability
Curves forHandling
Shocks"usedintheKodak
Shipping
Tests arerepresentativeofourshippingenvironment.2)
Measurementoftheselectedshippingenvironments will yielddatarepresentativeofKodak'sglobaldistribution environment.
4Richard K.Brandeburg, Ph.D.,Julian
June-Ling Lee, Ph.D.,FundamentalsofPackagingDynamics (MTS Systems
Corporation, 1985),p.103.
5
Sheehan,Richard "The ConnectionwithMaterialsandComponentSpecifications",IOPP Transpack'97.
3)
Futurelabandfieldverificationtesting
and shipmentswillberequiredforabsolute verificationofthe data.
STUDY OBJECTIVES:
1)
Inthecontext ofFocusedSimulation,
drop
heights anddrop
frequenciesthatsmall parcel packages are subjectedtoin distributionenvironmentofEastman Kodak
Company
willbemeasured andrecorded.2)
Throughstatistical dataanalysis,regionaldifferences inthedistributionenvironment and/orpackageweightinfluenceon
drop
heightandfrequency
willbedetermined. A determinationwillbemadeastowhethertheseinfluencesare significant
enoughto
justify
multipletestprocedures.3)
Throughstatisticaldataanalysis,datawillbesortedtoofferassurancelevels(low,
medium,high)
which willlendflexibility
to the testprocedurein matchingprogram/product requirements.
4)
Datawillbeusedas verificationofthecurrentprobabilitycurve or as afoundation fora more representativetestprocedureutilizingmoreaccurate,
data-derived,
2.0 LITERATURE REVIEW
Theconcept ofconducting
drop
testsoncompleted packagedesign isnotnewandthereisconsiderableliteraturewrittenaboutthesubject. Aliteraturesearch reveals some
interesting
explanations regardingtherationalefor shippingtestsandcorrelationtorealworld events.
DEFINITION OF DISTRIBUTION ENVIRONMENT
It is importanttounderstandthatthe distributionnetworkis defined fromthepoint
thepackagedproductleavesthemanufacturing locationto thepointatwhichthecustomer
unpackstheproduct.
Products,
which aremovedby
hand(manually),
havethepotentialtobe droppedatanypoint withinthedistributionnetwork. Manual
handling
creates anopportunity for free fall drops fromarange ofheightsandfrequencies. Parcel
delivery
services moveandhandle very largenumbers of packagesevery
day,
thuscreatingthepotential for dropsthattransfershocksto thepackage. Theshockto thepackage,caused
by
a suddenhighrateofdeceleration,
istransferred to theproductinside thepackage.This iswhendamageto theproductmay happen.
SIGNIFICANCEOF DROP HEIGHT
Generally,
thenaturalheighttocarrypackaged productsasthey
movethroughdistribution iswaisthigh. Another influence on
drop
heights arebeltsystems andconveyors usedtomove parcel packagesquicklythroughout thedistributionenvironment.
Theseobservationssuggestthat process,ratherthanweight,may playa criticalroll in
influencing
from how higha packageis dropped.Theshock
(drop)
aspect ofdistribution hazardscreatestheneedforthepackagingdesigns andtoverifyanyproduct and/orpackagedesignchanges. It is widely believedthat theshockinput hazardcreatesthegreatestpotentialfor damagetothepackagedproduct.
LINKAGE TO REAL WORLD EVENTS
Observations have leadto the conclusionthatpackages arealmostneverdroppedin such away so the packageimpacts a surfacecompletely flat. This iscaused
by
several reasons, such ascenter ofgravity andtheway thepackageisreleased orfalls. Thischaracteristicbecomes very important both fromadata interpretationandtestdevelopment
standpoint. A
truly
flatdrop
representsa more severe shockto theproductthandoesanedgeorcorner
drop,
whicharemoretypicaloftherealworld. Althoughpureflat drops donot
typically
take place, dueto theirreproducibility in alaboratory
situation,they
serve asauseful elementinashippingtest.
Moreover,
becauseoftheir"worstcase"nature,
they
build inasafety factor into shippingtests.
"Real world"
dropsare
typically
randominnature,dictating
that theproduct mustbeprotectedequallyon all
faces,
as well ascornersand edges. "Real world"drops may
alsooccurontoavarietyofdifferenttypes of surfaces. These notonly includetypical floors andtruck
beds,
butalso otherpackagesforexample,whichmay greatly influence therateofdecelerationandvelocitychangevalues.Again,
it is importanttorememberthese twocharacteristics arethecomponentsofproductdamage. Thepeakacceleration (G
level)
isnotthe onlyelementofdamage. Theshapeoftheshock pulse(trapezoidal,
sinusoidal,etc.) andtheshockdurationareimportantelements ofproductdamage. A trapezoidalpulseismore severethanasinusoidal pulsegiventhesame peakG leveland
duration. This is duetoanincreased "areaunderthe
curve"
orvelocitychange.
Fromapractical standpoint(withsome exceptions e.g. military packaging)the packagingsystem cannotbeexpectedtoprotecttheproduct against
disastrous,
extremely6HewlettPackard Homepage:
http^/w>v.corp.hp.com/publish/talkpkg/testing/section3Jitm.
rareevents.
Designing
to such ahigh levelof protection wouldcertainly leadtoexcessivecosts andpackagingmaterials
used.7
7Hewlett PackardHomepage.
3.0 TEST
MATERIALS
AND METHODSMATERIALS
Measuring
DeviceAnelectronicdata measuringandrecording device is oftenusedto gather
informationaboutshock, vibration,
humidity
and otherfactors inthedistributionenvironment. Forthisstudy, theSAVER
by
Lansmont Corporationwas utilized asthein-package measuring device. Several datarecorderswere used
during
thecourseofthestudy. All deviceswere calibrated atthestart ofthestudyand checked atthe
beginning
andend of each
trip
toconfirm. TheSAVER was utilizedforthestudynotonly for itssmallsize
(
5"
x
3"
x
2")
and weight(2.2lb.),
which minimizesdetection inthe test packages,butalsobecauseofits ability tomeasure and record a significant amount ofdata(several
megabytes)over a
long
period oftime (orseveral weeks).Eachrecorder usedforthisstudycontainsatri-axial accelerometer,which enablesit
tomeasure amplitude anddirectionof an event. Inaddition, it isableto measure when a
zero-Gconditionoccurs,which isa characteristicof adrop. Onceevents aredeterminedto
be "real,"the softwarebundledwiththeSAVER hastheabilitytodeterminetherelease
heightofthepackageaswell asimpactvelocity.
Test Packages
Thetestpackagescontaining
"dummy
loads"were intendedtoanddesignedtolook
like ordinaryproduct. The reasoning behindthiswas sothatthepackages would move
throughthedistributionstream asnormally aspossible,thereforereceivingmore
representativetreatmentandrecordingmorerepresentativedata.
Onepackageweighed 10lb andhad dimensionsofapproximately
12"
x
6"
x 10".
Thissize and weightis typicalofanumber ofKodakpackages,both forchemicalproducts
andsmall equipment products.
Thepackage didnotcontainproduct,containing insteadan appropriately-sized
woodenblockwith ahollowedout center sectioninwhichdatarecorder was placed. The
woodenblockwas sized suchthatseveralinchesoffoamcouldbeplacedaroundthe
woodenblocktoprotectthedatarecorderfromexcessive shock,whichmay havecause
damageto thedatarecorder. The foam doesnot affecttheabilityofthedatarecorderto
accuratelyrecord
drop
heights. Thiswas confirmedinthelaboratory
priorto anyofthestudy shipments.
Asecond package weighed55 lband measured 10"
x 10"
x
10",
representative ofphotochemical product.
The finalpackage weighed35lb andhaddimensionsofapproximately 12" x
12"
x
16",
representativeof acaseofKodakEktacolor Royalpaper.Aswiththeothertest packages, this testpackagedidnot contain product. Italso
contained an appropriatelysized woodenblockwith ahollowedout center sectioninwhich
adatarecorderwasplaced. Thewoodenblockanddatarecorder were placedintoa
corrugated carton complete withKodak Ektacolor Royalpapertradedress.
METHODS
DataCollection
Allofthe testunits were calibrated
by
themanufacturer atthebeginning
ofthisexperiment. Thecalibrations wereconfirmedinour
laboratory
as asafeguardcheck, andwereperiodicallycheckedthroughoutthecourse ofthisexperiment. Ifdiscrepanciesin
calibrationwere
discovered,
thedatarecorderinquestionwas takenout of service and senttobackto themanufacturerforrepair and/or re-calibration.
At thestart ofevery trip,the
battery
ineachdatarecorder wasfully
charged,theunitturnedon, andcarefullyplacedintothe
dummy
loadpackage. Eachtestpackage,wassubjectedtoaflat bottom "check drop"
fromaknownheightatthe
beginning
ofitsjourney. Uponarrival atits
destination,
thepackage was once againsubjectedto aflatbottomcheck
drop,
fromthesameheightasthefirstdrop,
beforethepackagewasturnedaroundtobeginareturntrip. Uponarrivalbackatthe
lab,
the testpackage wassubjectedto thefinal flat bottom
drop,
again atthesameheightastheinitial "checkdrop",
beforethedatarecorder wasdownloadedandtheunitshut off.
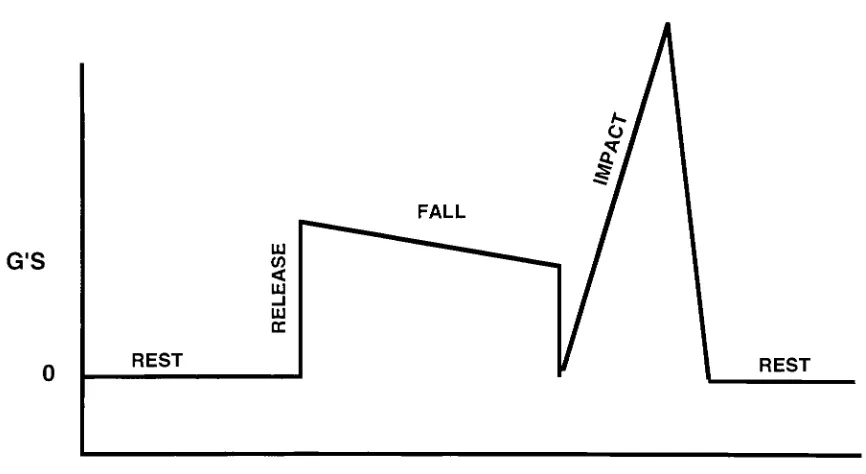
Thecheckdropswereeasytorecognizebecauseoftheirwell-formed
drop
[image:24.574.72.505.235.472.2]signature and common
drop
height (Figure 1).Figure 1
G'S COUJ
<
UJ
-I
UJ cc
REST
FALL
REST
TIME
Thecheckdrops servedseveralvery important functions
during
our study:Thecheckdropsserved as markersthatdefinedeachtrip. A
trip
was definedaseither an outbound or return
leg
of a roundtrip.Thecheckdrops servedasconfirmationthattherecorder wasworkingthroughout
the trip.
Unfortunately,
onseveraltrips,the recorders were notfunctioning
continuously.Thisproblem wasidentified quicklythroughuse ofthecheck
drop
process.Thecheckdropsserved as confirmationthattherecorders wereincorrect
calibration bothatthe
beginning
andtheend of eachtrip.Routes Measured
Ourcustomerbase is
becoming
more global allthetime,soitwasdecidedthedatacollectionmethodshouldbeplannedtoreflectthischaracteristic. Forthis study, theKodak
distributionnetworkwas divided up intothreemajor regions:theUnited
States, Europe,
andAustralia. Theseregions were chosenbecause
they
representtheareas wherethemajorityof ourproducts aredistributedand effective contactsinthoseareashelpedmanage
testpackage receipt and shipment.
Themode oftransportation measuredwithinthis studywastruck transportation.
The United Stateswas subdividedinto Less-than-Truckload
(LTL)
and smallparcelcategoriestomoreaccuratelyreflecttheway our products are shipped. The domestic small
parceldatawas gatheredfromshipmentsthatallbegan in
Rochester,
NYandwere shippedtovariouslocationsthroughout theUnited States. The LTLshipmentswithintheUnited
States began in
Rochester,
NYandwere shippedtoDallas,
TXandWhitier,
CA.The European datawascollectedfromshipmentsbetween Central Distribution
Centers
(CDCs)
intheEuropeanregion. The CDCsarelocated inChalon, France;
Harrow, England;
andStuttgart,
Germany.The Australian datawas collectedfromshipmentsmadebetween Melbourneand
Sydney
viaLTL. Inaddition,localdeliverieswithin metropolitanMelbournewere alsoincluded inthedatacollected.8
The datawasdownloaded usingthe SAVERsoftware upon returnto Kodak's
Package
Engineering
andGraphic Design(PEDG)
testlabatKodakRochester,
NY. Oncedownloaded,
thedatawas sortedtodeterminewhichevents were real and which were not.Using
thesignature checkdrop
pulse (Figure1)
as aguide, aPEGDtechnicianwas trained8Stephen R
Pierce, MS.,personal communications.
onwhattolook forto determinewhetheror nottheeventwascaused
by
arealdrop
ornot.Typically,
foravarietyofreasons,themajorityof eventsmeasured weredeterminedtobecaused
by
somethingotherthan adrop
andtherefore,notincluded. Forconsistencyofinterpretation,
the sametechnicianwasusedtosortthedatafromallofthe trips.4.0 RESULTS AND DISCUSSION
An AnalysisofVariance
(ANOVA)
was usedthroughout this studytoidentify
andisolatecharacteristics affecting
drop
heightandfrequency. Forthe threedifferentpackageweights included inourstudy,therewasno evidencetosubstantiate package weight
having
astrongcorrelationwith
drop
height. The data derived fromthedifferentpackageweights,upto 55
lb.,
appearedtobe fromthesame datapopulation.Itwasdetermined using ANOVA
however,
thateach sub environment or"process"
had astrong influenceonboth
drop
heightanddrop
frequency. Theterm"process" meansthemethod
by
whichthepackages werehandled. Thisfinding
is logical dueto the factthateachsub-environmentutilizeddifferenttools todistributeand movepackages. Tools such
astrucks, belt/conveyer belt
heights,
loading
techniques, andlevel ofpersonneltraining
vary significantly fromonesub-environmentto the
next.9
Theseconditions haveamajor
affect on
identifying
datapopulations.Forthis reason, thedata forthisstudy is divided into fourcategories:Domestic
(USA)
Parcel,
LTL(USA),
Australia,
andEurope. Themethod oftransportationin bothAustraliaandEuropewasLTL. Forsimplicity, theheadings for AustraliaandEuropedata
will not reflectthis, however.
Whatfollowsonthenextseveralpagesisacompilation, summary, andstatistical
summaryof allofthedatameasuredinourexperiment.
9MerrileeRitter, MS.,personal communications.
EUROPEAN DROP HEIGHT DATA
SUMMARY, HISTOGRAM,
STATISTICSThe
following
isthesummaryoftheEuropeandrop
height data:op Height
Frequency
Cumulative %(inches)
(drops)
1 1 2.27%
2 10 25.00%
3 10 47.73%
4 5 59.09%
5 0 59.09%
6 6 72.73%
7 3 79.55%
8 0 79.55%
9 81.82%
10 84.09%
11 0 84.09%
12 86.36%
13 88.64%
14 90.91%
15 93.18%
16 95.45%
17 0 95.45%
18 0 95.45%
19 0 95.45%
20 1 97.73%
21 0 97.73%
22 0 97.73%
23 0 97.73%
24 0 97.73%
25 0 97.73%
26 1 100.00%
27 0 100.00%
28 0 100.00%
29 0 100.00%
More 0 100.00%
The
following
isaHistogramoftheEuropeanDrop
Heights:CO a. o
cu
_
E 3
i-co in
Drop
Height(inches)
The
following
isa statisticalsummaryoftheEuropeandrop
heights:Mean
(inches)
5.448864Median
(inches)
3.28Mode
(inches)
2.51Standard Deviation
(inches)
5.420728Range
(inches)
24.41Minimum
(inches)
0.77Maximum
(inches)
25.18Count
(drops)
44EUROPEAN DROPS PER TRIP DATA
SUMMARY,
HISTOGRAMANDSTATISTICSThe
following
isthe summaryoftheEuropeanDrop
pertrip
data:)s/Trip
Frequency
(trips)
Cumulative %
1 0 0.00%
2 0 0.00%
3 0 0.00%
4 1 16.67%
5 2 50.00%
6 0 50.00%
7 0 50.00%
8 0 50.00%
9 2 83.33%
10 0 83.33%
11 1 100.00%
lore 0 100.00%
The
following
is aHistogramoftheEuropeanDropspertrip:CO o. CD _ E ~ z 2 j 1.8 --1.6 --1.4 --1.2 --1 --0.8 --0.6 --0.4 --0.2 --0
--i m i1 'i1
7 __B__._jfljj
1 1 h H r
T 100.00% -- 90.00% -- 80.00% -- 70.00% -- 60.00% -- 50.00% --40.00% --30.00% --20.00% --10.00% --.00% --c\iootLoc_r-~coo50--CD O
Number of Drops
The
following
isastatistical summaryoftheEuropean dropspertrip:Mean
(drops/trip)
7.166666667Median
(drops/trip)
7Mode
(drops/trip)
9Standard Deviation
(drops/trip)
2.857738033Range
(drops/trip)
7Minimum
(drops/trip)
4Maximum
(drops/trip)
11Count
(trips)
6AUSTRALIAN DROP HEIGHTDATA
SUMMARY,
HISTOGRAM, STATISTICSThe
following
isthe summaryoftheAustralianDrop
height data:rop Height
Frequency
Cumulative%(inches)
(drops)
1 0 0.00%
2 24 10.08%
3 25 20.59%
4 36 35.71%
5 22 44.96%
6 16 51.68%
7 24 61.76%
8 16 68.49%
9 8 71.85%
10 12 76.89%
11 14 82.77%
12 4 84.45%
13 11 89.08%
14 3 90.34%
15 2 91.18%
16 3 92.44%
17 2 93.28%
18 4 94.96%
19 4 96.64%
20 2 97.48%
21 1 97.90%
22 0 97.90%
23 0 97.90%
24 0 97.90%
25 2 98.74%
26 0 98.74%
27 1 99.16%
28 1 99.58%
29 1 100.00%
30 0 100.00%
More 0 100.00%
The
following
isaHistogramoftheAustralianDrop
Heights: IS) o. o 40 35 30 25 --20 --CD 3 Z 1 0 50 H mjap.f1flfJfJ
Wjiflk
'i i i piH-100.00% -- 90.00% -- 80.00% 70.00%
+
60.00% 50.00% 40.00% 30.00% 20.00% 10.00% .00%--co in h- co n ifl n a>i n in n a> cu
t-t-!-i---CMCMCNC\ICM
_
Drop
Height(inches)
The
following
is a statisticalsummary oftheAustraliandrop
heights:Mean
(inches)
Median(inches)
Mode
(inches)
Standard Deviation(inches)
AUSTRALIANDROPS PER TRIP DATA
SUMMARY, HISTOGRAM,
ANDSTATISTICS
The
following
isthesummaryoftheAustralianDrop
pertrip
data:)s/Trip
Frequency
Cumulative%(trips)
1 0 0.00%
2 0 0.00%
3 2 6.67%
4 5 23.33%
5 2 30.00%
6 4 43.33%
7 2 50.00%
8 5 66.67%
9 2 73.33%
10 0 73.33%
11 4 86.67%
12 0 86.67%
13 0 86.67%
14 1 90.00%
15 1 93.33%
16 0 93.33%
17 1 96.67%
18 1 100.00%
19 0 100.00%
lore 0 100.00%
The
following
isaHistogramoftheAustralian dropspertrip:(A
Q.
a>
E
3
CJ CO -<*
Number of drops
The
following
isa statisticalsummary oftheAustralian dropspertrip:Mean (dropspertrip) Median (dropspertrip)
Mode (dropspertrip) Standard Deviation (dropsper
trip)
Range
Minimum (dropspertrip) Maximum (dropspertrip)
Count
(trips)
8 7.5
8
4.025778999
15 3 18 30
LESS THAN TRUCK LOAD
(LTL)
DROP HEIGHT DATASUMMARY,
HISTOGRAM,
STATISTICSThe
following
isthesummaryoftheDomestic(USA)
Less ThanTruckload(LTL)
Drop
height data:rop Height
Frequency
Cumulative %(inches)
(drops)
1 0 0.00%
2 18 4.77%
3 13 8.22%
4 16 12.47%
5 19 17.51%
6 21 23.08%
7 26 29.97%
8 30 37.93%
9 19 42.97%
10 20 48.28%
11 14 51.99%
12 17 56.50%
13 10 59.15%
14 12 62.33%
15 9 64.72%
16 17 69.23%
17 8 71.35%
18 9 73.74%
19 11 76.66%
20 4 77.72%
21 9 80.11%
22 8 82.23%
23 11 85.15%
24 7 87.00%
25 3 87.80%
26 12 90.98%
27 3 91.78%
28 5 93.10%
29 1 93.37%
30 1 93.63%
31 2 94.16%
32 3 94.96%
33 1 95.23%
34 0 95.23%
35 0 95.23%
36 2 95.76%
37 0 95.76%
38 2 96.29%
39 4 97.35%
40 3 98.14%
41 0 98.14%
42 1 98.41%
43 0 98.41%
44 0 98.41%
45 0
46 1
47 4
48 1
lore 0
98.41%
98.67% 99.73% 100.00% 100.00%
The
following
is aHistogramoftheLess Than Truckload(LTL)
Drop
Heights:100.00%
-- 90.00%
--80.00%
--70.00%
--60.00%
--50.00%
--40.00%
--30.00%
--20.00%
10.00%
.00%
cn n
t-ui
-- i- CM CM
Drop
Height(inches)
The
following
isastatisticalsummaryoftheLess Than Truckload(LTL)
drop
heights:
Mean
(inches)
13.77984085Median
(inches)
11Mode
(inches)
8Standard Deviation
(inches)
9.6723898Range
(inches)
46Minimum
(inches)
2Maximum
(inches)
48Count
(drops)
377LESS THAN TRUCKLOAD
(LTL)
DROPS PER TRIP DATASUMMARY,
HISTOGRAM,
AND STATISTICSThe
following
isthesummaryoftheLess Than Truckload(LTL)
dropspertrip
data:
Dps/Trip
Frequency
Cumulative %(trips)
1 3 5.36%
2 5 14.29%
3 4 21.43%
4 7 33.93%
5 6 44.64%
6 4 51.79%
7 4 58.93%
8 7 71.43%
9 1 73.21%
10 4 80.36%
11 2 83.93%
12 6 94.64%
13 2 98.21%
14 0 98.21%
15 0 98.21%
16 0 98.21%
17 1 100.00%
More 0 100.00%
The
following
isaHistogramoftheLess Than Truckload(LTL)
dropspertrip:i-cMn^mcDsooojOi-cMn^-ujCDN cd
---O
100.00%
90.00%
80.00%
70.00%
60.00%
50.00%
40.00%
30.00%
20.00%
10.00%
.00%
Number of Drops
The
following
isa statisticalsummaryoftheLess Than Truckload(LTL)
dropspertrip:
Mean
(drops/trip)
Median(drops/trip)
Mode
(drops/trip)
Standard Deviation(drops/trip)
Range
(drops/trip)
Minimum(drops/trip)
Maximum(drops/trip)
Count
(trips)
6.732142857 6 8 3.777883349
16 1 17 56
DOMESTIC PARCEL DROP HEIGHT DATA
SUMMARY, HISTOGRAM,
STATISTICS
The
following
isthesummaryofthedomesticparceldrop
height data:Drop
Height(inches)
0
Frequency
(drops)
0
Cumulative%
0.00%
1 3 0.62%
2 20 4.77%
3 26 10.17%
4 36 17.63%
5 56 29.25%
6 53 40.25%
7 36 47.72%
8 43 56.64%
9 29 62.66%
10 20 66.80%
11 23 71.58%
12 21 75.93%
13 23 80.71%
14 6 81.95%
15 15 85.06%
16 13 87.76%
17 6 89.00%
18 7 90.46%
19 5 91.49%
20 11 93.78%
21 5 94.81%
22 9 96.68%
23 4 97.51%
24 1 97.72%
25 5 98.76%
26 3 99.38%
27 0 99.38%
28 2 99.79%
29 0 99.79%
30 1 100.00%
More 0 100.00%
The
following
isaHistogramofthedomesticparceldrop
height data:OW^IDCOOOI^CDCOOai^COCOO
---i-CMCMCMCMCMCO
Drop
Height(inches)
The
following
isa statistical summaryofthedomesticparceldrop
heights:Mean
(inches)
9.319502075Median
(inches)
8Mode
(inches)
5Standard Deviation
(inches)
5.741629844Range
(inches)
29Minimum
(inches)
1Maximum
(inches)
30Count
(drops)
482DOMESTIC PARCEL DROPS PER TRIP DATA
SUMMARY,
HISTOGRAM,ANDSTATISTICS
The
following
isthesummaryofthedomesticparceldrops pertrip
data:Ds/Trip
Frequency
Cumulative%(trips)
0 14 8.05%
1 43 32.76%
2 33 51.72%
3 32 70.11%
4 28 86.21%
5 11 92.53%
6 4 94.83%
7 2 95.98%
8 1 96.55%
9 1 97.13%
10 2 98.28%
11 1 98.85%
12 0 98.85%
13 0 98.85%
14 0 98.85%
15 0 98.85%
16 1 99.43%
17 0 99.43%
18 0 99.43%
19 0 99.43%
20 1 100.00%
21 0 100.00%
22 0 100.00%
lore 0 100.00%
The
following
isaHistogramofthedomesticparcel dropspertrip: a <D sx E 3FFFFFPI I I I Fl I I PI I I
CD CO O CM "t CD CO
100.0 -- 90.00 -- 80.00 70.00 60.00 50.00 40.00 30.00 20.00 10.00 .00% 0% % % % % % % % % o CM CM CM
Number of Drops
The
following
isa statisticalsummaryofthedomesticparcel dropspertrip:Mean
(drops/trip)
Median(drops/trip)
Mode
(drops/trip)
Standard Deviation(drops/trip)
ALL DROP HEIGHT DATA
SUMMARY,
HISTOGRAM,
STATISTICSThe
following
isthesummaryof all ofthedrop
height datacompiledfromthefoursegments ofthedistributionenvironment:
Drop
Height(inches)
1 2 3 4 5 6 7 8 9 10 11 12 13 14 15 16 17 18 19 20 21 22 23 24 25 26 27 28 29 30 31 32 33 34 35 36 37 38 39 40 41 42 43 44 45 46Frequency
Cumulative %47 48 More
4 99.90%
1 100.00%
0 100.00%
The
following
Histogram belowsummarizes alldrop
height data:FPrfwmrffthllhfrl
100.00%
f
mCOWST-WOIONT-lfl CD
----CMCMCMCOCO't-^-o
Drop
Height(inches)
-- 90.00%
80.00%
--70.00%
-- 60.00%
-- 50.00%
40.00%
--30.00%
-- 20.00%
-- 10.00%
.00%
The
following
isa statisticalsummaryofthe"AllDrop
Height"data:
Mean
(inches)
10.26809933Median
(inches)
8Mode
(inches)
8StandardDeviation
(inches)
7.844748503Range
(inches)
47.23Minimum
(inches)
0.77Maximum
(inches)
48Count
(drops)
1047ALLDROPS PER TRIP DATA
SUMMARY,
HISTOGRAM,
STATISTICSThe
following
isthesummaryof allofthedropspertrip
datacompiledfromthefoursegments ofthisKodak distributionenvironment measuredinthisstudy:
ops/Trip
Frequency
(trips)
Cumulative%
1 29 13.81%
2 31 28.57%
3 29 42.38%
4 33 58.10%
5 21 68.10%
6 12 73.81%
7 8 77.62%
8 13 83.81%
9 6 86.67%
10 6 89.52%
11 8 93.33%
12 6 96.19%
13 2 97.14%
14 1 97.62%
15 1 98.10%
16 0 98.10%
17 2 99.05%
18 1 99.52%
19 0 99.52%
20 1 100.00%
More 0 100.00%
The
following
Histogramsummarizes allthedatacompiledfromthefoursegmentsofthisKodakdistributionenvironment measuredinthisstudy:
(0 Q. a : I-^ o i-Oi J3 E 3 Z 35
j
30 --25 20 1 5 -|1 0 -|
5
0
f.
wfPfPPPP
|pp| pp|
p|100.00% 90.00% 80.00% 70.00% 60.00% 50.00% 40.00% 30.00% 20.00% 10.00% .00% t-COWNCjj'-C'jBSO) CD ---o
Number of Drops
The
following
is a statisticalsummaryofthe"all dropspertrip"
datacompiledfrom
thefoursegmentsoftheKodakdistributionenvironment measuredinthis study:
Mean
(drops/trip)
Median(drops/trip)
Mode
(drops/trip)
StandardDeviation(drops/trip)
TEST PLANS
Twotestplanshavebeen derived fromthis study. The firsttestplanis derived
from data
looking
at eachdistributionsub-environmentindependently. Examinationofthedatasetshasrevealedthatthedatapopulations aredependentuponprocess.
Again,
the statistical analysis ofthedatarevealstheprocesshas a much greateraffect on
handling
thandoestheweightofthepackage,atleast pertainingtotheweightrangewehaveexaminedinthis study.10
The
following
testplans arebasedonaraw,realdatamodelasopposedtoadescriptivetheoretical statisticalmodelapproach. The large datasamplesizewithinthis
study allowsforsoundtestplanstobe derived usingthisapproach. Thisapproach will
leadtoatestplanyieldingtrueand reallifeestimations.
Test Plan 1
Thistestplan wasderived fromanalysis ofeachshippingenvironment
(process)
independently
ofeach other. Thisplan wouldbeusedonly ifthedestinationontheproductshipments areknowntobeconfinedtoone region oftheworld. Thistestplangivesthe
packagingengineer andqualityassurancethe
flexibility
oftesting
toa specificenvironment. Itshouldonly beused whentheproductteamhasavery high degreeof
certaintythat theirproductregionwillnotchange.
This testplanalsorevealsthemost severe
handling
environment(LTL). Thisproceduremay beused
by
programs,which duetoproductvalue, quantity, etc., feelmorecomfortable subjectingtheirpackagestoa more severe
(conservative)
test.10MerrileeRitter, MS.,personal communications.
Assurance Level Environment Environment Environment Environment
low
(50%)
Domestic Parcel LTL Australia Europenumber ofdrops 4 7 8 8
drop
distribution one at8" threeat8"
three at4" fourat
3"
one at 13" oneat 10"
two at7" threeat6"
one at 16" one at 16" one at 11" one at 25" one at 30" one at 26:" one at 48" oneat 13" one at 28" medium
(84%)
number ofdrops 7 11 12 10
drop
distribution three at6" threeat5" threeat 4" threeat 2" two at 8" threeat 7" threeat 6" threeat 3" oneat 13" twoat 10"twoat 8" oneat 4" one at 30" one at 16" twoat 11"
oneat6"
one at 26" one at 17" oneat 7" oneat 48" one at 28" oneat 25" high
(99%)
number ofdrops 9 15 16 13
drop
distribution two at5" threeat5"
fourat
4"
threeat
2"
twoat6" threeat 7"
threeat6" threeat 3"
twoat 8"
threeat
8"
fourat8" twoat 4" one at 13" twoat 10" threeat 11"
two at6"
one at 16" twoat 16" one at 17"
one at7"
one at 30" one at 26" one at 48" one at 28" one at 25" Statistical forabovetest
average#of 3.3 6.7 8 7.2
standarddeviation 2.8 3.8 4 2.9
median#ofdrops 3 6 7.5 7
average
drop
9.4 13.8 7 5.4standarddeviation 5.8 9.7 5.2 5.4
median
drop
8 11 5.7 3.3maximum
drop
30 48 28 25Thesecondtestplanistheresult of a complete compilation and statistical analysis
of all
drop frequency
and alldrop
heights from US smallparcel,European,
Australian, andLTL datapooledtogether. Thistestplan wouldbeused whenthedestinationofthe
packageisnot specifictoone region oftheworld.
Test Plan 2
;(approximateprobability) Environment
low
(50%)
Allcarriersnumber ofdrops 5
drop
distribution one at4"
oneat 8"
one at 13"
one at26"
one at 39"
medium
(84%)
number ofdrops
drop
distribution twoat4"
twoat6"
twoat 8" one at 13" one at 26" one at 39" high
(99%)
number ofdrops
drop
distributiondrops13
twoat 4"
twoat6"
twoat8"
twoat 10"
one at 13"
one at 16"
one at26"
one at39"
one at48"
Theprevioustestplans arebasedonthe
following
descriptivestatistics:average#ofdrops 4.99
standarddeviationofnumber ofdrops 3.7
median#ofdrops 4
average
drop
height(inches)
10.27standarddeviationof
drop
height 7.8median
drop
height(inches)
8maximum
drop
height(inches)
485.0 CONCLUSIONS AND RECOMMENDATIONS
Theevents measuredandthedataproduced
during
thisstudy (forpackagesweighing 55 lbandunder)disprovethenullhypothesiswhich statesthe
drop
height probabilitycurvesarerepresentativeoftheKodak distributionenvironment. The highestdrop
heightmeasuredinthis study, which consistedof over 1000measureddrops,
was48inches. The48"
drop
onlyoccurred on one out ofthe210tripsmeasuredforthisstudy.By
wayofcomparison, atthe0.01%levelontheprobabilitycurve, apackaged productweighing 25 lborlessmustbe dropped from
70"
ten times. This clearlypointsto ahigh
potentialforoverpackaging.
This study also
demonstrates,
forthepackage weights(10lb.-55lb.)
researchedinthis study,distributionprocess hasa greater affect on
drop
heightthanpackage weightdoes. This is verymuchcontraryto traditional
thinking
around package weight anddrop
height.
Traditionally,
the heavierthe package, thelowerthedrop
height.The probabilitycurvesmay beofusetoothers whoare not ableto gatherrealfield
data,
butthey
areclearlytooseveretorepresenttheKodak distributionenvironmentmeasured inthisstudy.
The findingsare significantbecause
they
suggesttheoverpackagingofKodakproductsinordertosuccessfullypassthe test
drop
heightsrequiredby
theprobabilitycurves.
Moreover,
theoverpackagingmay have ledtomoreiterations and costsduring
thepackagedevelopmentprocessaswell,andtomore wasteforourcustomersto manage.
The findings
identify
anopportunity forpackage wastereduction as well as an overallreduction inexpenditureonpackaging
by
thecompany.Thenextstep istoputthisstudy andtestplanstogooduse as thebasisof a new
drop
testStandardOperating
Procedureintheformofacorporatetestprocedure andstandard.
RECOMMENDATIONS FOR FUTURE AREAS OF STUDY
Possibleareasforfuturework withinthe scope ofthisstudy include:
1)
Confirmationofthedrop
testeffectivenessthroughfieldshipment studies.2)
Further studyof packagescloserto the 100lbrangeasless manualhandling
takesplace
during
movementsof suchlargerpackages.3)
Further studyof orientation andwhich surfaceofthepackage ismostlikely
tobesubjectedtoa
drop
impact. It mayalsobeusefultomeasurehowdifferentpackagedesign features affect orientation(e.g.labelplacement etc.).
4)
Measurementofenvironmentsin emergingmarkets such astheFarEast,
Indiaandtheformer Soviet Union.
6.0 REFERENCES
Richard K.
Brandeburg, Ph.D.,
JulianJune-Ling
Lee, Ph.D.,
FundamentalsofPackaging
Dynamics (MTS Systems
Corporation,
1985).Dennis
Young,
"Strategic TransportPackaging
Performance:Linking
ProductandPackageEvaluationtoCorporate
Objectives",
IOPP Transpack '95. Hewlett PackardHomepage:http://www.corp.hp.com/publish/talkpkg/testing/section3.htm.
Richard
Sheehan,
"Predicting
Field Performance fromLaboratory
Testing"Current Trends in Protective
Packaging
ofComputers.Richard
Sheehan,
"The ConnectionwithMaterials andComponentSpecifications",
IOPPTranspack '97.
Merrilee
Ritter, MS.,
Quality
AssuranceStatistician,
personal communications.Stephen R.
Pierce, MS.,
SeniorPackaging
Engineer,
CertifiedPackaging
Professional,
personalcommunications.