METHODS FOR THE EVAL
METHODS FOR THE EVAL
METHODS FOR THE EVAL
METHODS FOR THE EVALUATION OF
UATION OF
UATION OF
UATION OF
MELANIN AS A SUNSCRE
MELANIN AS A SUNSCRE
MELANIN AS A SUNSCRE
MELANIN AS A SUNSCREEN AGENT
EN AGENT
EN AGENT
EN AGENT
Martin Daniel Bleasel, B.Pharm. (Hons.)
Submitted in fulfilment of the requirements for the degree of Doctor of
Philosophy
UNIVERSITY OF TASMANIA
This thesis contains no material that has been accepted for the award of any
other degree or graduate diploma in any tertiary institution, except by way
of background information and duly acknowledged in the text of the thesis.
To the best of my knowledge and belief, this contains no material previously
published or written by another person, except when due reference is made
in the text of this thesis.
Martin Bleasel
This thesis may be made available for loan and limited copying in
accordance with the Copyright Act 1968.
Acknowledgments Acknowledgments Acknowledgments Acknowledgments
Firstly, I would like to thank my supervisor Dr Stephen Aldous for his
guidance throughout the course of this study
I would also like to thank Associate Professor Stuart McLean, and Dr
Stephen Aldous, Directors of the School of Pharmacy, University of
Tasmania, for kindly making available to me the facilities of the department.
Thank you also to the Royal Hobart Hospital, Acute Care Program for the
Research grant which provided financial support towards all the studies
undertaken.
From the Central Science Laboratory (CSL), University of Tasmania I would
like to thank Dr Noel Davies and Dr Ross Lincolne for their assistance with
different studies in this thesis.
The following people also assisted with different studies in this thesis, and I
wish to thank them:
Rosie Ashbolt, Menzies Center, University of Tasmania at Hobart
Gina Haddolt, Tasmanian School of Pharmacy, University of Tasmania at Hobart
Glen Haddolt, Leslie Vale, Tasmania
Omar Hasan, Pharmacy Department, University of Tasmania at Hobart David Blackburn , Tas Paints, Hobart
T
T
T
T
ABLE OF
ABLE OF
ABLE OF
ABLE OF
C
C
C
C
ONTENTS
ONTENTS
ONTENTS
ONTENTS
Acknowledgments ... iii
Abbreviations... vi
Summary...viii
1) Reproducible synthesis of melanins ... ix
2) Characterisation of melanin ...x
3) Measurement of skin colour by diffuse reflectance ...x
4) In vitro evaluation of topical sunscreens... xi
CHAPTER 1: BACKGROUN CHAPTER 1: BACKGROUNCHAPTER 1: BACKGROUN CHAPTER 1: BACKGROUNDDD ...D... 1111
SUNSCREENS...1
Sunscreen agents ...1
Sunscreen efficacy ...2
Skin types...5
Sun Protection Factor and skin types ...6
CHAPTER 2: SYNTHESIS CHAPTER 2: SYNTHESISCHAPTER 2: SYNTHESIS CHAPTER 2: SYNTHESIS OF MELANINS OF MELANINS OF MELANINS OF MELANINS ... 7777 ...
BACKGROUND...7
Melanin ...7
Pigment content and protection against UV damage...8
Photoprotection of melanin – mode of action...9
Synthesis of melanins...9
Development of synthetic procedure ...12
PREPARATION OF MELANINS...13
Aim ...13
Materials and Methods ...14
Results ...18
Discussion ...19
CHAPTER 3: CHARACTER CHAPTER 3: CHARACTERCHAPTER 3: CHARACTER CHAPTER 3: CHARACTERISATION OF MELANINSISATION OF MELANINSISATION OF MELANINSISATION OF MELANINS... 222222 22
BACKGROUND...22
Overview of analysis methods ...22
Background to pyrolysis...22
Interpretation of pyrolysis results...27
PYROLYSIS ANALYSIS OF MELANINS...29
Aim ...29
Materials and Methods ...29
Results ...42
Discussion ...57
CHAPTER 4: CHAPTER 4:CHAPTER 4: CHAPTER 4: IN VITRO IN VITRO IN VITRO IN VITRO EVALUATION OF SUN P EVALUATION OF SUN P EVALUATION OF SUN P EVALUATION OF SUN PROTECTION FACTORS OFROTECTION FACTORS OFROTECTION FACTORS OFROTECTION FACTORS OF SUNSCREEN AGENTS SUNSCREEN AGENTSSUNSCREEN AGENTS SUNSCREEN AGENTS ... 68...6868 68
BACKGROUND...68
Theory ...70
In vivo determination of SPF values...70
IN VITRO SPF DETERMINATION PROCEDURE...74
Aim ...75
Materials and methods ...75
Results ...93
Statistical analysis of in vitro SPF results ...96
Discussion ...100
CHAPTER 5: THE CHARA CHAPTER 5: THE CHARACHAPTER 5: THE CHARA CHAPTER 5: THE CHARACTERISATION OF SKIN CTERISATION OF SKIN CTERISATION OF SKIN CTERISATION OF SKIN COLOUR BY DIFFUSE COLOUR BY DIFFUSE COLOUR BY DIFFUSE COLOUR BY DIFFUSE REFLECTANCE REFLECTANCEREFLECTANCE REFLECTANCE ... 106...106106106 BACKGROUND...106
The need for colour measurement ...106
Theory of Colour Perception ...107
Colour...107
The optics of human skin ...112
Logarithm of the inverse reflectance...113
Other instrumentation for the determination of diffuse reflectance ...114
EXPERIMENTAL PROCEDURE:DETERMINATION OF DIFFUSE REFLECTANCE...115
Aims...115
Materials and Methods ...115
Results ...124
Discussion ...139
CHAPTER 6: GENERAL C CHAPTER 6: GENERAL CCHAPTER 6: GENERAL C CHAPTER 6: GENERAL CONCLUSIONONCLUSIONONCLUSIONONCLUSION ... 147147147147 Synthesis of melanins...147
Characterisation of melanins ...147
Characterisation of skin colour by diffuse reflectance...148
In vitro evaluations of Sun Protective Factors of sunscreen agent ...149
APPENDICES...151
Appendix 1: Computer software...152
Melanin analysis software...152
Diffuse reflectance software...156
In vitro SPF determination software...160
Miscellaneous ...168
Appendix 2: Tables...172
Abbreviations AbbreviationsAbbreviations Abbreviations
°C °C°C
°C degrees Celsius 3D
3D3D
3D three dimensional µg
µgµg
µg microgram
µL µLµL
µL microlitre
mm mmmm
mm millimetre
µm µmµm
µm micrometre
ADL ADLADL
ADL Applications Development Language APTF
APTFAPTF
APTF Australian Photobiology Testing Facility ASTM
ASTMASTM
ASTM American Society for Testing and Materials ASCII
ASCIIASCII
ASCII American Standard Code for Information Interchange CIE
CIECIE
CIE Commission Internationale de l’Eclairge (International Commission on Illumination )
cm cmcm
cm centimetre
DF DFDF
DF degrees of freedom DNA
DNADNA
DNA deoxyribonucleic acid EMR
EMREMR
EMR electromagnetic radiation g
gg
g gram
GC GCGC
GC gas chromatography HP
HPHP
HP Hewlett-Packard
IR IRIR
IR infrared
kg kgkg
kg kilogram
kPa kPakPa
kPa kilopascal L
LL
L litre
LIR LIRLIR
LIR logarithm of the inverse reflectance M
MM
M molar
MSD MSDMSD
MSD mass selective detector mA
mAmA
mA milliamps mg
mgmg
mg milligram
min minmin
min minute
ml mlml
ml millilitre MS
MSMS
MS mass spectrometry m/z
m/zm/z
m/z mass-to-charge ratio NIR
NIRNIR
NIR near infrared NIST
NISTNIST
NIST National Institute of Standards and Technology (USA) n
nn
n sample size
nm nmnm
nm nanometre
PC PCPC
PC personal computer (IBM compatible) PLSD
PLSDPLSD
PLSD probability of least significant difference psi
psipsi
psi pounds per square inch PVC
PVCPVC
PVC polyvinyl chloride PY/GC/FID
PY/GC/FIDPY/GC/FID
PY/GC/FID pyrolysis/gas chromatography/flame ionisation detection PY/GC/MS
PY/GC/MSPY/GC/MS
PY/GC/MS pyrolysis/gas chromatography/mass spectrometry R
RR
R2222 correlation coefficient
RSD RSDRSD
SD SDSD
SD standard deviation SGE
SGESGE
SGE Scientific Glass Engineering SPF
SPFSPF
SPF sun protection factor SSB
SSBSSB
SSB skin surface biopsy TIC
TICTIC
TIC total ion chromatogram UV
UVUV
UV ultraviolet UVA
UVAUVA
UVA ultraviolet A UVB
UVBUVB
UVB ultraviolet B UVC
UVCUVC
UVC ultraviolet C UVR
UVRUVR
UVR ultraviolet radiation v
vv
v volume
w ww
This thesis outlines the development of four new procedures (1) to synthesise melanins
reproducibly, (2) to objectively determine the degree of structural similarity between melanins (3) to use diffuse reflectance to objectively measure skin colour and (4) to evaluate the SPF of melanin and other sunscreen formulations using in vitro methods.
1) Reproducible synthesis of melanins
Melanins were synthesised from the precursors adrenaline, dopamine and DL-dopa under controlled conditions. The synthesis procedure outlined was simple and inexpensive and the variables were easily monitored and controlled. The method also allowed for the synthesis of multiple batches of melanin simultaneously in a reproducible fashion.
2) Characterisation of melanin
The synthesised melanins were characterised by objective comparison of pyrograms. This was achieved by conversion of the pyrograms to “pseudo-mass spectra” and objective comparison using NIST software that us readily and widely available for the comparison of mass spectra.
The method indicated that the melanin batches, synthesised by the methods outlined in this thesis and later analysed by the methods described, were synthesised in a reproducible manner.
3) Measurement of skin colour by diffuse reflectance
A commercially available spectrophotometer was modified to objectively characterise skin colour and changes in skin colour by the determination of the diffuse reflectance of the skin.
4) In vitro evaluation of topical sunscreens
The aim of this work was to develop an improved technique for the in vitro determination of SPF values of sunscreens. The method outlined differs from other in vitro techniques in that it utilises a standard spectrophotometer operated in a pseudo-double beam mode. The pseudo-double beam mode compared detector responses taken at different gains in single beam mode, and was used to increase the linear range of the spectrophotometer detector, allowing the measurement of SPF values greater than 30 which is difficult using standard in vitro techniques. In theory, SPF values greater than > 1000 could be measured by this method.
Summary SummarySummary Summary
Australia has the highest incidence of skin cancer in the world with almost
1000 cases of non-melanoma cancer per year in 1990. Melanoma rates in 1989
were 30.2 cases per 100,000 in men and 23.9 per 100,000 in women. Between
1960 and 1989, there was an average increase in melanoma mortality of 6.3 %
in men and 2.9 % in women [1-3]. While there are indications that mortality
rates from melanomas have decreased in recent years, it is still a significant
cause for concern [4].
As sun exposure is the principal cause of skin cancer [5-7], the use of
sunscreens, which act as UV filters to decrease the skin exposure to the sun,
would be expected to decrease skin cancer mortality. There is a body of
evidence to suggest that this hypothesis is true. However, controversy
surrounding the use of sunscreens has arisen for a number reasons; (1) the
unknown detrimental effects of the long term application of sunscreen
chemicals to the human skin, (2) the inability of some sunscreens to protect
against UVA radiation and (3) the lack of widely accepted testing methods
for sunscreen protection against UVA radiation and immunosuppression
and (4) (for the general public) from media coverage of controversial
interpretations of scientific studies [8-12].
Melanin is a natural polymer produced in the skin and is widely believed to
be the principal agent responsible for the prevention of ultraviolet damage
The widely believed significant role of natural melanin in protecting the skin
from damage due to solar radiation, and the clear link between the amount
of melanin in the skin and a reduced likelihood of skin cancer, indicate that
melanin may be an useful sunscreen agent. While, to the author’s
knowledge, there is as yet no widely available melanin containing sunscreen,
there have been number of patent applications in recent years [23-28],
suggesting that sunscreens containing melanin may eventually become
readily available.
As a result, there will be an increasing need for methods to synthesise
melanin in a reproducible fashion and for methods to test the effectiveness of
sunscreens containing melanin or other sunscreen agents.
This thesis outlines the development of four new procedures (1) to synthesise
melanins reproducibly, (2) to objectively determine the degree of structural
similarity between melanins (3) to use diffuse reflectance to objectively
measure skin colour and (4) to evaluate the SPF of melanin and other
sunscreen formulations using in vitro methods.
1) Reproducible synthesis of melanins
Melanins were synthesised from the precursors adrenaline, dopamine and
DL-dopa under controlled conditions. The dopamine and DL-dopa
syntheses relied on auto-oxidation while the formation of melanin from
adrenaline required light as a catalyst. The synthesis procedure outlined was
controlled. The method also allowed for the synthesis of multiple batches of
melanin simultaneously in a reproducible fashion.
2) Characterisation of melanin
The synthesised melanins were characterised by objective comparison of
pyrograms. This was achieved by conversion of the pyrograms to
“pseudo-mass spectra” and objective comparison using software commercially
available for the comparison of mass spectra.
The method could be used to differentiate between melanins produced from
different precursors on the basis of statistically significant differences
between their pyrograms. Conversely, no statistical differences between
pyrograms of different batches of melanins produced under the same
conditions from the same precursors could be detected. The analytical
technique in this study could be used in combination with other analytical
techniques to determine if the melanins synthesised by the methods outlined
in this thesis were reproducible. It could also form the basis of future studies
examining differences between melanins synthesised from the same
precursor but under different conditions.
3) Measurement of skin colour by diffuse reflectance
A commercially available spectrophotometer was modified to objectively
characterise skin colour and changes in skin colour by the determination of
spectrophotometer were compared with results obtained from a commercial
colour-measuring device.
This section of work was undertaken to provide a method for assessing the
ability of sunscreen formulations to adhere to the skin. As a melanin
containing sunscreen is likely to be brown, the ability of a formulation to
adhere to skin could be monitored by objectively measuring changes in the
skin colour as the product was washed or worn off the skin.
This device developed compares favourably with similar devices described
in the literature in terms of reproducibility and has the advantages of shorter
scan times and a higher resolution [17, 29-31]. It was simple to construct and
at about A$600 was approximately one tenth the cost of similar commercial
devices.
4) In vitro evaluation of topical sunscreens
The aim of this work was to develop an improved technique for the in vitro
determination of SPF values of sunscreens. The method described
determines the relative amount of UV light, at 5 nm intervals between 290
and 400 nm, that is transmitted through an applied layer of sunscreen and
calculates an in vitro SPF. This differs from other in vitro techniques in that it utilises a standard spectrophotometer operated in a pseudo-double beam
mode. The pseudo-double beam mode compared detector responses taken at
different gains in single beam mode and was used to increase the linear
The advantage of the pseudo-double beam mode, over the double beam
mode, was that it was many times more sensitive, allowing the measurement
of SPF values greater than 30. Evaluating products with SPF values greater
than 30 is difficult using standard in vitro techniques due to the large light intensity range that is required to be measured.
The substrates used in the in vitro SPF evaluations were human stratum corneum and Transpore surgical tape. The substrates were easily obtained
and the method was fast, simple and capable of measuring high SPF
sunscreens (>70). The value of this technique was subsequently
demonstrated when it correctly measured the SPF value of a commercially
available sunscreen that had been assigned an incorrect SPF value from
CHAPTER 1:
CHAPTER 1:
CHAPTER 1:
CHAPTER 1: BACKGROUND
BACKGROUND
BACKGROUND
BACKGROUND
S
SS
S
UNSCREENSUNSCREENSUNSCREENSUNSCREENSSunscreens were developed to prevent UVR induced damage . The first
reported use of sunscreens in the world was in 1928, in the United States
with the commercial introduction of an emulsion containing two sunscreen
chemicals, benzyl cinnamate and benzyl salicylate. In the early 1930s, a
product containing 10 % salol (phenyl salicylate) appeared on the Australian
market [32].
Sunscreen agents Sunscreen agentsSunscreen agents Sunscreen agents
Sunscreens can be broadly classified into physical blockers and chemical
absorbers [33]. The physical blockers include zinc oxide, titanium dioxide
and red petroleum. Physical blockers reflect or scatter incident radiation
across the UV, visible, and infrared part of the electromagnetic spectrum [33,
34]. Most of the chemical absorbing sunscreens belong to one of five
structural categories containing conjugated bonds; para-amino benzoates
(PABA), cinnamates, benzophenones, salicylates and dibenzoyl methanes,
see Table 1-1. These sunscreens absorb photons of UV radiation. They
release the energy gained by the photon thermally through vibrational
relaxation of the sunscreen molecule enabling it to absorb another photon of
UV radiation and repeat the process [34]. The PABA derivative sunscreens
cause a photoallergic response in 1-2 % of the population and are now not
Table 1-1: Structures and examples of the substances most commonly used in commercial sunscreen preparations [34, 35].
Category Structure Examples
UV
Absorption λ
λλ
λmax (nm)
Para amino benzoates
(PABA derivatives)
R2
R2
CO2R1
N
PABA
R1 = R2 =H 2-ethylhexyl-p
-dimethylaminobenzoate (Padimate O)
R1 = -CH2CH-C4H9
C2H5
R2 = –CH3
283-289 310
Cinnamates
O
OR
CH3O
2-ethylhexyl-p -methoxycinnamate (Parsol MCX)
R = -CH2CH-C4H9
C2H
2-ethoxyethyl-p -methoxycinnamate (Giv Tan F)
R = -C2H4-O-C2H5
310
310
Benzophenones O
OH CH3O
(2-hydroxy-4-methoxy)-benzophenone (oxybenzone) 288-290 & 325 Salicylates OH CO2R
Homomenthyl salicylate CH3 CH3 CH3 C H R = Octyl salicylate
R1 = -C8H17
309 310 Dibenzoylmethanes OH O R Avobenzone (Parsol 1789)
R = - C(CH3)3
4-isopropyl-dibenzoylmeythane
R = - CH(CH3)2
358
315
Sunscreen efficacy Sunscreen efficacySunscreen efficacy Sunscreen efficacy
[image:16.595.124.536.93.637.2]required to produce minimal erythema in sunscreen protected skin divided
by the duration of UV exposure required to produce erythema in skin that is
not protected by sunscreen. The determination of SPF values is covered in
more detail in Chapter 4.
By the Australian and New Zealand sunscreen standard a sunscreen can also
be classified as a broad-spectrum product if it can be demonstrated, by one of
the in vitro tests specified, to provide protection against UVA radiation [36]. The SPF of a sunscreen is a measure of how well a sunscreen can protect skin
from UV induced erythema (sunburn). However, it is not necessarily a
measure of how well a sunscreen prevents other forms of skin damage such
as wrinkling, solar keratoses, basal-cell and squamous-cell carcinomas and
melanomas.
Two recent studies have examined the beneficial effects of sunscreen
application in reducing UV induced photoaging in albino mice. One study
examined the benefits of a new sunscreen agent Mexoryl SX. Mexoryl SX
is a sunscreen which absorbs radiation between 290 and 400 nm with a single
peak at 345 nm. In comparison with age-matched controls changes in many
of the biochemical, histological and visible signs of photoaging were
significantly reduced with topical application of the sunscreen prior to UV
irradiation [37]. The other study using a low SPF sunscreen consisting of a
UVB screen (Parsol MCX; maximum absorbance at 310 nm) and a UVA
results. Compared to aged-matched non-irradiated controls, the skin of
irradiated mice was thickened and erythematous with coarse, rigid wrinkles
on the exposed areas. The UVB sunscreen reduced these effects, with a
decrease in skin-fold thickening. With the addition of the UVA sunscreen at
2% the visually assessed protection was enhanced, as the skin appeared
normal with no wrinkling or erythema [38].
Another study has shown that daily application of a broad-spectrum
sunscreen with an SPF of 17 during an Australian summer (September 1991
to March 1992) reduced the mean number of solar keratoses by 0.6. The
control group who applied base cream only had a mean increase of 1.0 in the
number of solar keratoses (difference, 1.53; 95 percent confidence interval,
0.81 to 2.25). The study also showed that the sunscreen group had fewer new
lesions (rate ratio, 0.62; 95 percent confidence interval, 0.54 to 0.71) and more
remissions (odds ratio, 1.53; 95 percent confidence interval, 1.29 to 1.80) than
the base-cream group . While solar keratoses are not cancerous they are a
risk factor for basal-cell carcinoma and a precursor of squamous-cell
carcinoma (although the rate of malignant transformation is low) [39].
Damage to DNA is believed to be one of the principal etiological factors in
the formation of skin cancer. Topical application of sunscreens has been
shown both in vitro and in vivo to reduce DNA damage from UV radiation [40-42]. The immune system is believed to play a key role in preventing or
sunscreens has been shown to decrease UV induced immunosuppression of
the skin both in vitro and in vivo [11, 43, 44].
Animal studies have demonstrated that UVB sunscreening agents can protect
against the development of UV-induced nonmelanoma skin tumours [43].
Furthermore, analysis of skin cancer mortality in Australia for 1990 – 1994
showed a distinct reduction in the rate of increase for men (5.00 per 100 000
person years, an increase of 3.7 %) and a small fall in mortality for women
(2.38 per 100 000, a decrease of 5.2 %) [4]. The analysis also showed a
decrease in mortality for the younger age group (those born after 1950). Early
detection could partly explain this trend. However, as the mortality rate
correlates better to year of birth than year of death this would be more
consistent with a changing pattern of sun exposure [4].
The changing pattern of sun exposure, and corresponding changes in
mortality, may be due to the major national education campaigns started in
the 1980’s by the Australian government. The campaigns encouraged the
early detection and prevention of skin cancer and the use of sunscreens [1].
This campaign is still ongoing.
Skin types Skin typesSkin types Skin types
The colour of a person and/or their ability to tan is often used as a measure
of how reactive the skin is to UV radiation. The sun-reactive skin typing was
psoriasis with oral methoxsalen. Skin typing is also widely used as a
measure of sunburn sensitivity. A number of studies and standards classify
skin types from I to VI based on the criteria in Table 1-2 [18, 36, 44].
Table 1-2: Sun-reactive skin types adapted from Fitzpatrick 1988, the Australian/New Zealand standard AS/NZS 2604:1997 and Cripps 1981 [18, 36, 44]
Skin Colour Skin ColourSkin Colour Skin Colour (unexposed skin) (unexposed skin) (unexposed skin) (unexposed skin) Skin Skin Skin Skin Type Type Type
Type Erythema and tanning reactionsErythema and tanning reactions Erythema and tanning reactionsErythema and tanning reactions ExamplesExamplesExamplesExamples
I Always burn, never tan Redhead, freckled, Irish-Scots II Always burns easily and tans
minimally
Fair-skinned, fair-haired, blue-eyed Caucasians III Burns moderately and tans
gradually (to a light brown)
Darker Caucasians White
IV Burns minimally, always tans (to a moderate brown)
Mediterranean type Caucasians
Brown V Rarely burns, tans profusely (to a
dark-brown)
Mid-Eastern, some Latin American types
Black VI Never burns, deeply pigmented Black skinned Negroids
Sun Protection Factor and skin types Sun Protection Factor and skin typesSun Protection Factor and skin types Sun Protection Factor and skin types
In order to assess the degree of protection each skin type has in relation to a
conventional sunscreen, Cripps (1981) determined the SPF of each skin type.
Using skin type I one as a baseline having an SPF of 1.0, type II had an SPF of
1.67, type III an SPF of 2.5, types IV-V had an SPF of nearly 4, whereas the
darker Negroid skin (type VI) had an SPF of 9.68 or nearly 10 times that of
CHAPTER 2:
CHAPTER 2:
CHAPTER 2:
CHAPTER 2: SYNTHESIS OF MELANIN
SYNTHESIS OF MELANIN
SYNTHESIS OF MELANIN
SYNTHESIS OF MELANINS
SS
S
B
B
B
B
ACKGROUNDACKGROUNDACKGROUNDACKGROUNDMelanin Melanin Melanin Melanin
The term "melanin" (Gr. melas = black) denotes a “complex polymeric, amorphous pigment of biological origin, that is usually dark in colour” [45].
Melanins are found across the plant and animal kingdom [21, 46-50]. Few
naturally occurring pigments command more widespread interest than
melanins [22]. There are many different types of melanins. They are
subdivided on the bases of chemical structure or the tissue or species from
which they originate. As eumelanin is the melanin that provides
photoprotection in the skin of humans it will be discussed here. Reviews on
the origins, nature and chemical structure of the various other melanins can
be found elsewhere [20 , 22].
Eumelanins are nitrogen containing, dark brown and black pigments. They
are practically insoluble in all solvents and arise by the oxidative
polymerisation of 5,6-dihydroxindole and 5,6-dihydroxyindole-2- carboxylic
acid, derived biosynthetically from tyrosine via dopa (see Figure2-1, for the
structure of these compounds) [[22, 51]. Eumelanins usually occur bound to
Pigment content and protection against UV damage Pigment content and protection against UV damagePigment content and protection against UV damage Pigment content and protection against UV damage
While melanin is not the only line of defence against UV induced damage to
skin, it is generally well accepted that black and brown skin is well-protected
against UV induced inflammation and degradation. It is also well accepted
that a person’s skin colour and/or ability to tan is a major determining factor
in the development of skin cancers [16, 19, 52-55].
Melanoma is primarily a disease of lightly pigmented individuals. In India, a
country with the majority of the population belonging to skin types IV and
V, the incidence of melanoma has been estimated at approximately 0.2 cases
per 100,000. Conversely, in Australia the melanoma incidence in a
population of predominantly skin types I to III at an equivalent
subequatorial latitude has been estimated at around 30 cases per 100,000
people, a 150-fold greater incidence [8, 56].
Other factors involved in protecting the skin from UV induced damage
include: the thickness of the stratum corneum (contains UVB absorbing
amino-acids), the formation and accumulation of urocanic acid with its
ability to undergo cis-trans isomerisation and oxidation, the presence of
other pigments such as b-carotene and the enzyme systems which repair UV
Photoprotection of melanin Photoprotection of melanin Photoprotection of melanin
Photoprotection of melanin –––– mode of action mode of action mode of action mode of action
Melanin, unlike conventional sunscreens absorbs broadly across the UVB,
UVA and visible parts of the electromagnetic spectrum [35, 57]. Melanin is
also unique in that it acts both as a chemical sunscreen blocker and a physical
sunscreen blocker. As a chemical sunscreen blocker melanin absorbs
electromagnetic radiant energy and subsequently dissipates the energy as
heat, in a similar fashion to conventional sunscreen chemical blockers. As a
physical sunscreen blocker melanin scatters impinging radiation away from
the skin’s surface reducing the amount of light penetrating into the skin
layers. Furthermore, melanin has the ability to act as a free radical scavenger
for minimising the harmful effects of other free radicals generated by UV
radiation [52, 58].
Synthesis of melanins Synthesis of melanins Synthesis of melanins Synthesis of melanins
Synthetic melanins can be prepared by:
• incubation of one or more monomeric precursors with an enzyme (eg.
mushroom polyphenol-oxidase) in a buffered solution. Some
commonly used monomeric precursors are shown in Figure 2-1.
• passing air through a buffered solution of one or more of the
monomeric precursors. Some precursors can also undergo oxidation
in solution with the aeration caused by stirring alone (autoxidation)
• Oxidation of one or more of the monomeric precursors with oxidising
agents such as persulphate, peroxide or potassium iodide [20, 26, 54].
Table 2-1 outlines some studies using various precursors and methods of
HO N H HO HO COOH NH2 HO HO COOH NH2 HO N H HO COOH H HO N H HO COOH H -O N+ O CH3 OH HO N HO CH3 O Dopa Tyrosine 5,6-Dihydroxyindole-2-carboxylic acid
HO NH2
HO
HO HO
HO
H
N CH3
5,6-Dihydroxyindole Adrenochrome Dopamine 5,6-Dihydroxyindole-2-carboxylic acid Adrenaline Adrenolutin HO HO HO H
N CH3
CH3
[image:25.595.125.547.67.605.2]Ephedrine
Table 2-1: Summary of studies on the synthesis of melanins.
Melanin Precursor/Type Method Agent/Source Reference
5,6-Dihidroxyindole enzymatic tyrosinase [51]
5,6-Dihidroxyindole-2-carboxilic acid
enzymatic tyrosinase [51]
Adrenolutin auto-oxidation air [60]
Catechol auto-oxidation air [59]
Dopa enzymatic mushroom tyrosinase [61]
Dopa auto-oxidation air/agitation [59]
Dopa & Cys-dopa; 5-S-cysteinyldopa, varying %’s
enzymatic mushroom tyrosinase [62]
Dopamine auto-oxidation air/agitation [59] Adrenaline photochemical UV-Vis Light [63]
Adrenaline auto-oxidation air [60]
Hair extraction human/animal hair [64, 65] Melanoma extraction Fortner malignant melanoma [66] Neuromlanin extraction human midbrain / substantia nigra [67] Noradrenaline auto-oxidation air/agitation [59] Sepia extraction Sepia officinalis [68, 69] Seretonin auto-oxidation air/agitation [59] Tryptophan Chemical
oxidation
formic acid [70]
Tyrosine oxidation horseradish peroxidase / mushroom tyrosinase
[71, 72]
Development of synthetic procedure Development of synthetic procedureDevelopment of synthetic procedure Development of synthetic procedure
Auto-oxidative methods of melanin synthesis were used for this study due to
the high cost, difficult extraction procedures, variable activity and instability
Initial synthesis of melanins involved passing compressed air at a known
rate through a buffered aqueous solution of dopamine.
A number of sources of compressed air were investigated. Air from a piston
driven compressor was found to contaminate the solution with oil. An
activated charcoal filter was used to try to eliminate the oil residue from the
air but it was found that the filter could not remove all oil residues. Use of
commercially available cylinders of high purity compressed air, free of oil
and particulate matter, was prohibitively expensive. No visible oil residues
were found in solutions aerated by rubber diaphragm pumps and these were
subsequently used as ready sources of compressed air.
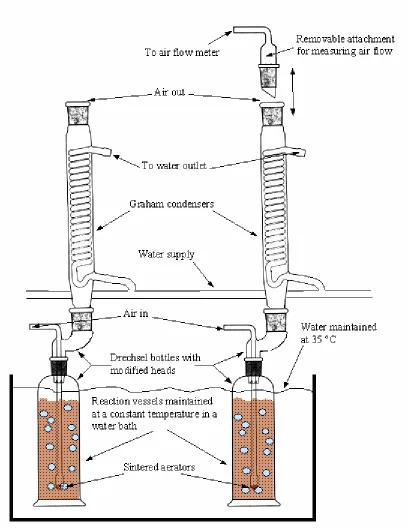
A number of reaction vessel designs were investigated. Vessels open to the
atmosphere were found to be unsuitable because of loss of water by
evaporation when maintained at elevated temperatures for extended periods.
The reaction vessel finally adopted consisted of a Drechsel bottle with a
sintered-glass aerator head and condenser. The airflow through the sintered
aerator provided sufficient agitation to ensure adequate mixing of the
Drechsel bottle contents.
P
P
P
P
REPARATION OF MELANIREPARATION OF MELANIREPARATION OF MELANIREPARATION OF MELANINSNSNSNSAim
The aim of this study was to develop a method for synthesising melanins
monitored and allow for the simultaneous production of multiple batches of
melanins.
Materials and Methods
Melanin precursors
Sepia melanin, DL-dopa, dopamine and adrenaline were all purchased from
Sigma Aldrich Pty Ltd (Australia). All were of analytical grade.
Melanin Synthesis
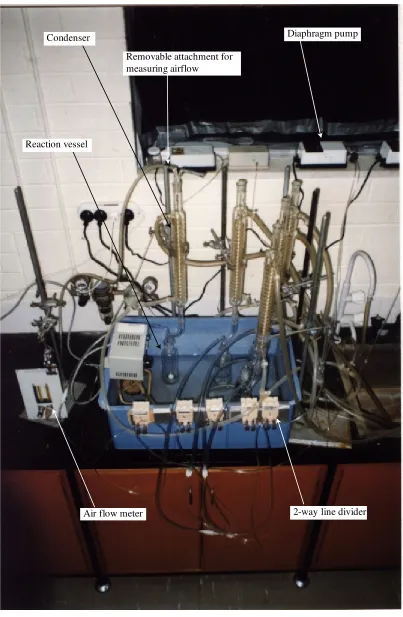
Each reaction vessel consisted of a modified Drechsel bottle (250 ml) fitted
with a modified head, containing a sintered aerator of porosity grade 0 and a
30 cm Quickfit Graham condenser. Air was supplied by diaphragm pump.
Airflow was regulated by a two-way line divider and measured with a gas
flow meter.
Five such reaction vessels were connected in series to allow the simultaneous
synthesis of five batches of melanin under the same conditions. The
Diaphragm pump
2-way line divider Air flow meter
Removable attachment for measuring airflow
Condenser
[image:30.595.129.532.80.697.2]Reaction vessel
Periodic measurements of the rate of airflow for each reaction vessel and the
water bath temperature were recorded manually.
Batches of dopamine, DL-dopa and adrenaline melanin were synthesised in
lots of five.
Dopamine, DL-dopa melanin
Conditions for the synthesis of dopamine and DL-dopa melanin were
adapted from that used by Crescenzi [61] and Swan [20].
Dopamine and DL-dopa solutions (0.05 M, adjusted to 200 ml with
Sorensen's Phosphate Buffer (0.067 M; pH 8.4)) were refluxed at 35 °C for
three days. Air at a flow rate of 1.6 L/min perfused the solutions for the
duration of the synthesis.
The volume of each reaction mixture at the end of three days was recorded.
Each solution was filtered with a 0.45 micron hydrophilic filter. The solid
residue was then dried in an oven at 37 °C for three days. The weight of the
residue at the end of the three days was recorded. The residue and filtrate
from each sample were stored at -18 °C until required for analysis.
As there was negligible residue after filtering the DL-dopa melanin solution
the filtrate was evaporated to dryness with a rotary evaporator and the
Adrenaline melanin
The procedure for the synthesis of adrenaline melanin was adapted from that
used by Chirila et al [63]. For each vessel adrenaline (1.83 g) was dissolved in 3.6 % HCl (50 mL). Forty five mL of a 2 % ammonia solution was then
added and adjusted to 195 mL with Sorensen's Phosphate Buffer (0.201 M;
pH 7.3). Air at a flow rate of 1.6 L/min perfused the solutions for three days.
The reaction solution was maintained at 35 °C.
The polymerisation of adrenaline to melanin was catalysed by light. Two
75 W tungsten filament bulbs were placed 30 cm above the water bath
containing the five reaction vessels.
The volume of each reaction mixture at the end of three days was recorded.
Each solution was filtered through a 0.45 micron hydrophilic filter. The
residue was then dried in an oven at 37 °C for three days. The weight of the
residue at the end of the three days was recorded. The residue and filtrate
from each sample were stored at -18 °C until required for analysis.
Results
- 1
8
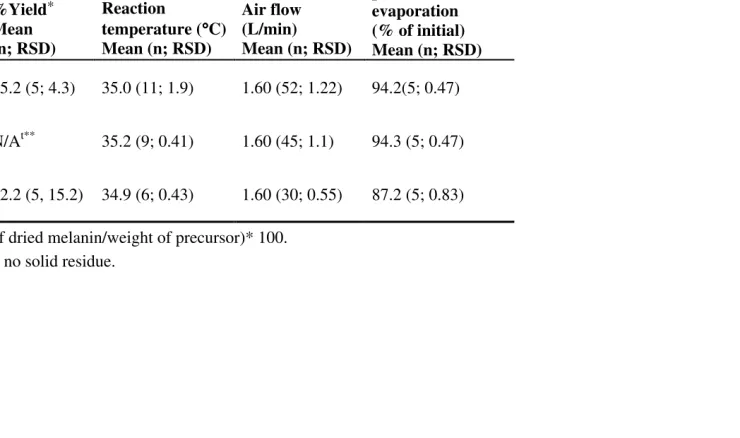
-Table 2-2: Percentage yields and reaction variables for the synthesis of melanins.
Experimental variables
Precursor %Yield* Mean (n; RSD)
Reaction
temperature (°°°°C) Mean (n; RSD)
Air flow (L/min)
Mean (n; RSD)
Reaction volume, prior to filtration / evaporation
(% of initial) Mean (n; RSD)
Dopamine 45.2 (5; 4.3) 35.0 (11; 1.9) 1.60 (52; 1.22) 94.2(5; 0.47)
DL-Dopa N/At** 35.2 (9; 0.41) 1.60 (45; 1.1) 94.3 (5; 0.47)
Adrenaline 42.2 (5, 15.2) 34.9 (6; 0.43) 1.60 (30; 0.55) 87.2 (5; 0.83)
[image:33.595.225.686.146.365.2]Discussion
Although the apparatus was simple in design and construction, a number of
design factors were considered. These included the supply, adjustment and
measurement of airflow and the water flow to the condensers.
A separate diaphragm pump supplied air to each reaction vessel. Individual
pumps allowed for the separate control of the airflow to each reaction vessel.
When a single pump supplied air to multiple vessels, changing the airflow to
one vessel unavoidably changed the airflow to other vessels, due to changes
in the flow resistance of the system. While it is possible to use mass flow
controllers to overcome this problem this is relatively expensive when
compared with using individual pumps and two-way line dividers.
Controlling airflow with two-way line dividers had two advantages. With
ordinary restriction valves, reducing the diameter of the air path reduces the
airflow but also increases the back pressure on the pump. A two-way line
divider has two restriction valves both supplied by the one air inlet. To
decrease the airflow to a reaction vessel the second restriction could be
opened to atmosphere, consequently reducing airflow through the other
restriction valve without increasing the back pressure on the pump. The
ability to control the airflow to the reaction vessels with two restriction
valves also allowed for finer adjustment of airflow.
removed from each condenser quickly and easily. This meant that only one
flow meter was required to take measurements from the five reaction vessels.
Requiring only one flow meter reduced the cost of the apparatus.
Furthermore, any variability in flow rates from the reaction vessels could not
then be attributed to differences in the measuring apparatus.
There were limitations with the air supply. In this procedure, there was no
means of removing chemical residue from the air. As melanin binds to many
chemicals [75-78] it may prove necessary, in the future, to remove chemical
and particulate residue from the air prior to introduction into the reaction
chamber. This could be achieved with the use of an appropriate filter eg. a
charcoal filter.
In this study the condensers were connected in parallel, with the water inlet
to the condensers forming an unbroken loop, see Figure 2-2 and Figure 2-3.
Alternatively, the output and inputs of the condensers could have been
connected in series. The advantage of connecting the condensers in series
would have been that the flow rate through each condenser would be equal.
However, as the water passes through each condenser the water temperature
would rise, resulting in less efficient heat exchange between the water
vapour and the condensing coils. With the condensers connected in parallel
the water temperature passing through each condenser is equal but the flow
rate potentially different, due to minor differences in the condensers and
tubing. Using PVC tubing of equal diameter and lengths between
choice between the two arrangements was arbitrary. On a larger scale, the
differences between the two methods would be more pronounced and the
flow rate and water temperature through the condensers would need to be
monitored and controlled.
The yield of dopamine melanin was significantly higher than DL-dopa and
adrenaline melanin. Initial melanin synthesis was done with dopamine as
the precursor. Therefore, the conditions for melanin synthesis were
optimised for the synthesis of dopamine melanin.
There have been many studies concerned with factors affecting the kinetics
of melanin synthesis, such as the influence of pH [51] and the presence or
absence of metal ions [60, 79, 80]. The conditions in this study were kept as
simple as possible. However, if necessary, various synthesis conditions
could be tried simultaneously to determine optimum synthesis conditions or
the influences that these conditions have on the kinetic pathways of melanin
synthesis.
The synthesis procedure outlined was simple and inexpensive and the
variables were easily monitored and controlled. This method also allowed
for the synthesis of multiple batches of melanin simultaneously in a
reproducible fashion. If necessary, synthesis conditions could be easily
modified to produce melanins of different types or higher yields through the
CHAPTER 3:
CHAPTER 3:
CHAPTER 3:
CHAPTER 3: CHARACTERISATION OF
CHARACTERISATION OF
CHARACTERISATION OF
CHARACTERISATION OF
MELANINS
MELANINS
MELANINS
MELANINS
B
B
B
B
ACKGROUNDACKGROUNDACKGROUNDACKGROUNDMelanins have a complex, heterogeneous, polymeric structure, making them
difficult to characterise. Many techniques have been tried previously:
ultraviolet/visible/IR spectroscopy; nuclear magnetic resonance, electron
paramagnetic resonance spectroscopy, photoacoustic phase angle
spectroscopy, X-Ray diffraction, laser desorption, PY/GC/FID and
PY/GC/MS [67, 69, 78, 81-94].
This chapter details the use of PY/GC/MS and the NIST mass spectral
search program for the analysis of melanins, to distinguish between melanins
synthesised from different precursors and as a possible means of
determining if synthesis is reproducible. The batches of melanins
synthesised by the techniques outlined in Chapter 2 were analysed by the
method described in this chapter. Due to the complex nature of the structure
of melanins it is unlikely a single technique would be sufficient to determine
if melanin synthesis was reproducible.
Overview of analysis methods Overview of analysis methodsOverview of analysis methods Overview of analysis methods
Background to pyrolysis
Pyrolysis chromatography is useful for the analysis of large molecules and
chromatography involves the breakdown of compounds by heat into a series
of volatile products which are subsequently introduced into a gas
chromatograph. The volatile products are characteristic of both the sample
and the experimental conditions. There are three principle types of pyrolysis
units for gas chromatographs;
1) The filament pyrolyser
A filament type pyrolyser is resistively heated. Samples are generally placed
directly onto a filament or crucible prior to heating. The filament is
contained within a chamber with a low dead volume through which carrier
gas flows see (Figure 3-1).
2) The Curie-point pyrolyser
This consists of a ferromagnetic wire on which the sample to be analysed is
placed. The wire is heated inductively by placing it in a radio frequency
field. The final temperature of a Curie-point pyrolyser depends on the
composition of the ferromagnetic material. The ferromagnetic wire, with the
sample to be analysed, is centred in a quartz tube which is connected to the
inlet of a gas chromatograph and through which the carrier gas flows (see
Figure 3-1).
3) The furnace pyrolyser
injected into the heated quartz tube and the volatile decomposition products
are passed onto the column by a carrier gas passing through the pyrolysis
Sample placed here
A B
Power cables
Septum Transfer tube Graphite
ferrule
Instrument injector port Furnace assy
Heat shield Septum
Purge “P” Carrier
Inlet “C”
Quartz transfer tube Sample deposited by plunger/needle Syringe plunger/needle
[image:40.595.130.457.81.675.2]C
The pyrolysis products generated from the three types of pyrolysers are often
different. This is due not only to the structural differences between the
pyrolysers but to the manner in which the samples are heated. With filament
and Curie-point pyrolysers, the sample is in intimate contact with the heating
source. Once the sample starts to pyrolyse the pyrolysis products will be
carried to relatively cooler regions of the pyrolysis chamber by the carrier gas
flow. This reduces the formation of secondary pyrolysis products. However,
with the furnace-type pyrolyser, as the sample is placed on a plunger it is
supported away from the walls, which serve as the primary heat source for
the pyrolysis process. As pyrolysis products form, they are carried by the
carrier gas from a relatively cool region (the sample support) to hotter
regions closer to the heated walls. This increases the probability of
secondary pyrolysis products forming. Therefore, the extent of formation of
secondary products in a furnace-type pyrolyser is more dependent on the
residence time than Curie-point or filament type pyrolysers.
Reproducibility can be poor, not only from one type of pyrolyser to another
but also between pyrolysers of the same type. Minor differences in the
furnace temperature, sample preparation/introduction and chromatography
parameters all contribute to poor reproducibility between pyrolysers of the
Interpretation of pyrolysis results Interpretation of pyrolysis resultsInterpretation of pyrolysis results Interpretation of pyrolysis results
Due to the large number of products generated by the pyrolytic process the
chromatograms created are very difficult to interpret and compare. Factors
affecting the reproducibility of melanin pyrolysis chromatograms
(pyrograms) for comparative purposes include; difficulty in identifying
specific peaks in different chromatograms, slight variations in elution times
resulting in apparently different peak areas due to a variation in the
coelution of two or more peaks and difficulty in differentiating peaks arising
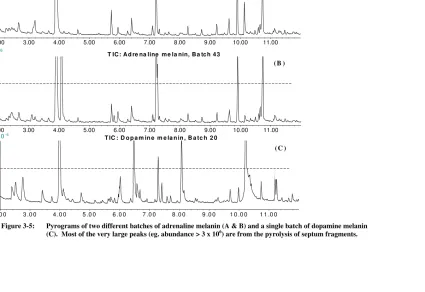
from the pyrolysis of melanins from those peaks arising from the pyrolysis of
septum fragments unavoidably introduced during sample injection.
These problems can largely be overcome or minimised with the use of a
MSD. By monitoring specific target ions it is possible to identify particular
peaks in different chromatograms and co-eluting peaks can also be identified
and quantified. Similarly, peaks arising from the pyrolysis of
silicon-containing septum fragments can be identified and excluded for the
purposes of comparison.
Statistical methods and pattern recognition techniques have been used for
the comparison of complex variables [98-103], for the comparison of
pyrograms [97, 104] including comparison of melanin pyrograms [78, 84, 93].
In the same way that a mass spectrum can be represented as a row vector
composed of peak intensities (ion abundances) ordered along an axis
vector of peak intensities (detector response) ordered along an axis (retention
time).
The National Institute of Standards and Technology (NIST; United States of
America) mass spectral search program has been used widely as an objective
measure of the degree of similarity between mass spectra of different
compounds.
It should therefore be possible to utilise the NIST program to objectively
compare chromatograms by converting them into “pseudo-mass spectra”.
Because of the wide use and acceptance of the NIST program, this method
was chosen to compare the chromatograms created from the pyrolysis of
melanins.
The NIST program imports the mass spectrum of a particular compound as a
table of values of mass to charge ratio (m/z) and their corresponding
abundance values. The program then compares the table with other tables in
a library, and objectively determines the degree of similarity, which is then
represented as both direct and reverse match factors. The program then
generates from its library a list of compounds in a decreasing order of the
degree of similarity, as represented by the generated match factors.
The match factors are integers ranging from 0 to 1000, with the higher
numbers indicating a closer match. The direct match factor is obtained from
the comparison of the unknown and the library spectrum. The reverse match
spectrum ignoring any peaks in the unknown spectrum that are not in the
library spectrum [105].
Development language software supplied with the mass spectrometer was
used in this study and allowed almost complete automation of the analysis of
the pyrolysis data. The details of the process are outlined below in the
experimental procedure for the pyrolysis of melanins.
P
P
P
P
YROLYSIS ANALYSIS OFYROLYSIS ANALYSIS OFYROLYSIS ANALYSIS OFYROLYSIS ANALYSIS OF MELANINS MELANINS MELANINS MELANINSAim
The aim of this section of the work was to examine the use of the PY/GC/MS
and the NIST mass spectral search program for the characterisation of
melanins, to distinguish melanins synthesised from different precursors and
as a possible means of determining if synthesis was reproducible.
Materials and Methods
Melanins
Five batches of each of DL-dopa melanin, dopamine melanin, and adrenaline
melanin were synthesised from their respective precursors as described in
Chapter 2. Sepia melanin was purchased from Sigma Aldrich Pty Ltd
PY/GC/MS
The pyrolysis unit was an SGE (Australia) Pyrojector furnace-type pyrolyser.
The unit was connected to a Hewlett-Packard (HP) 5890 gas chromatograph
equipped with a HP 5970 MSD. Data was collected using a PC with HP
G1034C data acquisition program. The carrier gas was helium. A 29 m, BP-1
column with an internal diameter of 0.25 µm was used for chromatographic
separation.
The syringes used were;
i) a 1 µL plunger-in-needle syringe with a 70 mm cone-tipped
needle, with the plunger abraded with a jewellers cloth to
prevent the binding of the plunger to the needle at pyrolysis
temperatures
ii) a solids injector with a spiral needle (SGE; Australia).
The pyrolysis unit was maintained at a constant temperature of 850°C. The
head pressure in the pyrolysis unit was adjusted to exceed the injector head
pressure of the gas chromatograph so that a split flow of 10-12 ml/min was
obtained.
The injector head pressure was 15 psi at 250°C with the detector at 290°C.
The oven temperature program consisted of a 2 minute isothermal period at
Blank injections indicated that no residual compounds from previous runs
were detected by the analysis system.
A Sanophone® ultrasonic bath (IMBROS Scientific; Australia) was used to
suspend melanin particles in methanol and clean syringes between runs.
Sepia & dopamine melanin
Separate suspensions of sepia & dopamine melanin (250 mg/ml) in methanol
were sonicated for approximately 30 seconds. Immediately following
sonication 1 µL of the suspension was drawn up in a plunger-in-needle
syringe and injected.
Adrenaline & DL-dopa melanin
Suspensions of DL-dopa melanin (500 mg/ml) and adrenaline
(165 - 250 mg/ml*) in methanol were sonicated for 30 seconds in an
ultrasonic bath then vortexed for 30 sec. A 10 µL aliquot of the solution was
then spread evenly over the spiral
plunger of the solids injector. This was achieved by placing a small droplet
of the 10 µL aliquot on the spiral plunger, moving the syringe in a rocking
motion. The droplet moved over the spiral plunger leaving an even film of
melanin over the surface as the methanol evaporated. This procedure was
repeated until all of the 10 µL aliquot was deposited over the plunger
surface. The outer sheath of the spiral plunger was slid over the plunger.
The solids injector was then ready to be inserted into the pyrolysis unit.
Reproducibility studies
To measure the within-day variability of the method, dopamine melanin
from the same batch was analysed by PY/GC/MS five times within the same
day. To measure the inter-day variability method, dopamine melanin from
the same batch was analysed by PY/GC/MS on five different days.
Analysis of pyrograms
The NIST mass spectra search program was used as a means of objectively
determining the degree of similarity between chromatograms arising from
the pyrolysis of the same and different types of melanins.
Custom comparison software was written (Appendix 1-1) to automate the
process of;
1. identifying and recording a pyrogram as a table of retention times
versus peak abundances and then,
2. converting the table into a pseudo-mass spectral table of pseudo
m/z ratios and abundances that could be analysed by the NIST
mass spectral search program.
The software was written in the development language supplied as part of
the Hewlett Packard integration module.
There were three main processes involved in the analysis of pyrograms.
1. The determination of parameters required by the comparison
software to identify peaks within a TIC pyrogram (see Figure 3-2).
2. Converting pyrograms into pseudo-mass spectra (see Figure 3-3).
3. Using the NIST mass spectral search program to compare the
resulting pseudo-mass spectra (see Figure3-4).
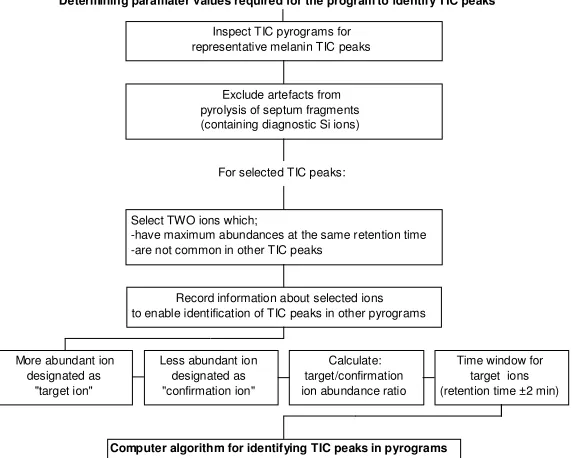
Determination of parameter values for comparison software to identify TIC peaks
To acquire information that would be used by the software to compare
pyrograms, TIC peaks were selected and data required for the later
identification of these peaks was recorded. TIC peaks were selected by a
systematic manual search of pyrograms from different types of melanin. The
basic criteria for the selection of TIC peaks within pyrograms were:
• TIC peaks had to originate from pyrolysis of melanin and not as
artefacts from pyrolysis of the septum. This distinction was achieved
by manual inspection and exclusion of all TIC peaks showing mass
spectral evidence of the presence of silicon, such as typical silicon ion
• TIC peaks had to chromatograph well as indicated by the shape,
width and degree of tailing of the peak,
• TIC peaks had to be of sufficient intensity for reliable quantitation of
peak area, evaluated visually by a favourable signal to noise ratio,
• TIC peaks had to be sufficiently resolved from large artefact peaks
which may have distorted the mass spectrum of the TIC peak of
interest.
As each TIC peak satisfying these criteria was identified, two ions from the
mass spectrum of that peak were selected. Criteria for the selection of the
two ions were;
• The ions originated from the same TIC peak. This was demonstrated
by the abundances of the two ions showing identical time courses
when plotted together,
• The ions were major contributors to the overall TIC peak intensity as
determined by visual inspection of the mass spectrum of the TIC peak,
• The ions selected were not common ions found in many other
pyrogram TIC peaks. This was verified by plotting the abundance
time course of the selected ions,
• The more intense of the two ions was designated as the target ion and
For the two ions selected the parameters required by the comparison
software for identifying TIC peaks were recorded:
• The target ion (m/z),
• The confirmation ion (m/z),
• The ratio of target/confirmation ion abundances,
• The time window of the TIC peak, ie. retention time of the target ion
± 2 minutes.
Information relating to the 38 peaks selected from the melanin pyrograms
examined by applying these criteria was entered into the software. The
Computer algorithm for identifying TIC peaks in pyrograms
For selected TIC peaks:
More abundant ion designated as
"target ion"
Less abundant ion designated as "confirmation ion"
Calculate: target/confirmation ion abundance ratio
Time window for target ions (retention time ±2 min) Record information about selected ions
to enable identification of TIC peaks in other pyrograms Select TWO ions which;
-have maximum abundances at the same retention time -are not common in other TIC peaks
Exclude artefacts from pyrolysis of septum fragments (containing diagnostic Si ions) Inspect TIC pyrograms for representative melanin TIC peaks
[image:51.595.129.415.86.315.2]Determining paramater values required for the program to identify TIC peaks
Figure 3-2: Flow diagram for the determination of parameter values for the identification of TIC peaks within pyrograms.
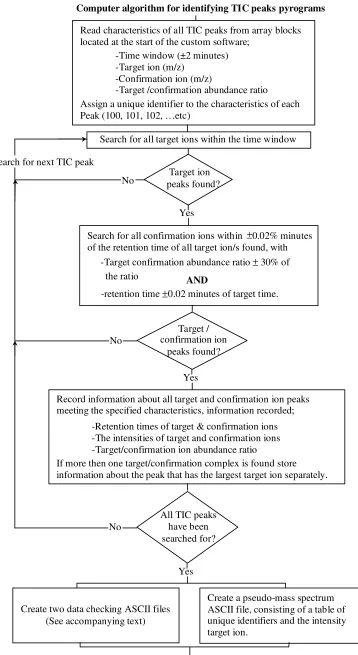
Algorithm for identifying TIC peaks within a pyrogram & converting pyrograms into pseudo-mass spectrums
The parameter values required (described above) to identify TIC peaks
within pyrograms were entered into the comparison software in the form of
one dimensional arrays at the start of the program (see Appendix 1-1). Each
set of parameter values was assigned a unique identifier which was an
integer starting at 100 and increasing in steps of 1.
Figure 3-3 describes the process by which the comparison software identified
TIC peaks based on the parameter values defined in the array blocks.
The three ASCII files generated by the software were:
ASCII file (1) (1) (1) (1) The pseudo-mass spectrum ASCII file, analogous in
table of unique identifiers and associated target ion
abundances. The table was ordered from lowest to highest
unique identifier. If there was more than one
target/confirmation complex found for a set of parameter
values, then the largest target ion intensity was used in the
pseudo-mass spectrum file.
ASCII file (2)(2)(2)(2) An error checking ASCII file consisting of a table of unique
identifiers and associated target ion abundances and the
retention time of the target ion (described later).
ASCII file (3)(3)(3)(3) A second error checking ASCII file contained information
relating to any peak that met all the criteria required for the
identification of a peak. This ASCII file consisted of a table
of unique identifier, target ion, confirmation ion, the start
and end time of the 4 minute time window of the target ion,
the abundance of the target ion, retention time of the target
ion, the expected target/confirmation ratio and the
Target / confirmation ion
peaks found?
Search for all confirmation ions within ±0.02% minutes of the retention time of all target ion/s found, with
-Target confirmation abundance ratio ± 30% of
the ratio AND
-retention time ±0.02 minutes of target time. retention
Read characteristics of all TIC peaks from array blocks located at the start of the custom software;
-Time window (±2 minutes) -Target ion (m/z)
-Confirmation ion (m/z)
-Target /confirmation abundance ratio Assign a unique identifier to the characteristics of each Peak (100, 101, 102, …etc)
Search for all target ions within the time window
Target ion peaks found?
Yes
Record information about all target and confirmation ion peaks meeting the specified characteristics, information recorded;
-Retention times of target & confirmation ions -The intensities of target and confirmation ions -Target/confirmation ion abundance ratio
If more then one target/confirmation complex is found store information about the peak that has the largest target ion separately.
All TIC peaks have been searched for?
Yes
Create two data checking ASCII files (See accompanying text)
Create a pseudo-mass spectrum ASCII file, consisting of a table of unique identifiers and the intensity target ion.
Yes No
No
No Search for next TIC peak
[image:53.595.142.500.69.724.2]NIST mass spectral search program for the comparison of pyrograms Computer algorithm for identifying TIC peaks pyrograms
Error checking
Due to the large number of products generated during the pyrolysis of
melanin , it was possible that a number of peaks satisfying the selection
criteria would be found in any 4 minute time window. As there was a
possibility of an incorrect TIC peak selection by the software, methods for the
identification of such errors were developed.
Importation of ASCII file (2) (2) (2) (2) into Microsoft Excel allowed the percentage
area of each target ion intensity, relative to the area of all the target ion
intensities for that sample, to be calculated. For each type of melanin and the
within-day and inter-day variation studies, the RSD for the percentage target
ion intensities and the average target ion intensities were calculated. The
average target ion intensities calculated were later reformatted to create
average pseudo-mass spectra used for NIST chromatogram comparison (see
below).
The custom software searched for TIC peaks in order of the retention times of
the TIC peaks it was designed to detect. By visual inspection of the column
of retention times of ASCII file (2)(2)(2)(2), any retention time that was out of
sequence indicated the mis-identification of a TIC peak. High RSD values
for the percentage target ion intensities could also indicate an error.
Inspection of the individual percentage target ion intensities could indicate
the source of variation. If a mis-identification was thought to have been
parameters and the pyrogram and TIC peak/s visually examined to
determine if an error had been made.
Importation of data into NIST program
ASCII files (1)(1)(1) created by the comparison software were formatted as NIST (1)
mass spectrum tables so that it was possible to import them directly into the
NIST mass spectral search program.
NIST chromatogram comparison
The average pseudo-mass spectra, created from the importation of
ASCII file (2) (2) (2) (2) into Microsoft Excel during the data checking process, for each
type of melanin and the within-day and inter-day variation studies were
formatted for importation into the NIST program as average pseudo-mass
spectra files. The six reformatted files were imported into the NIST program
as “unknowns”. All 30 individual pseudo-mass spectra were imported into
the NIST program and stored as a NIST mass spectral library.
In normal operation, to compare true mass spectra the known compounds
would form the NIST library with spectra of individual unknowns being
compared against this. Reversing the roles of the unknowns and library
spectra within the NIST mass spectral search program dramatically reduced
the amount of manual data entry required. While reversing of the roles of
the unknown and the library spectra does change the absolute values of the
match factors, it does not change the relative magnitude of the match factors
Each of the 6 average pseudo-mass spectra files was then compared against
the 30 individual melanin pseudo-mass spectra that were imported into the
NIST program as the mass spectra library.
For each comparison between the 30 individual pseudo-mass spectra files
and an average pseudo-mass spectrum file a table of direct and reverse
match factors was created. As there were 6 average pseudo-mass spectrum
files there were 6 match tables of direct and reverse match factors created
(see Figure3-4).
Match each unknown to all individual pseudo-mass spectra in direct and reverse match modes
(calculates match factor from 0-1000) Import average pseudo-mass
asspectra into NIST softwared as "unknowns" Create average pseudo-mass spectrum for each type of melanin
from multiple sample data
Create NIST library of individual pseudo-mass spectra files
of all melanin samples Import ASCII data table of pseudo-mass spectrum from individual samples into NIST
software
NIST mass spectral search program for the comparison of pyrograms
Figure 3-4: Flow diagram of the use of the NIST mass spectral search program to compare pyrograms.
Statistics
The means of the direct and reverse match factors, from each match table, for
each type of melanin and within-day and inter-day dopamine melanin
samples were compared against each other using Fisher’s probability of least
Individual match factors from each match table were plotted separately and
against each other (Figures 3-6 to Figure 3-10).
Results
Representative pyrograms are given in Figure 3-5.
Statistical comparisons of the mean direct and reverse match factors for each
type of melanin and within-day and inter-day samples, from each match
table, are shown in Tables 3-1 to 3-5.
From these tables it can be seen that the values of the match factors for each
melanin type were similar, with the majority of RSD values being below
10 %. Mean match factors from melanins synthesised from different
precursors from those used to create the average pseudo-mass spectra were
significantly lower than the mean match factors of the melanin types used to
create the average pseudo-mass spectra. These statistics are highlighted in
bold. Low P-values (< 0.05) indicate that the means of the match factors are
significantly different. Mean match factors from melanins synthesised from
the same precursors† as those used to create the average pseudo-mass spectra
were not significantly different (p > 0.05). These statistics are highlighted in
Tables 3-1 to 3-5 in italics.
![Table 1-1: Structures and examples of the substances most commonly used in commercial sunscreen preparations [34, 35]](https://thumb-us.123doks.com/thumbv2/123dok_us/8462375.338547/16.595.124.536.93.637/table-structures-examples-substances-commonly-commercial-sunscreen-preparations.webp)

![Figure 3-1: A) filament or ribbon type pyrolyser B) Curie-point pyrolyser [95] C) A furnace-type pyrolyser (adapted from [96])](https://thumb-us.123doks.com/thumbv2/123dok_us/8462375.338547/40.595.130.457.81.675/figure-filament-ribbon-pyrolyser-pyrolyser-furnace-pyrolyser-adapted.webp)