T H E RELATION BETWEEN EXPRESSIVITY AND SELECTION AGAINST EYELESS I N DROSOPHILA MELANOGASTER’
JANICE B. SPOFFORD
Department o f Zoolony, University of Chicago, Chicago, 1llinoi.s
Received July 30, 1956
ANY mutant stocks of Drosophila mass cultured in the laboratory for genera-
M
tions become phenotypically almost indistinguishable from wild type. Upon outcrossing, the mutant reappears in the FZ with its pristine strength of expression. Presumably, genes reducing the degree of expression, or expressivity, of the major character of the mutant stock had appeared and accumulated through natural selection during its maintenance in the laboratory. These modifying genes are probably disadvantageous to their possessors in a culture of wild type flies. MARSHALL and MULLER (1917) found more extreme phenotypes in homozygous recessive mu- tants obtained from stocks maintained in a heterozygous condition for many genera- tions, than in parallel stocks maintained as homozygotes.Does lower expressivity reduce the rate of selection against a deleterious gene when compared with its wild type allele? If so, is the relation demonstrable within a phenotypically variable isogenic stock or must genetic modifiers exist? The rate of selection is determined by the viability and productivity of flies of the relevant genotypes. The first of these parameters can be measured in crosses giving equal numbers of mutant and wild type zygotes whereas the latter parameter can be estimated from experiments in which mutant and wild type males compete in mating, or from experiments in which mutant and wild type females compete in oviposition. The effect of the degree of expression of the mutant on viability and productivity- and thus on selection-can be studied in crosses involving mutant parents with different grades of expression.
The next question is whether any correlation observed between expressivity and selection is to be attributed to the accumulation of modifiers. If the degree of expres- sion is influenced by modifiers, there should be a positive correlation between the expression of the mutant character in parent and offspring. Furthermore, if the character is bilateral, the grades on the two sides are correlated to a greater extent within the progeny of a group of parents heterozygous for modifiers than of homo- zygous parents. The reason for this is that with heterozygous parents both local environment and genetic segregation affect the individual offspring whereas with homozygous parents only the local environment determines differences in expression. The results to be reported demonstrate that modifiers soon disrupted the initial isogenicity of the mutant stock, enhancing its viability and productivity and de- creasing its expressivity, so long as the mutant stock was maintained separately from the wild type stock. Once mutant and wild type parents were taken from segregating cultures, the accumulation of modifiers was greatly retarded. Neverthe-
Fund of the University of Chicago.
SELECTION I N DROSOPHILA 939
less, it is clearly demonstrable that mutant males and females of extreme expressivity are less productive than mutants of more nearly wild type appearance. No effect of expressivity on viability was found.
MATERIALS AND METHODS
The eyeless-4 (ey4) allele was used because of its variable expression. For brevity, it will be referred to simply as ey hereafter. The selective disadvantage of ey/ey flies with various degrees of reduction in eye size were compared against a “wild type” standard. Two stocks were derived, differing only in their fourth chromosomes. For the
+
stock, a C y / P m ; MO Sb/H 3 was crossed first to a ClB/dl-49 9 and then to one of his Bar Curly Stubble daughters. From the progeny of the latter cross a Curly Stubble male and a Bar Curly Stubble female were selected for mating. Wild type progeny should be isogenic for chromosome X (from the C y / P m ; M O S b / H 3 ) and chromosomes 2 and 3 (from the CZB/dZ-49 9 ) . Of the several fertile strains of wild type appearance so obtained, one was used in this study.The ey chromosome was introduced from flies received in December 1952 from the California Institute of Technology. An ey/ey
3
was mated to a ClB/dl-49; C y / P m ; M O Sb/H 9 . An Fl dl-49; Pm/+; H / + ;+/er
3 was mated to an F1 ClB/+; Cy/+; M O S b / + ; +ley 9 . An F3 dl-49; C y / P m ; M O S b / H ; ey/ey # was thenselected for mating with a female from the isogenic wild type stock, from which eventually an ey stock was extracted whose chromosomes X, 2 and 3 were as isogenic with the
+
stock as can be insured by the use of stocks bearing these marked in- versions. To secure reasonable isogenicity in chromosome 4, a+/+
3 was mated successively to an ey/ey Q and to one of his +ley daughters. The progeny of the latter cross were pair-mated to extract the ey strain used in the study. Five genera- tions of brother-sister pair matings of the+
strain raise to 60% the chance that the wild type fourth chromosomes were isogenic. The use of marked inversions does not guarantee isogenicity because of the enhancement of crossing over elsewhere in flies heterozygous for rearrangements. The lack of parent-offspring or right-left correla- tions soon after derivation of the stocks (see below), however, strongly suggests that isogenicity was achieved.The ey stock so obtained had much smaller eyes than the original ey stock, varying with temperature but not overlapping wild type. The ey/ey flies used as parents were classed by eye size as follows: ‘(small”-with both eyes less than one third normal; “medium”-both approximately half normal; “large”-both over half normal, a t least one more than two thirds normal; and “asymmetric”-the two eyes of markedly different size. Intermediates between these categories were not used.
Each eye of the offspring from all crosses was graded according to the arbitrary system:
Grade
I
Amount of eyeI
no more than one facet less than one third of an eye
940 JANICE B. SPOFFORD
I n statistical treatment of phenotypic grade, except in correlating right and left eyes, the individual offspring was represented by the sum of the grades of his two eyes. Thus, zero represented a totally eyeless individual and 8, a wild type individual, while 4 represented individuals with both eyes grade 2, with one eye grade 3 and the other grade 1, or with one eye normal and the other missing (these usually breeding as
+/er
and thus haplo-IV on one side of the head).The experimental crosses were performed in half-pint bottles containing the standard cornmeal-agar-Karo-molasses medium, each containing eight pairs of parents. Under these conditions, the eclosion rate drops sharply on the fourth or fifth day. Genetically ey/ey flies eclosing later have larger eyes. Eclosion began a t approximately the same time in all bottles mated a t the same time. I n two series, counts were made daily during the entire eclosion period. Both the rate a t which the average grade increased and the day on which the highest grade of ey/ey occurred differed between the two series. However, within each series the different parental classes and kinds of matings had no influence on either rate of increase or date of maximum eclosion. In cultures producing both + l e y and ey/ey offspring, the relative frequencies of these classes did not alter systematically or significantly throughout the eclosion period.
I n most of the study, offspring were counted which emerged during maximum eclosion, from approximately 60 to 78 hours after the first eclosion. I n the earlier part (series 8-40 as described in the next section), all offspring emerging during this period were classified. Later (series 41-50), no more than 30 flies of each sex were classified, since
x 2
tests on the series 39 counts showed the sampling to be random. When less than 20 emerged, the remainder of the 20 were classified the next day. Cultures producing fewer than 20 offspring during two days of counting were omitted.EXPERIMENTAL DESIGN
Selection acts through both viability and productivity, or in other words, for an insect, through both survival from zygote to imago, and contribution of either egg or sperm to the zygotes of the next generation. The relative viabilities of mutant and wild type genotypes can be expressed by a viability coefficient s: if the zygotic ratio is 1 mutant: 1 wild type, the final adult ratio is (1
+
s) mutants: 1 wild type. The productivity coefficient used here is defined so that (1+
t ) eggs are laid (or fertilized) by the mutant for every egg laid (or fertilized) by the wild type of the same sex.The relative viability of + l e y and each class of eyley flies was evaluated from the progeny of two systems of mating: 8 ey/ey Q Q X 8 +ley 3 3 per bottle (mating system A) and 8 + l e y 9 9
x
8 eyley 33 per bottle (mating system B). From the reciprocal crosses, any maternal influence on viability, or non-virginity of parental females could be assessed. Germinal selection was assumed negligible, i.e., the zygotic ratio was assumed to be $ey/ey: ++ley, since MULLER and SETTLES (1927) demon- strated no selection against even a deficiency for several autosomal loci. Reports of germinal selection (LOBASHOV 1940) might simply result from larval selection.SELECTION IN ~ROSOPHILA 941
C D
2 bottles 2 bottles 2 bottles 2 bottles 2 bottles 2 bottles
2 bottles 2 bottles
progeny of mating system D, (4 ey/ey
0
9
+
4+/er
9 9 )
X 8 ey/ey $ 3 per bottle. Since progeny from any bottle were sampled just once a t maximum eclosion, only one of the two components of productivity was measurable: rate, not duration, of offspring production. A comprehensive estimate of productivity would include both.A final mating system, E, was 8 ey/ey
9 9
X 8 ey/ey 33 per bottle.Bottles were grouped in series started a t different times. The parents in any one series were of the same age from the same sources, handled identically. Most series included :
E
2 bottles 2 bottles 2 bottles 2 bottles Phenotype of cy parents
A
2 bottles 2 bottles 2 bottles 2 bottles small. . .
medium. . .
large . . . asymmetric. . .
B
2 bottles 2 bottles 2 bottles 2 bottles
Mating system
I n later series, there were three instead of two replicates. Parents were removed and examined again before their offspring eclosed.
For the first 23 series, the + l e y parents came from isogenic
+
3 $ X ey/ey9 9
.
The ey/ey parents were selected from the isogenic stock. All flies used as parents eclosed within 12 to 18 hours after removal of all imagoes from stock bottles. Before mating, males and females were aged in vials containing 20-100 of the same sex. Vials producing eggs or larvae were discarded.The isogenic
+
stock was accidentally lost after series 23. For the next 16 series,+/er
flies came from mating systems A and B of preceding series. From series 27 on, ey/ey parents were obtained from mating systems A through E (E avoided as much as possible to retard any accumulation of modifiers). Meanwhile, a+
stock was re- isolated from + l e y offspring of series 20. Males from this later+
stock, crossed to ey/ey9 9
of assorted phenotypes, produced + l e y parents for the last 11 series.Series 1 through
7
were run a t 29°C for maximal phenotypic variation. The sterility in most of these was excessive, rendering a detailed statistical comparison with later series fruitless. Series 2, however, yielded enough offspring to calculate certain correlations. Fertility was improved by running series 8-50 a t 25°C. Series were begun only a few days apart, except for series 21, 57 days after series 20.FACTORS INFLUENCING EYE SIZE IN EY/EY STOCKS
The stocks did not long remain isogenic. Instead, eye size varied more markedly in the later series.
942 JANICE
B.
SPOFFORD <2 21 16 16 23 18 9 10 9 15 7 6 9 11 5 5 9 34 20 14 22 18 9 3 10 17 5 5 6 18 4 7 TABLE 1Percentage of ey offspring with each summed eye grade, and average of bottle mean eye grades, in maf- ing systems A and E , grouped by series and parent phenotype
2 38 36 35 40 27 18 15 23 27 18 12 21 31 21 14 22 39 39 33 40 33 20 10 23 30 15 14 23 31 16 3 8 21
_ _
- Mating system 4 13 14 15 12 20 33 30 27 21 30 31 28 23 29 33 29 12 17 11 18 33 37 28 20 34 36 30 18 38 31 32 Series >4 3 4 7 2 7 15 22 12 7 16 26 18 7 18 26 13 6 0 1 4 1 3 13 33 11 4 20 26 14 3 15 40 10_I_
-
8-20 21-33 34-42 43-50 8-20 21-33 34-42 43-50 Phenotype ofcy parent
small medium large asymmetric small medium large asymmetric small medium large asymmetric small medium large asymmetric small medium large asymmetric small medium large asymmetric small medium large asymmetric small medium large asymmetric [umbel offsp. 534 478 325 462 450 439 371 413 431 433 422 391 320 327 343 302 1081 951 656 962 834 959 596 721 790 772 931 854 644 688 613 636 Male offspring
Summed eye grade
- CZ 10 6 5 I O 5 3 1 3 3 3 1 2 4 3 2 2 13 6 4 8 5 3 1 2 6 2 1 2 6 2 0 4 - - - 2 34 36 35 35 29 16 15 21 31 15 11 18 34 28 19 25 50 41 37 41 36 13 5 18 31 16 8 20 38 17 9 21 - - - 3 29 33 33 30 31 30 27 29 - 33 29 28 27 33 25 23 33 25 33 32 31 39 28 18 32 33 25 21 28 32 2.5 16 30 - - 4 20 21 23 21 28 36 38 35 36 37 38 35 24 31 35 28 12 19 - 25 19 17 41 44 36 26 37 42 36 22 41 44 33 - - > 4 7 4 4 4 7 15 19 12 6 16 22 18 5 13 21 12 0 1 2 1 3 15 32 12 4 20 28 14 2 15 31 12 - - - Meal - 2.78 2.79 2.85 2.72 3.02 3.48 3.65 3.30 3.04 3.55 3.78 3.51 2.95 3.29 3.66 3.27 2.38 2.11 2.87 2.65 2.96 3.62 4.20 3.43 2.93 3.63 4.02 3.43 2.77 3.54 4.14 3.32 - ~ umbel offsp. 444 466 318 388 428 345 339 356 428 378 383 364 314 333 322 341 1037 945 641 871 814 905 547 683 811 694 851 804 65 7 676 624 652 Female offspring
Summed eye grade
- 3 25 30 27 23 28 25 23 29 30 29 25 24 28 27 22 27 21 28 32 26 28 25 17 28 29 26 19 27 30 27 18 30 - - Mean 2.29 2.43 2.65 2.31 2.72 3.35 3.50 3.16 2.83 3.33 3.69 3.28 2.85 3.44 3.75 3.19 1.94 2.33 2.58 2.22 2.54 3.26 4.04 3.08 2.64 3.55 3.83 3.30 2.55 3.50 4.20 3.17
After the first group of series, the mean eye grade increased, especially when parents were “medium” or “large”. The offspring were more extreme-smaller-eyed from “small” parents and larger-eyed from “large” parents-when both parents were ey and alike (mating system E) than when one parent was + l e y (mating system A). The “within bottle” variance increased concurrently, possibly because of the appearance and segregation of modifiers after series 20, but possibly simply as an artifact of the grading scale.
The initial isogenicity of the ey stock is attested by the offspring of mating system E in series 2. The midparent-son correlation (based on the offspring of “small”, “medium” and “large” parents) was
-
.101, which is not significantly different from zero (d.f. = 163,P
= .20). The midparent-daughter correlation was -.018, also not significantly different from zero (d.f. = 159, P = Al).SELECTION IN DROSOPHILA 943
_ _ _ _ _ _ _ _
.1113 .2299 .2702 .2597
.1960 ,1605 .2089 ,2203
.1335 .2644 .3307 .3448
.0960 ,3276 .3280 ,3917
,1793 .4688 ,3770 .4584 TABLE 2
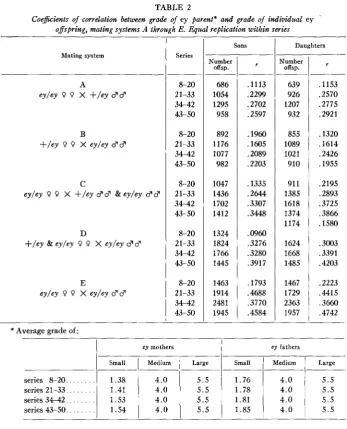
Coejkients of correlation between grade of ey parent* and grade of individual ey
offspring, mating systems A through E . Equal replication within series
Number offsp.
639 926 1207 932
855 1089 1021 910
911 1385 1618 1374 1174
1624 1668 1485
1467 1729 2363 1957 Mating system
series 8-20. . .
series 21-33. . . series 34-42. . . series 43-50. . .
* Average grade of:
ey mothers ey fathers
Small Medium Large Small Medium Large
1.38 4.0 5.5 1.76 4.0 5.5
1.41 4.0 5.5 1.78 4.0 5.5
1.53 4.0 5.5 1.81 4.0 5.5
1.54 4.0 5.5 1.85 4.0
j
5.5Series
8-20 2 1-33 34-42 43-50
8-20 21-33 34-42 43-50
8-20 2 1-33 34-42 43-50
8-20 2 1-33 34-42 43-50
8-20 21-33 34-42 43-50
Sons
1
DaughtersNumber
offsp.
686 1054 1295 958
892 1176 1077 982
1047 1436 1702 1412
1324 1824 1766 1445
1463 1914 2481 1945
r
,1153 .2570 .2775 .2921
.1320 .1614 .2426 .1955
.2195 .2893 .3725 ,3866 .1580
.3003 .3391 .4203
.2223 .4415 ,3660 .4742
later, but are already significantly different from zero. I n the interval before series 21-33, heterogeneity due to modifiers was heightened. The genetic variance increased 5.3-fold (= [.46/.2012) from the first to the fourth group of series; the original isogenic stock had none.
944 JANICE B. SPOFFORD
Medium
.230 .330 .432 .491
.211 .362 .417 .360
.280 .341
.408
.440
.222 .326
.409
.409
.215 .290 ,366 ,384
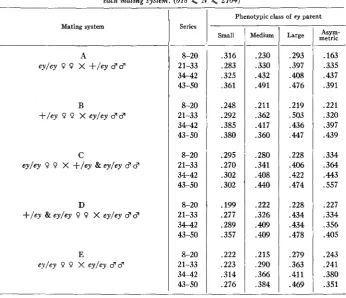
TABLE 3
Correlation coeficients of right and left eye grades i n ey offspring for each phenotypic class of parent in
each mating system. (618
<
N s; 2104)Large
~~
,293 .397
.408
.476
.219 .SO3 .436 ,447
.228 .406 .422 ,474
.228 .434 .434 .478
.279 .363 .411 .469 Mating system
E
eyley 0 O X eyley $8
Series
8-20 21-33 34-42 43-50
8-20 2 1-33 34-42 43-50
&20 21-33 34-42
4 - 5 0
8-20 21-33 34-42 43-50
8-20 21-33 34-42 43-50
Phenotypic class of ey parent
Small
.316 .283 .325 ,361
.248 .292 .385 .380
.295 .270 .302 .302
.199 .277 .289 .357
.222 ,223 .314 .276
Asym- metric
.163 .335 .437 .391
.221 .320 .397 .439
.334 .364
* 443
.557
.227 .334 ,356
.405
.243 .241 .380 .351
parent-daughter correlations in series 43-50 for A and B-are of borderline sig- nificance only, probably attributable to accidents of sampling.
“Asymmetric” parents, with an average grade somewhat less than 4.0, seemed genetically similar to “medium” parents. The variance of the offspring eye grades between bottles with “asymmetric” parents was not significantly different from that with “medium” parents in the same groups of series. Furthermore, the correlation between right and left eyes in offspring of “asymmetric” parents is about the same as in offspring of “medium” parents (table 3).
A significant right-left correlation does not necessarily indicate segregation of modifiers, since non-genetic factors could conceivably affect both eyes simultaneously. An increase in right-left correlation with time does, however, indicate an increased number of modifiers segregating.
SELECTION I N DROSOPHILA 945
The increase in right-left eye correlation with time is pronounced, though somewhat less so in the offspring of “small” parents in mating system E, suggesting that “medium” and “large” parents are more heterozygous for modifiers affecting eye size than “small” parents.
From the pattern of parent-offspring and right-left correlations, the history of the eye-size modifiers of ey can be reconstructed. Initially, the ey and
+
stocks differed a t most in their fourth chromosomes. The+
fourth chromosomes probably came from a single source, but possibly two. Between the time of the marked- chromosome derivation of the first ey stock in August 1953 and the first group of series a t 25°C (series 8-20, October through December), plus modifiers arose. Genetic diversity increased almost 5-fold following the 57-day interval between series 20 and 21, with no consistent increase during the last two periods (April through July). Over 9OOO flies were used to propagate the stocks after their derivation by the method which GOWEN, STADLER and JOHNSON (1946) found reduced heterozygositymore effectively than 97 generations of brother-sister pairing. Any locus with a mutation rate of 10-5/chromosome-generation had a 9% chance of mutating during the experiment. Several modifying mutations were likely, although probably only a modest fraction of the estimated 5000 loci of melanogaster influence the ey phenotype. All four chromosomes can carry eyeless modifiers (BARON 1935). Any mutation lengthening the larval period would correspondingly increase facet number (BODEN-
STEIN 1939).
Until series 27, ey parents of all classes came from the same stock bottles. Mean- while, larger-eyed flies became more common; natural selection was favoring plus- modifiers. From series 27 on, ey parents were taken from experimental cultures of mating systems A, B, C and D and randomized as to source. Thus, while few were the result of assortative matings, the earlier selection within ey stocks for increased eye-size was replaced by selection within each phenotypic grade of eyeless, from competition with +ley.
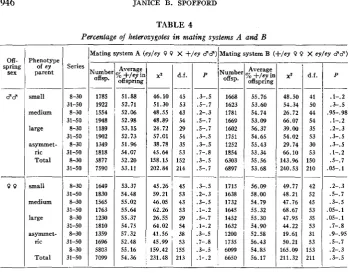
RELATIVE VIABILITIES OF EY/EY AND +/EY
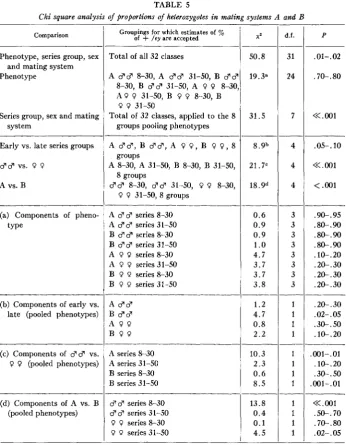
Table 4 gives the average percentage of +/ey offspring per bottle of mating systems A and B for each class of ey parent, the x2’s of heterogeneity between bottles, their degrees of freedom and the probabilities of obtaining higher x2’s without real heterogeneity. Table 5 gives the tests of differences between the categories itemized in table 4. A single bottle, mating system B, “asymmetric”, series 24, gave a highly aberrant ratio in its sons (5 ey/ey : 30 +/ey), although the ratio in its daughters was normal, with ey daughters slightly in excess. This bottle was excluded from the statistical treatments.
946 __ Off- spring sex __ $3
-
9 9 __ Phenotype of ey parent small medium large asymmet- ric Total small medium large asymmrt- ric TotalJANICE B. SPOFPORD TABLE 4
Percentage of heterozygotes in matinz systems A and B
Series 8-30 31-50 8-30 31-50 8-30 31-50 8-30 31-50 8-30 31-50 8-30 31-50 8-30 31-50 8-30 31-50 8-30 31-50 8-30 31-50 __
fating system A (ey/ey 0 0 X +/er 8’3
iumbe offsp. 1785 1922 1554 1948 1189 1902 1349 1818 5877 7590 1649 1830 1565 1763 1230 1810 1359 1696 5803 7099 - Average offspring
b +/e? i1
51.88 52.71 52.06 52.98 53.15 52.73 51.96 54.07 52.20 53.11 53.37 54.48 55.02 55.64 55.37 54.75 57.32 52.48 55.16 54.36 46.10 51.30 48.55 48.89 24.72 57.01 38.78 45.64 158.15 202.84 45.26 59.21 46.05 62.26 26.55 64.02 41.56 45.99 159.42 231.48 - - d.f. - 45 53 43 54 29 54 35 53 152 214 - 45 53 43 53 29 54 38 53 155 213 - ~ P .3-.5 .5-. 7 .2-.3 .5-.7 .5-.7 .3-.5 .3-.5 .7-.8 .3-.5 .5-.7 .3-.5 .2-. 3 .3-.5 .l-. 2 .5-.7 .l-.2 .3-.5 .7-.8 .3-.5 .l-.2 __
-
dating system B (+/er 0 0 X ey/ey $9)
Jumbc offsp. 1668 1623 1781 1669 1602 1751 1252 1854 6303 6897 1715 1638 1732 1645 1452 1632 1200 1735 6099 6650 __ Averagi
3ff sprin
55.76 53.60 54.74 53.09 56.37 54.65 55.43 53.34 55.56 53.68
b +/er
__ __ 56.09 58.00 54.79 55.32 55.30 54.90 52.58 56.43 54.85 56.17 X* __ 48.50 54.34 26.72 66.07 39.00 54.02 29.74 66.10 143.96 240.53 49.77 48.21 47.76 68.67 47.95 44.22 19.61 50.21 165.09 211.32 - - d.f. - 41 50 44 54 35 53 30 53 150 210 - 42 52 45 53 35 53 31 53 153 211 - __ P __ .l-.2 .3-.5 .95-. 98
.l-. 2 .2-.3 .3-.5 .3-.5 .l-. 2 .5-.7 .05-.1 .2-.3 .5-.7 .3-.5 os-. 1 05-.1 .I-.&? .9-.95 .5-.I .2-.3 .3-. 5
__
___
Between mating systems A and
B
within the earlier series with “asymmetric” parents,x 2
= 5.7%; within the later series,x 2
= 5.42, .01<
P<
.02. However, which mating system has the higher proportion of +ley daughters of “asymmetrics” differs from early to later series, so that, pooling mating systems, the net early-late difference is negligible(x2
= .23), and, pooling groups of series, the net mating- system difference is also negligible(x2
= .03).The viability of ey/ey sons is very significantly greater in mating system B than in mating system A in series 8-30. The only tenable explanation invokes the genetic heterogeneity demonstrated even in the earlier series. Modifiers favoring viability of the ey/ey may well have accumulated during the separate maintenance of ey and
+
stocks before series 24. Some modifiers could act via a maternal effect on egg cytoplasm. Maternal genotype has been shown to influence viability of certain offspring genotypes (LYNCH 1920; REDFIELD 1926). Thus, it is conceivable that ey/ey zygotes survive better if their mothers came from the ey stock (mating system A) than if their mothers came from a cross to+
(mating system B). For the effect to be more pronounced in sons than in daughters, chromosomeX
must have the same effect on viability in both stocks, but must override the earlier conditioning of the egg cytoplasm only when paired, as in females. By series 27, ey/ey mothers (mating system A) and +/ey mothers (mating system B) would differ systematically only in chromosome 4. The preponderance of inheritance from the ey stock would account for the later series resembling the earlier series of mating system A more than mating system B.SELECTION I N DROSOPHILA 947
Total of all 32 classes
A d d 8-30, A d d 31-50, B d d
8-30, 8-30, B d d 31-50, A 0 0
A P P 31-50, B 0 0 8-30, B
0 0 31-50
Total of 32 classes, applied to the 8 groups pooling phenotypes
TABLE 5
Chi square analysis of proportions of heterozygotes in meting systems A and B
50.8
19.3'
31.5 Comparison
A 33, B $ 3 , A P 0 , B 0 0, 8 groups
8 groups
0 0 31-50,s groups
A 8-30, A 31-50, B 8-30, B 31-50,
38 8-30, $3 31-50, 0 0 8-30,
-___
_____
____
A 3 d series 8-30 A 33 series 31-50 B 3 3 series 8-30
B d d series 31-50
A P 0 series 8-30 A 0 P series 31-50 B 0 P series 8-30 B P 0 series 31-50 A $ 3
B $ 3
A 0 0 B P P
Phenotype, series group, sex
Phenotype
and mating system
8 . 9 b
21.7"
18.9d
______ 0.6 0.9 0.9 1
.o
4.7 3.7 3.7 3.81.2 4.7 0.8 2.2 Series group, sex and mating
system
Early vs. late series groups
d d vs. 0 0
A vs. B
(a) Components of pheno- type
_c_-
(b) Components of early vs. late (pooled phenotypes)
(c) Components of d d vs.
0 0 (pooled phenotypes)
(d) Components of A vs. B (pooled phenotypes)
Groupings for which estimates of % of
+
/cy are acceptedA series 8-30 A series 31-50 B series 8-30 B series 31-50
10.3 2.3 0.6 8.5
3 3 series 8-30
3 3 series 31-50
0 P series 8-30
P P series 31-50
13.8 0.4 0.1 4.5
d.f.
31
24
7
3 3 3 3 3 3 3 3
1 1 1 1 --
1 1 1
1
__
P
. 01- .02
.70-. 80
<<.001
.05-.10
<<.
001<
.001.9&. 95
.8&.90
. SO-. 90
.
8&. 90 .1o-.20 .20-.30 [email protected] .20-.30.2@. 30
.02- .05 .3&.50 .lo-. 20
.001-.01 . lo-. 20 .3o-. 50 ,001-. 01 -__-
<<.
001.
SO-. 70 .7&. 80 .02-. 05948
8-30 31-50 8-30 3 1-50
JANICE B. SPOFFORD
3068 403 1 3502 3702
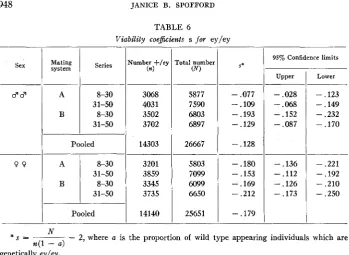
TABLE 6
Viability coe&cients s for ey/ey
9 9
Sex
1
Mating systemPooled 14303
A 8-30 3201
31-50 3859
B 8-30 3345
31-50 3735
Pooled 14140
l B
I-
5877 7590 6803 6897
26667
5803 7099 6099 6650
25651
S*
- .077 -.lo9
- .193
- .129
- .128
- .180
- .153
- ,169
- ,212
- .179
95% Confidence limits
- .028
- .068
- .152
- .087
- .136
- .112
- .126
- .173
Lower
- ,123
- .149
- .232 - .170
- .221
- .192
- .210
- .250
N
n(l
-
a )* s = ~
-
2, where a is the proportion of wild type appearing individuals which aregenetically eyley.
producing + l e y . Almost any non-virginity would be due to precocity of brothers. I n these series (27-50), of 61 bottles with 478 “small” mothers,
5
gave one + l e y offspring each, totaling 3 sons and 2 daughters. They occurred in series 31, 35-37 and 50. Of 62 bottles with 496 “large” mothers, one in series 49 produced 6 sons and 3 daughters which proved + / e r in test-crosses. I n this bottle, more than one mother may have mated previously. Of 62 bottles with 494 “medium” mothers and of 60 bottles with 472 “asymmetric” mothers, none gave+
offspring. Thus probably7
of the 1940 mothers used for mating system E in series 27-50 had mated previously with ey+-bearing males. In consequence, 14 of their 15,419 offspring, or 0.09%, were + l e y because of non-virginity, i.e., roughly 0.36% of the sperm came from prior insemination, in contrast to the 10.8% required to attribute the early difference between mating systems A and B to non-virginity.Exceptionally large-eyes ey/ey flies could be erroneously classed as
+.
To detect this, 5901 phenotypically+
offspring in series 22-26, 38, and 44-50 were testcrossed individually to ey/ey in vials a t room temperature. I n 24 vials only eyeless offspring were obtained, the remainder giving both ey and+.
The proportion of phenotypically+
flies which proved to be ey/ey was 0.407 % f 0.082 %, unaffected by sex, series, or parent phenotype. Hence, approximately 0.46% of the ey/ey $ 3 appeared+,
as did 0.50% of the ey/ey0 0
.
SELECTION I N DROSOPHILA 949
+.636
+
.SO4+
.734+
.784+.700
Because of the maternal effect on viability, table 6 gives coefficients for each mating system in both groups of series. The overall average was
-
.128 for males and-
.I79 for females.+.332 + . 6 0 7
+
,466+
.569+
.575RELATIVE PRODUCTIVITIES OF EY/EY AND +/EY MALES
Offspring from four types of matings in mating system C yielded evidence con- cerning the relative productivities of eyley and +ley
8
8 :(1) 8 “small” eyley 0 0
x
4 + l e y 8 3+
4 “small” eyley d d ;(2) 8 “medium” eyley 9 0 X 4 + l e y $ 3
+
4 “medium” eyley $ 8 ; (3) 8 “large” eyley 0 9 X 4 + l e y d d+
4 “large” eyley 8’ d ;(4) 8 “asymmetric” eyley 9 9 X 4 + l e y d d
+
4 “asymmetric” eyley $ 3 . The productivities of the four classes of ey/ey fathers can be compared, using that of + l e y88
as standard. The ratio of + l e y to ey/ey in the progeny depends on two factors: the relative proportions of eggs fertilized by the two kinds of males and the relative viabilities of the ey/ey and + l e y offspring. The male productivity coefficient, t’, evaluates the first of these factors. Since the latter factor differs in sons and daughters, two estimates of t’ can be made, one based on sons and the other on daughters.The unit of analysis was the bottle, rather than the individual offspring, since the
x 2
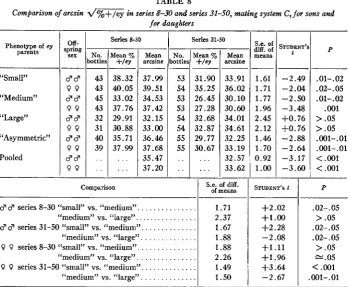
of heterogeneity of proportion of + l e y in sons between bottles with “medium” parents was 260.733, d.f. = 97, P << .0001. The percentages of + l e y in the offspring were transformed into arcsines for analyses of variance, to permit valid comparisons when percentages differed widely. Variation between bottles signifies a real variation in productivity. Table 7 presents the correlation between the proportions of + l e y in daughters and in sons. All correlations are significantly positive, especially be- tween sons and daughters of “medium” parents, whose heterogeneity was tested.The major results for mating system C are shown in table 8. The proportion of + l e y offspring in series 8-30 was on the average higher than in series 31-50, except for “large” parents. When a four-partite division of the series is made, the shift in proportion obviously is not gradual, but abrupt. Various explanations could be ruled out. The difference was not due to the inclusion of more series with one range of ages of parents in the earlier than in the later series, since an analysis of variance disclosed that, if male productivity depends on age a t all, it is equally influenced
TABLE 7
Coescients o j correlation between d and 9 arcsin d / % + - / e y ’s in mating system C (ey/ey . . 9 P X +/ev d and ey/ey d 8 )
Number of
bottles ( N )
Phenotypic class of ey parents
Small Medium Large Asymmetric Pooled
96
I
8594
~ 371
Correlation between daughters &
sons ( r )
+.500
+
.720+
,617+
,692+
.63995% confidence limits
950 JANICE B. SPOFFORD
&:!
means 1.61 1.71 1.77 1.96 2.45 2.12 1.46 1.70 0.92 1.00 TABLE 8Comfiarison of arcsin d / % + / e y in series 8-30 and series 31-50, mating system C , for sons and
for daughters
s T ~ E ~ ’
‘
- _ _ -2.49 -2.04 -2.50 -3.48 +0.76 +0.76 -2.88 -2.64 -3.17 -3.60 Phenotype of cy
parents No. ottles 53 54 53 53 54 54 55 55 “Small” “Medium” “Large” “Asymmetric” Pooled
Mean o/c
+/ey 31.90 35.25 26.45 27.28 32.68 32.87 29.77 30.67 __- . . .
. . .
cw-
ipring sex-
d d 9 9 dd 9 9 d d 9 9 $ 8 9 9 d d 9 9 - No. ‘ottle! 43 43 45 43 32 31 40 39 - . . . .-
Series 8-30 Comparison Mean %+/CY 38.32 40.05 33.02 37.76 29.91 30.88 35.71 37.99
-
. . . . . . - - Mean arcsine 37.99 39.51 34.53 37.42 32.15 33.00 36.46 37.68 35.47 37.20 - - Series 31-50 I-
d d series 8-30 “small” vs. “medium”. . . “medium” vs. “large”. . .
8 d series 31-50 “small” vs. “medium”. . . “medium” vs. “large” . . .
9 9 series 8-30 “small” vs. “medium”. . . “medium” vs. “large”. . . 9 9 series 31-50 “small” vs. “medium”. . .
“medium” vs. “large” . . .
-
M e n arcsine 33.91 36.02 30.10 30.60 34.01 34.61 32.25 33.19 32.57 33.62
-
-
S.e. of diff. of means
1.71 2.37 1.67 1.88 1.88 2.26 1.49 1.50 I
STUDENT’S f
+2.02 +1 .00
+2.28 -2.08 +1.11 +1.96 +3.64 -2.67 P
.
01- .02 .02-. 05 .01-.02 .001 >.OS >.OS .001-.01 .001-.01<
.001<
.001P
.02-. 05 >.OS .02-. 05 .02-. 05 >.OS “.OS
<
.001.001-. 01
in ey/ey 3 3 and in + / e r 3 3 between 1 and 19 days after eclosion (F = 0.3, d.f. = 3 and 39,
P
>
.OS). The ratio of ey/ey to + l e y fathers surviving until their removal from the cultures was also not related to their measured productivities (F<
1, d.f. = 2 and 74,P
>
.Os).
The series with unusually high or low “productivity” of ey/ey fathers did not correspond with those displaying the highest or lowest “via- bilities” of ey/ey offspring in mating systems A and B.Two possible explanations remain to be discussed. Both presuppose heterogeneity a t other loci influencing fertility. The first presumes that factors increasing produc- tivity in ey/ey 3 3 accumulated while the ey stock was maintained separately. After the
+
stock was lost, + / e r fathers (series 24-50) were the direct or indirect product of successive backcrosses to the ey stock. Hence, modifiers usual to the wild type were replaced by those optimal for eyley, reducing the productive advantage of +/ey. This interpretation is consistent with MATHER’S (1943) views, substantiated in HASICELL’S (1940) study of polygene complexes affecting bristle number in scute and in wild type.The second possibility is that after series 2 7 , ey/ey 3 3 had ey/ey parents which had competed successfully with + l e y flies for leaving offspring. I n any event, the greatest increase in productivity occurs for those phenotypic classes of ey/ey
SELECTION IN DROSOPHILA
--
Mean
29.20 32.68 36.69 32.81 33.22 35.12 31.34 32.43 32.69 33.30
--
95
1No.
59 60 60 60 64 64 61
60
244 244
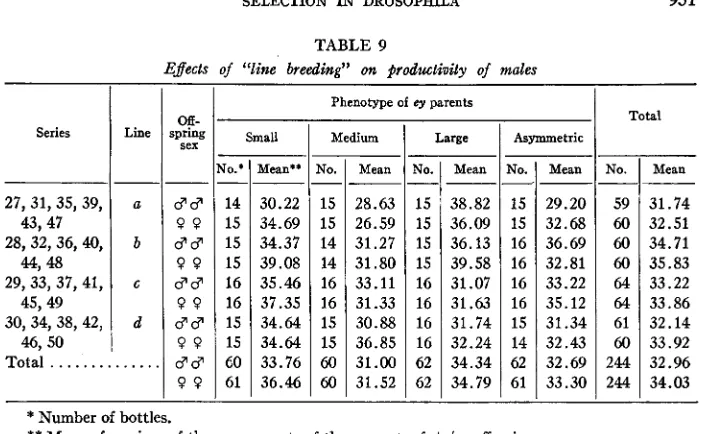
TABLE 9
Effects of “liw breeding” on #rodwtinity of males
Xo.
15 15 14 14 16 16 15 15 60 60 Series
27, 31, 35, 39,
28, 32, 36, 40,
29, 33, 37, 41,
30, 34, 38, 42, 43,47
4 4 1 48
45,49
46,50
Mean
--
28.63 26.59 31.27 31.80 33.11 31.33 30.88 36.85 31.00 31.52 Line
-
a
b c
d
--
d d
0 0
d d
0 0
d d
0 0
d d
0 0
$8
0 0
Total
. . .
..
. .
No.*
14 15 15 15 16 16 15 15
CO
61 Off-
-
Mean**
30.22 34.69 34.37 39.08 35.46 37.35 34.64 34.64 33.76 36.46
-
Phenotype of ey parents
Large
-
YO.
15 15 15 15 16 16 16 16 62 62
-
-
-
Mean
38.82 36.09 36.13 39.58 31.07 31.63 31.74 32.24 34.34 34.79
1
Total Asymmetric-
TO.
15 15 16 16 16 16 15 14 62 61
-
-
Mean
31.74 32.51 34.71 35.83 33.22 33.86 32.14 33.92 32.96 34.03
*
Number of bottles.**
Mean of arcsines of the square roots of the percent. of +/ey offspring.Four breeding lines were distinguishable in the later series: ey progeny from series 27 were used as parents for series 31, from series 31 for series 35, etc. Table 9 shows consistently greater proportions of + l e y offspring when the ey/ey fathers were “small” than “medium”. A paired comparison test of “small” vs. “medium,” pooling sons and daughters, yielded t = 3.98, d.f. = 3, .02
<
P<
.OS. I n contrast, the relation between “medium” and “large” differs from line to line. The statistical “line-by-parent phenotype” interaction falls a little short of the5
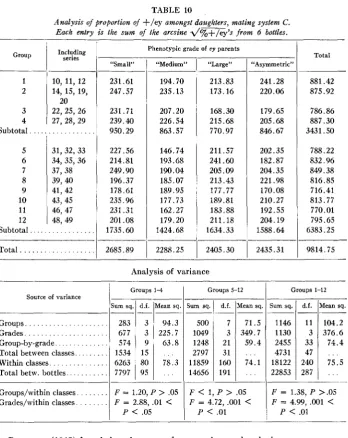
% significance level for both sons and daughters. Thus, while “small” is always less productive than “medium,” the relative productivities of “large” and “medium” vary, “large” being more productive in early series, “medium” in the later series, on the whole. Table 10 gives an analysis of variance on data for daughters, randomly eliminating several series to ensure orthogonality. A paired comparison test of “small” vs. “medium” gave t = 4.115, d.f. = 11, .001<
P<
.01; “medium” vs. “large” in groups 1 4 ,t
= 1.32, d.f. = 3, .20<
P<
.30; “medium” vs. “large” in groups 5-12, t = 3.12, d.f. =7,
.01<
P
<
.02. An analysis of sons gave similar results.952 Group 1 2 3 4 Subtotal. 5 6 7 8 9 10 11 12 241.28 220.06
JANICE E. SPOFFORD
881.42 875.92
TABLE 10
Analysis of proportion of +/ey amongst daughters, mating system C . Each entry is the sum of the arcsine d%+/ey’s from 6 bottles.
Sum sq. 1146 1130 2455 4731 18122 22853 1-Inclqding series d.f. 11 3 33 47 240 287
Phenotypic grade of ey parents
Mean sq.
104.2 376.6 74.4 75.5 . . .
-~
. . , - Total “Asymmetric” 3 3 9 15 80 95 “Small” 231.61 247.57 231.71 239.40 950.29 227.56 214.81 249.90 196.37 178.61 235.96 231.31 201.os
1735.60 __- 94.3 225.7 63.8 78.3 . . . . . . “Medium” 194.70 235.13 207.20 226.54 863.57 146.74 193.68 190.04 185.07 189.95 177.73 162.27 179.20 1424.68 “Large” ~10, 11, 12 14, 15, 19,
22, 25, 26 27, 28, 29
20
. . .
31, 32, 33 34, 35, 36 37,38
41, 42
46, 47 48, 49 39, 40
43,45 ~ 213.83 173.16 168.30 215.68 770.97 211.57 241.60 205.09 213.43 177.77 189.81 183.88 211.18 1634.33 2405.30 -__- 179.65 20.5.68 846.67 786.86 887.30 3431.50 202.35 182.87 204.35 221.98 170.08 210.27 192.55 204.19 1588.64 788.22 832.96 849.38 816.85 716.41 813.77 770.01 795.65 6383.25
Subtotal . . .
Total . . .
-___
_ _ _ _ _ ~ -
2435.31
I
9814.75 2685.891
2288.25Analysis of variance
Groups 1-4
1
Groups 5-121
Groups 1-12Source of variance
Sum sq.
ium sq d.f. iMean sq.
1
d.f. Mean sq.Groups. . . .
Grades . . .
Group-by-grade . . .
Total between classes. . . .
Within classes. . . .
Total betw. bottles.. . . .
283 677 574 1534 6263 7797 __ 500 1049 1248 2797 11859 14656 1-7 3 21 31 160 191 71.5 349.7 59.4 . . . 74.1 . . .
Groups/within classes. . . . Grades/within classes. . . .
F = 1.20, P
>
.05F = 2.88, .01
<
F
<
1, P>
.05F = 4.72, ,001
<
P
<
.051
P<
.01F = 1.38, P >.OS
F = 4.99, .001
<
P
<
.01SELECTION I N DROSOPHILA 953
--.462 - .397
- .142 -.243
+.266 +.325
-.351
- .268
Phenotype of ey male
-.747 -.723
- .581
-.670
-.543 -.431
-.642 - .671 Small
Medium
Large
Asymmetric
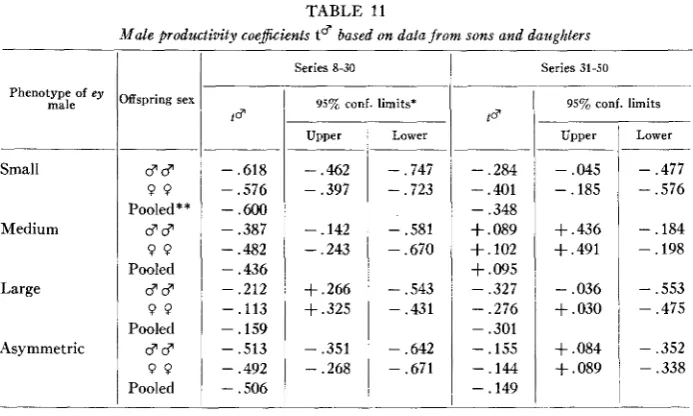
TABLE 11
Male productivity coescients t’ based on data from sons and daughters
Iffspring sex
$ 3
P O Pooled**
88
9 9
Pooled
$ 3
P O
Pooled
$ 3
P O
Pooled
1’
- ,618 - .576
- ,600
- .387
- .482
- .436 - ,212
- ,113
- .159
- ,513
- ,492
- .SO6
Series 8-30
95% cont. limits’
- .284
- .401
- ,348 -I-. 089
+
,102f.095 - ,327
- ,276 - .301
- ,155
- ,144
- ,149
Series 31-50
95% c o d . limits
- ,045
- ,185
+.436
+
,491- ,036
+
.030+
,084+
.089Lower
- ,477
- ,576
- .184
- ,198
- ,553 - ,475
- ,352 - .338
* Based on the standard error of the mean arcsine. The mean percentage of + / e y offspring was transformed into an arcsine; 2a was added or subtracted. The resulting arcsine was transformed back into a percentage, from which the corresponding upper or lower value of t d was calculated.
** Obtained by weighting the estimates based on sons and on daughters by the reciprocals of the squared differences between the appropriate pairs of 95”/0 confidence limits.
sperm was suggested. The highest proportion of ey/ey in the regular counts for series 23 were in the bottles which had the moth,ers producing only ey/ey after isolation. Inasmuch as the copulations resulting in the counted offspring probably occur soon after the parents are placed in the bottles, the test just cited indicates but roughly the vigor of the two kinds of males.
Table 11 gives the productivity coefficients ’t for each class of ey father: 1 - y(4
+
3s)+
3 d ( l+
S) - 1.012261 - y ( 4+
3s)2y(l
+
S ) - .008174p
= -2(y - a’)(l
+
S)954 JAKICE B . SPOFFORD
RELATIVE PRODUCTIVITIES OF EY/EY AND +/EY FEMALES
Table 12 presents the results of mating system D, concerning the productivity of ey/ey Q Q
.
There are no differences detectable between daughters in series 8-30 and in series 31-50. Because of the maternal influence on viability, some difference be- tween sons in early and late series was anticipated. None of significance was found, comparing sons from a single class of ey parents, but, pooling sons from all classes of ey parents, t = 1.957,P
= .OS of a merely chance divergence. Separate values of t g will therefore be presented for earlier and later series.An approximate analysis of variance disclosed no component of variance of male arcsines assignable to class of ey parents
(P
= 0.69, d.f. = 3 and 371,P
> .OS).
However, a significant component of the variance of female arcsines was due to maternal grade (F = 3.02, d.f. = 3 and 372, .O1
<
P
<
.Os). For the comparison of daughters of “small” vs. “medium” parents, t = 2.20; “small” vs. “large,” 1 = 2.36; “large” vs. “asymmetric,” t = 2.06-all significant a t the 5% level. The close parallelism between sons and daughters strongly suggests real differences between classes of ey mothers, whose borderline significance has been somewhat exaggerated in daughters and depressed in sons by accidents of sampling. A paired comparison test of “medium” vs. “small” in both sexes and series groups (d.f. = 3) yielded t = 3.30, .02<
P
<
.OS; between “medium” and “asymmetric”, t = 3.42, .02<
P
<
.OS. Productivity is highest in “medium” and “large” mothers, lowest in“asymmetric.”
When all offspring eclosing during a specified period were counted (series 7-40), there was no significant relationship between productivity of ey/ey Q 9 relative to + l e y Q Q and total number of sons per bottle, except that “small” females had relatively more sons when the total per bottle was low. The incidence of large and small counts was distributed a t random over the classes of ey parents and through the early and late series (8-30 vs. 31-50).
No effect of “line breeding” after series 30 was found in sons (table 13). However, “large” parents consistently produced higher proportions of ey/ey daughters than
TABLE 12
Cambarison o f arcsin d?A+ /ev inseries 8-30 andseries 31-50 matincsvstem D . for sons and dauehters
_ _ _ _ _ _
33
9 0
33
0 9
3 3 P 0
$ 3 P 0 3 3
0 P
Phenotype of ey parents
Small
Medium
Large
Asymmetric
Pooled
No. bottle:
43 42 47 47 32 32 37 37 159 158 Offspring
sex Mean ’%
+ l e y
_ _ _ _
33.03 32.33 30.94 30.27 31.92 30.75 34.62 34.66 32.56 31.95
1
Series 8-301
Series 31-50Mepn arcsine
34.72 34.31 33.04 32.78 33.96 33.18 35.86 35.66 34.33 33.93
No. bottles
55 55 55 55 54 54 53 54 217 218
Mean ’% Mean +/er arcsine
_ _ _ _ _ -
30.69 32.95 32.74 34.69 29.28 32.60 28.78 32.05 29.23 32.47 27.92 31.46 30.86 33.08 31.47 33.68 30.01 32.77 30.23 32.97
1.087 0.297 0.312 0.495 0.949 0.986 1.605 1.167 1.957 1.233
S e . of diff. of means
1.631 1.290 1.419 1.486 1.573 1.737 1.733 1.699 0.795 0.779
>.OS > . O S >.OS > . O S >.OS > . O S > . o s > . O S s . 0 5
>.OS DENT’S P
SELECTION I N DROSOPHILA
Line
__
a
b
c
d
955
Off-
spring sex
.~
88
9 9
8 3
9 9 $ 3
O P
88
9 9
TABLE 13
Effects of “line breeding” on productivity of females
Mean
_ _ -
31.89 31.65 33.64 34.98 32.76 31.98 33.36 31.00 32.93 32.42 Series
______
27, 31, 35, 39,
28, 32, 36, 40,
29, 33, 37, 41,
30, 34, 38, 42, 43,47
44,48
45,49
46, 50
No.
15 15 15 15 16 16 16 16 62 62 Total . . .
-
* Number of bottles.
Small
- lo:
15 15 16 16 16 16 15 15 62 62
-
-
Mean“
32.90 35.19 35.61 35.45 31.24 34.00 32.83 34.19 33.15 34.71
Phenotype of ey parents
Medium
I
Largel-
NO.
15 15 16 16 16 16 16 16 63 63
__
-
Mean ~
32.89 29.26 33.18 32.34 31.46 32.84 33.10 31.85 32.65 31.60
Asymmetric
N O .
15 15 15 16 15 15 15 15 60 61
-
-
_ _
Mean
34.93 33.65 38.19 39.05 33.20 33.27 29.00 29.14 33.83 33.86
_ _
~
Total
No.
60 60 62 63 63 63 62 62 247 248
Mean
33.15 32.44 33.14 35.50 32.15 33.02 32.11 31.54 33.13 33.14
* * Mean of arcsines of the square roots of the percentage of + l e y offspring.
did ‘Lsmall)’ parents. The daughter difference between lines borders on significance a t the 5 96 level, suggesting genetic differences established during line breeding. The lack of “line-by-phenotype” interaction indicates less divergence in female than in male fertility modifiers. Marked differences between lines existed only for “asym- metric” where F = 5.99, d.f. = 3 and 57, P
<
.01.The formula for the productivity coefficient t’ of females must be modified as follows for maternal influence on male viability:
Mother genotypes: +leu e y l e y
Offspring zygotes 1 +/ey:l e y l e y (2
+
21) e y l e yOffspring adults: 1 + l e y : ( l
+
s s ) e y / e y (2+
2t)(l+
s a ) e y / e yeyley
1 3
+
(2S.4+
S B )+
2t(l+
S A )4
+
(2s.4+
S B )+
2t(l+
S A ) +ley:
4+
(2.7-4+
SB)+
2f(l+
Sd)01,
where sa refers to ey/ey offspring of eyley mothers and s M , eyley offspring of + l e y
mothers. The proportion of adults appearing wild type is
where a’ is the proportion of ey/ey flies overlapping wild type. Then
- 1.012261 - y ( 4
+
S B+
2s.4)-
956 JANICE B. SPOFFORD
3 3
9 9 Pooled**
33
Q Q Pooled
3 3
Q Q Pooled
33
9 9
Pooled
TABLE 14
Female productivity coeficients t Q based on data from sons and daughters
___
-.323 - .211
- ,269 --.210
- .079
- ,145
--.265
- ,111 - .208 -.401
- ,341
- .376 Phenotype of ey
female
Small
Medium
Large
Asymmetric
Iffspring sex
I
L Q
Series 8-30
95%, conf. limits*
Upper
- ,105 + . O l l
+
.062+.
191+.006
+
.247- ,179
- .080
Lower
- .so0
- ,395
- ,425
- ,299
- ,478
- ,386
- .577
- ,548
- .201
- .234
- .224 - ,111 +.021
- ,076 - .lo8
+
.087- .037 - ,212
- ,150 - ,183
Series 31-50
95%) conf. limits
+
,047 - ,080+
,026+
,256+
,080+.340
+
.041+
,070Lower
-
.403-
,369-
.233- ,175
- ,269
-
,124- .417
- ,348
* Based on the standard error of the mean arcsine. The mean percent of + / e y 4 offspring was transformed into an arcsine; 2a was added or subtracted. The resulting arcsine was transformed back into a percentage, from which the corresponding upper or lower value of t 9 was computed.
** Obtained by weighting the estimates based on sons and on daughters by the reciprocals of the squared differences between the appropriate pairs of 95y0 confidence limits.
d.f. = 3, .02
<
P<
.Os. The son and daughter estimates of t’ agree better for “small” and “asymmetric” than for “large” and “medium.” The productivity of the last two appears greater when daughters rather than sons are considered; STUDENT’S t of the paired comparisons between sons and daughters is 3.97, d.f. =7,
.001<
P
<
.01. Perhaps the rate a t which “medium” and “large” females lay eggs in- creases relative to + l e y during the first days of oviposition. Throughout the experi- ment, daughters eclosed earlier than sons. The eggs developing into sons may be laid earlier than those developing into daughters included in the same count. (Any difference in development rate between eyley and +ley would be subsumed in sand would not affect t.)
In series 8-30, ey/ey 9 Q ranged from 62% to 86% as productive as + l e y Q 9 (using the pooled estimates); in series 31-50, from 78% to 96% as productive.
SELECTION I N DROSOPHILA 95 7
four hours after the egg is laid, two hours after blastoderm formation (HOw7LAND and CHILD 1935), though not before the maturation divisions of the maternal nucleus (HOWLAND and SONNENBLICK 1936). Nevertheless, how much optic disk material will form facets is not completely determined until puparium formation (STEINBERG 1944).
DISCUSSION
Unless modifiers independently alter eye size and viability or productivity in the eyley fly, the consequences of differential viability or productivity of different pheno- typic classes of a single genotype can be predicted. I t has been assumed here that the
+
allele is fully dominant, and, further, that the selection coefficients are inde- pendent of the frequency of the major gene (in this case, of ey). When there are different viability coefficients for the various phenotypic classes of the recessive genotype, the net viability coefficient for one sex is the weighted average of the coefficients of the different classes; for the genotype as a whole, S , the unweighted average of the coefficients for the two sexes. The same methods of averaging apply to the productivity coefficient, t. In a random-breeding population, the change in the zygotic frequency of the recessive allele in one generation is given by the ap- proximate expressionif 2,
1
and Q are small enough that their products are negligible.Thus, any situation which increases either S or &i.e., decreases their negative value-will favor a slower decline, or an increase, in the proportion of recessive individuals. Modifiers which increase those categories of recessive individuals with higher values of either s or t will be selected for so long as there is an appreciable proportion of recessive individuals. The speed with which such modifiers accumulate can be judged from the various indices of segregation which in the present experi- ment rose from zero a t the beginning to a significant extent in series 8-20 and jumped markedly in the 57-day interval between series 20 and 21.
Eye size in the ey/ey fly seems to have no effect on the viability coefficient since the proportion of ey/ey progeny did not depend on the ey parents’ phenotype in mating systems A and B, although the average eye grade of progeny did depend on it. Modifiers of ey can therefore be expected to derive their greatest selective advantage from improving male productivity by increasing eye size. Modifiers directly affecting productivity independently of eye size, but as a part of the optimal complex of polygenes in the ey/ey genotype, undoubtedly contributed to the general increase in male productivity in the latter half of the experiment.
SUMMARY
958 JANICE B. SPOFFORD
1. The isogenic strain of ey4 gradually accumulated an abundant supply of modi- fiers for eye size, as shown by greatly increased variance, the midparent-offspring correlation rising from an initial value of zero to .20 in the first quarter and to .46 in the last quarter of the experiment, and the correlation between right and left rising from zero to .25 and then to .46 in these periods.
2. Eyeless males were a t a selective disadvantage of 13% in viability; females,
18%, in both cases independently of eye size of ey parents-either mother or father. The viability of eyeless flies can not be affected by their own eye sizes in view of the parent-offspring correlation. There is a slight maternal effect on the viability of eyeless males.
3. Eyeless males were a t a severe disadvantage when competing with + l e y 3 c3 to leave offspring. Small-eyed males were a t a greater disadvantage (60% in the first half, 35 % in the second half of the experiment) than medium-eyed males (44% in the first half, 0 % in the second), while asymmetric males were intermediate, probably a direct result of poor vision. Larger-eyed males are in some lines a t a greater, and in other lines a t a less, disadvantage than medium-eyed males. In general, the larger-eyed males were superior to other ey males in the first half but inferior in the second half of the experiment, probably because modifiers were on the whole selected for adjustment to the “medium” type in the breeding system followed in the latter. 4. Eyeless females were a t some productive disadvantage to + l e y
0
9 (ca. 20%). Small-eyed and asymmetric females were a t a greater disadvantage than medium- eyed and large-eyed females. There was also improvement during the course of the experiment. All of these effects are less striking than in the case of male productivity. They may reflect more indirect pleiotropic effects of ey4 and its modifiers.ACKNOWLEDGMENTS
The author wishes to express deep gratitude for the advice and encouragement given by DR. SEWALL WRIGHT, under whose guidance this study was conducted, and for the assistance of RICHARDSON L. SPOFFORD in the tedious job of recording the phenotypes of the flies as they were classified.
LITERATURE CITED
BARON, A. L., 1935
BATEMAN, A. J., 1948 Intra-sexual selection in Drosophila. Heredity 2: 349-368.
BODENSTEIN, D., 1939 Investigations of the problem of metamorphosis. V. Some factors deter-
CHEN, T . Y., 1929 On the development of imaginal buds in normal and mutant Drosophila melano-
GOWEN, J. W., J. STADLER, and L. E. JOHNSON, 1946 On the mechanism of heterosis. The chromo- somal or cytological basis for heterosis in Drosophila melanogaster. Am. Naturalist 80: 506-531. HASKELL? G. M. L., 1940 The polygenes affecting the manifestation of scute in Drosophila melano-
gaster. J. Genet. 45: 269-276.
HOWLAND, R. B., and G. P. CHILD, 1935 Experimental studies on development in Drosophila melanogasfer. I . RemGval of protoplasmic materials during late cleavage and early embryonic stages. J. Exptl. 2001. 70: 415-427.
Experimental studies on development in Droso- phila melanogaster. 11. Regulation in the early egg. J. Exptl. Zool. 73: 109-125.
Facet number in Drosophila melanogaster as influenced by certain genetic and environmental factors. J. Exptl. Zool. 70: 461-490.
mining the facet number in the Drosophila mutant Bar. Genetics 24: 494-508.
gaster. J. Morphol. 47: 135-199.