On-line Surface Roughness Estimation
in Cylindrical Turning Using Neural
Networks
Brent Andrew Backhouse
B.E (Mech. Hons)
Submitted in fulfillment of the requirements for
the degree of
Masters of Engineering Science (M.Eng.Sc)
~ 1...l o_,__d_ \--0__~~ G._..._~
UNIVERSITY OF TASMANIA
STATEMENT OF ORIGINALITY AND AUTHORITY
OF ACCESS
This thesis contains no material that has been accepted for a degree or diploma by The University of Tasmania or any other institution, and to the best of my knowledge and belief no material previously published or written by another person except where due acknowledgement is made in the text of the thesis.
This thesis may be made available for loan and limited copying in accordance with the Copyright Act 1968.
Abstract
ABSTRACT
In recent years a direct method of surface finish quality detection by electrical resistance, optical, image processing and dial indicator methods have been proved to be quantitatively unreliable. The cutting tool wear undergoes a gradual increase and the failure at the end of useful life is decided on the extent of the wear growth. This irregular tool wear trend proportionally causes the quality of the surface finish to be unpredictable. Therefore there is a great need for a reliable quantitative method to establish the quality of a work materials surf ace finish, online.
From an industry point of view, it is often necessary to identify the production
quality of work materials to avoid expensive losses on machines. A worn or wearing cutting tool will cause a gradual decline in the surface quality of a component, causing unfavorable circumstances. For example, machining of alloy wheels in Ford, Chrysler and GMH have a specific surface roughness to achieve for effective coating of the wheels. The quality of the wheel coatings and their 'scratch resistance' depend on the surface profile produced during the machining operation. While many industries adopt a 'direct modeling' approach, where the machining process variables are given as inputs to the process to estimate the surface roughness, there is no evidence available of the 'inverse modeling' where the operating conditions are estimated based on the target values of the surface roughness. Nevertheless, using the direct modeling the surface roughness can only be measured 'off line' as a quality control exercise to meet the specifications of the wheel. There is a general dis~greement with the manufacturer specifications of the surface roughness, on line, with the constant changes in the cutting tool conditions and wear. Hence there is a need for 'on line' determination of the surface roughness while carrying out the machining operation. This will give an indication on the extent of tool wear growth. Further, this study will also give quantitative values of surface roughness 'on line' and its application to the manufacturing process.
In this study a neural network model is proposed for surface roughness detection 'on-line' in cylindrical turning operations. Neural network architectures will be used as
modeling tools the operating conditions will also be predicted using the surf ace roughness and cutting tool wear as inputs.
Extensive turning experiments on a lathe will be carried out covering a comprehensive range of cutting conditions to generate the knowledge base for the training stage of the neural network algorithms. The process parameters measured during the experimentation for identification of surface finish quality includes the forces, cutting tool vibrations and surface finish during cylindrical turning operation. These problem addresses one of the most pressing needs of modem automobile manufacturing industry where an 'on line' estimation of surface roughness is seen as an important parameter.
This project while improving the understanding of the machining parameters and their influence on surface finish will also identify necessary neural network tools for application. This work is seen as a step towards establishing intelligent tools for machining performance estimation, while addressing the mathematical and scientific
Acknowledgements
ACKNOWLEDGEMENTS
Firstly I would like to thank my supervisor Dr Vishy Karri for not only his technical support and guidance, but his friendship throughout the degree. Without his professional approach none of this would have been possible.
My family, who have made it possible for me to be here, not just financially but through their love and caring support.
All the staff of the Engineering faculty who have guided me in my six years with the university.
A special mention to the workshop staff for their patience and guidance throughout
my experimentation.
Finally, to all my friends who have picked me up when I was down and shown me back onto the path.
ADDENDUM
Page 17 - In the heading of section 2.2 and 2.3 monitoring is misspelt.
Pag~ 28 - In the heading of section 2.4 monitoring is misspelt.
Chapter 6 - The following list ofR2 values should be included with the corresponding figure
Figure Number Output R2Value Fh?:ure Number Output Figure 6.1 Actual Feed 0.988 Figure 6.15 PF tool Ry
Actual Tang 0.896 PM tool Ry
Figure 6.2 Frequency 0.909 Figure 6.16 PF tool Feed
Figure 6.3 Ra 0.940 PM tool Feed
Ry 0.468 Figure 6.17 PF tool Tang
Figure 6.5 Ffeed 0.014 PM tool Tang
Ftang 0.004 Figure 6.18 PF tool Freq
Figure 6.6 Freq 0.232 PM tool Freq
Figure 6.7 Ra 0.779 Figure 6.19 PF tool Ra
Ry 0.697 PM tool Ra
Figure 6.9 Ffeed 0.941 Figure 6.20 PF tool Ry
Ftang 0.939 PM tool Ry
Figure 6.10 Freq 0.894 Figure 6.21 PF tool Feed
Figure 6.11 Ra 0.755 PF tool Tang
Ry 0.709 PM tool Feed
Figure 6.12 PF tool Feed 0.988 PM tool Tang
PF tool Tang 0.897 Figure 6.22 PF tool Freq
PM tool Feed 0.945 PM tool Freq
PM tool Tang 0.935 Figure 6.23 PF tool Ra
Figure 6.13 PF tool Freq 0.909 PM tool Ra
PM tool Freq 0.265 Figure 6.24 PF tool Ry
Figure 6.14 PF tool Ra 0.940 PM toolRy
PM tool Ra 0.806
Page 228 - In the first line "PR" should read "PF".
Appendix D - The following list ofR2 values should be included with the corresponding figure
Figure Number Output R2 Value Figure Number Output Figure D.l Actual Feed 0.945 Figure D.6 Ra
Actual Tang 0.935 Ry
Figure D.2 Frequency 0.265 Figure D.7 Ffeed
Figure D.3 Ra 0.806 Ftang
Ry 0.778 Figure D.8 Freq
Figure D.4 Ffeed 0.223 Figure D.9 Ra
Ftang 0.036 Ry
Figure D.5 Frequency 0.324
R2 Value 0.468 0.778 0.014 0.223 0.004 0.036 0.232 0.324 0.779 0.921 0.697 0.923 0.941 0.939 0.974 0.939 0.894 0.666 0.755 0.906 0.709 0.263
Contents v
CONTENTS
Statement of originality
Abstract 11
Acknowledgements 1v
1 Introduction 1
2 Literature Review 4
2.1 Mechanics of cutting 4
2.1.1 Turning 4
2.1.2 Force relationships 8
2.1.3 Surface finish 11
2.1.4 Failure of cutting tools 14
2.2 Surface finish quality monitoring 17
2.3 Offline monitoring 17
2.3.1 Numerical or statistical analysis 18
2.3.2 Microscopy 22
2.3.3 Geometric modeling 23
2.4 Online monitoring 28
2.4.1 Acoustic emission 29
2.4.2 Vibration/damping 31
2.4.3 Sensor fusion 35
2.4.4 Neural networks 40
2.4.5 Optical computer vision 48
2.4.6 Metallurgy 51
2.4.7 Radiography 52
2.4.8 Fuzzy logic 53
2.4.9 Online force modeling 55
2.5 Concluding remarks 57
3 Neural Networks 59
3.1 Artificial neural system 59
3 .1.1 Feed forward networks 65
3.1.2 Recurrent networks 65
3.1.3 Supervised training 66
3.1.4 Unsupervised training 67
3 .15 Important characteristics of neural networks 68 3.2 considerations for improving and evaluating network performance 70
3 .2.1 Design of network training data 70
3.2.2 Normalising network input 71
3.2.3 Network testing and performance 72
3.2.4 Selecting network architecture for maximum performance 73 3.3 Particular models of the neural network paradigm 76
3.4 Widrow-hoff network or adaline 76
3.4.1 Architecture 76
3.4.3 Applications 3.5 Backpropagation network
3.5.1 Architecture 3.5.2 Algorithm 3.5.3 Applications
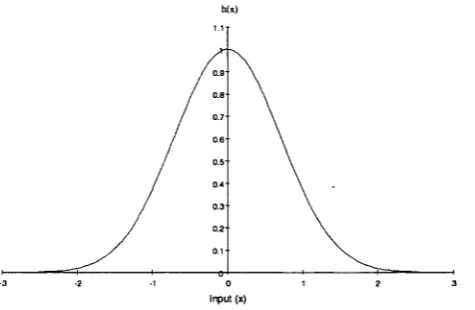
3.6 Radial Basis function network 3.6.1 Architecture
3.6.2 Algorithm 3.6.3 Applications 3. 7 Kohonen network
3. 7 .1 Architecture 3.7.2 Algorithm 3.7.3 Applications
3.8 General regression neural network 3.8.1 Architecture
3.8.2 Algorithm 3.8.3 Applications 3.9 Concluding remarks
4 Experimental Objective
5 Development of Experimental Test Rig 5.1 Experimental test rig
5 .1.1 The lathe 5.1.2 Cutting tools 5.1.3 Dynamometer 5.1.4 Accelerometer 5.1.5 Surface analyser 5.2 Data acquisition
5.2.1 Data acquisition card/board 5.2.2 Data acquisition program 5.3 Procedure on calibration
5.3.1 Steps taken for surface profiler 5.3.2 Steps taken for dynamometer 5.3.3 Steps taken for accelerometer 5.4 Comprehensive experimental test range
6 Qualitative and Quantitative trends 6.1 Qualitative trends
6.1.1 Effect of feed rate 6.1.2 Effect of speed rate 6.1.3 Effect of depth of cut 6.2 Quantitative trends
6.2.1 Effect of feed rate 6.2.2 Effect of speed rate 6.2.3 Effect of depth of cut 6.3 Concluding remarks
7 Artificial Neural Network Models for Performance Prediction 7 .1 Back propagation neural network
Contents
7.2 Training the BPNN algorithm 7 .3 Testing the BPNN algorithm 7.4 BPNN force prediction stage
7.4.1 Training the PBNN for force prediction 7.4.2 Testing the PBNN for force prediction 7 .5 BPNN vibration prediction stage
1.5.1 Training the BPNN for vibration prediction 7.5.2 Testing the BPNN for vibration prediction 7.6 BPNN surface finish prediction stage
7 .6.1 Training the BPNN for surface finish prediction 7.6.2 Testing the BPNN for surface finish prediction 7. 7 Predictive importance
7 .8 Concluding remarks
8 Final Concluding Remarks and Proposed Future Work 8.1 Final concluding remarks
8.2 Proposed future work
REFERENCES
APPENDICES
A Calibration Data
Al Accelerometer calibration chart A2 Dynamometer calibration data
B Computer Related Programs
Bl Neural Network Program Code B2 Data Acquisition Program
C Experimental Output Data C 1 Experimental Output Data C2 Test Samples
D Qualitative and Quantitative Analysis D 1 Qualitative data
D2 Qualitative analysis D3 Quantitative data
D4 Summary of quantitative trends
E Back Propagation Neural Network Data E 1 Complete neural network data
E2 BPNN original data for surface finish prediction E3 BPNN normalised surface finish prediction
CHAPTER 1
INTRODUCTION
Machining operations have in recent times gained much importance due to the inherent advantages of technology. Since ancient times machining practices have been used to manufacture items required for everyday life. Furthermore now, with the increase in production and demand for components of such a wide spectrum, for all facets of society. The modem world is reliant on material removal processes, for mechanical purposes, such as the automotive industry, where most of a cars precision parts, are created through machining processes. Also for structural purposes, the many thousand tons of metal used to create a new building development, have been machined in one way or another to suit their particular function.
The machine tool conditions and its effect on surface quality, has been a major concern as it is unavoidable, particularly so when absolute failure is unpredictable. It is a costly affair when produce are not made to the quality specifications anymore when such wear and tear on machine ageing and tool wear and breakage happens. The cost associated with downgrade of quality and downtime due to wear and breakage may at first seem negligible, but express this hundreds or even thousands of times over, the accumulating cost factor is certainly worrying. This is even more so if the cost of production is high and yield is low.
Therefore with the increasing demand for output from a production process, and the rapid improvement in technology, there is a vast need for performance estimation.
lower irregularities in the surface finish quality is very important. No direct accurate methods have been able to resolve this problem to date. This is what this project hopes to achieve.
The literature review following gives an m depth discussion of the previous
monitoring techniques used previously. These start from the classical orthogonal cutting and empirical approaches, used to give a basic understanding of the machining variables, and then discuss previous qualitative and quantitative investigations into this field. With the increase in technology and the online
implementation of computer technology, it is now feasible to almost fully automate the performance estimation. What this means is that with smart computer aided devices such as fuzzy logic, or Neural Networks, the material removal process can be monitored (all its variables) online. Thus given a desired quality standard target of the finished work piece, the feed, speed, and depth of cut can be regulated by the "smart system" to obtain the required quality.
Performance prediction of a manufacturing process occurs in two different ways: direct and inverse modeling. [1] Direct modeling is the most widely used to date. The method uses the process variables as the input to predict the performance of the system. What this involves is, given that the forces, surface finish, temperature, etc, of the system are known, information about the tool material, work material, and geometry can be modeled or obtained. Inverse modeling gives industry an alternative, whereby, given a required level of surface finish, the input parameters are required. Therefore given that feed, speed, depth of cut, geometry, and tool material are known as inputs, the forces, surface finish, tool wear, and tool life can be
modeled as output variables.
This thesis aims to accurately determine the state of the surface finish of the work piece, online and from this, a quantitative estimation of the life of the cutting tool.
cutting conditions. This will give the advantage that the wear prediction will be far more accurate than previous performance estimation techniques, and recommended manual guidelines.
Given that the online system can detect the surface finish of the work material, to a precise time period, the neural network software can be implemented to comply with the latest technology. Occurrence of this is in the automatic tool changing process
(robotics) where the change time between the new and old tool is almost negligible compared to current methods.
This technology gives industry the solution that has been a concern and a great cost for so many years. It puts to an end the large wastage of work material, and work time, and thus at the end of the day, it means money saved. Not only does it save time and wastage, but, it ensures that a better product quality is continually achieved, through a more streamlined manufacturing approach.
Chapter 2 Page4
CHAPTER 2
LITERATURE REVIEW
This literature review describes the performance estimation techniques employed by previous researchers. Traditionally modeling for metal turning has been carried out using a direct approach, this being the mechanics of cutting approach. Although this work is aimed at estimating surface finish, a general outline of the various methods will be discussed below.
2.1 MECHANICS OF CUTTING
This part of the literature survey is dedicated to the mechanics of cutting. This describes the direct modeling process of turning mechanics.
2.1.1 Turning
Turning in its basic form, it can be defined as the machining of an external surface [2] [3]:
• with the workpiece rotating,
• with a single-point cutting tool, and
• with the cutting tool feeding parallel to the axis of the workpiece and at a distance that will remove the outer surface of the work.
Thus, in general for turning, the primary cutting motion is rotational (as opposed to linear transverse for an operation like shaping and planning). This motion is
Variating slightly from the above definition, taper turning is where the cutter path is at an angle to the work axis. In contour turning, the distance of the cutter from the work axis is varied to produce the desired shape.
Turning operations may incorporate a single-point tool, however can also involve
multiple-tool setups, which are often employed in turning. In such setups, each tool operates independently as a single-point cutter.
---Spindle speed in rpm or cutting speed in surface
feet per minute (sfpm)
f
Depth of cut in inche5Feed In Inches. . . . per spindle
[image:14.548.127.451.232.413.2]r&v<11i.d_lon
Figure 2.1 Typical turning operation [2]
The three primary factors in any basic turning operation are speed, feed, and depth of cut. Given these primary factors the cutting velocity of the tool with respect to the
workpiece, Vw , can be found through vector addition of the tangential cutting speed:
vw
=
~(v
2 +VJ 2)=
~(tr
ND 2+
f
N2) where:V = tan gental cutting speed
D =work piece diameter at the point on the cutting edge f =feed
N
=
work piece revolutions per unit time VJ =velocity of feedChapter 2 Page 6
In most situations it can be assumed that the feed velocity is much less than the tangential cutting velocity, and as seen from figure 2.2, the angle between the vectors is approximately zero, therefore it can be assumed that [3]:
[2.2]
Resultant cutting direction
v
w,
Feed speed---=~~~
. 'i
Figure 2.2 Cutting speeds of the turning operation [3]
Speed, always refers to the spindle and the workpiece. When it is stated in revolutions per minute (rpm) it tells their rotating speed. But the important variable for a particular turning operation is the feed velocity, or the speed at which the work piece material is moving past the cutting tool. It is simply the product of the rotating speed times the circumference of the workpiece before the -cut is started. Every different diameter on a workpiece will have a different cutting speed, even though the rotating speed remains the same.
Feed, always refers to the cutting tool, and it is the rate at which the tool advances along its cutting path. On most power-fed lathes, the feed rate is directly related to the spindle speed and is expressed in mm (of tool advance) per revolution (of the
spindle), or mmpr.
Given the above system parameters a model can be set up for these components from figure 2.3.
Figure 2.3 Cutting mechanics of a turning operation [2]
C uttmg ve . l . V ocity, = - -7rDN 12 Feed rate, sm = sN Feed= s
Time of cut,
Tc=~
sNMaterial removal rate, Q = 12stV Length of cut = L
D -D Depth of cut, t
=
1 22
Principal cutting edge angle, </J P = 90 - <Ps
True feed, a,
=
s sin </J P=
s cos <Pst t
True depth of cut, b1
= . =
-sm ~P cos</Js Chip thickness = a2Chapter 2 Page 8
2.1.2 Force Relationships
Given the previous cutting conditions, the forces for traditional orthogonal cutting in metal turning can be analysed. It is important to consider the force requirements of the system, as these performance measures affect the selection of machine tools, cutting tools, optimal cutting conditions and most importantly the level of the surface finish quality acquired.
For a conventional single point turning tool the force system can be divided into three components:
1. Ffeed = Feed force in the direction of tool travel. Controlling the axial thrust force on the spindle, and forces and power on the feed mechanism.
2. F,adial = radial force. Controlling work piece deflections during the cutting
process, dimensional accuracy, and vibrational stability of the turning operation.
3. Ftangenial =Tangential force. Controlling the torque and power requirements of
the main spindle, and the work piece and the tool shank size and cutting edge required to sustain the cut.
To analyse the cutting forces the application study of Dr Armarego [3] is to be used. Other simpler empirical equations have been used, but they relate only basic parameters (such as depth of cut and feed only), and rely on set work material and set geometry.
In reference to figure 2.6 we have:
b= b
cos(<p,)
and
t
=
f
cos(<p,)also
A= df = (bcos(<p,t ))
=
bt cos(<p,)(2.3]
(2.4]
(2.5]
ie we have a direct comparison between classical oblique and orthogonal cutting processes. The turning operation alters the equations in that:
V1 << V, d << D and
f
<<d. (2.6]Given the previous diagram, the force components can be related to the classical
cutting methods by:
F 11ll!gental
=
FpTFfeed
=
FQr cos(<p,)+ FRr sin(<p,)Fradiat
=
FQr sin(<p,)-FRr cos(<p,)(2.7]
Chapter 2
where:
K1p,K1Q,and K,R are the edge force coefficients.
where
't
=
shear stress on the shear plane</J
=
shearanglea =
tool rake angle t = chip thickness b = width of cutP
=friction angleVw = resultant cutting speed
Page 10
[2.8]
[2.9]
The edge force coefficients displayed above are usually displayed in data banks for the specific material.
To reduce the complexity of the force components above, we can use the following
Tan(</Jn+/3J=
tani~osan
. tan 1Jc - sm an tan lTan(</J )
=
lj (cos17J cosi)cosann (1-lj (cos 7JJ cos i )sin
aJ
[2.10]
and from geometry we obtain:
Tanfln = tanf3cos7Jc [2.11]
With the above simplification we now a function of the three force components in a reduced form:
[2.12]
While this work identifies tool/work piece interference and associated dynamic modeling, the surface finish of the work piece needs to be qualified as part of the model. From equation 2.12, it can be seen the orthogonal modeling process has far too many complex variables for an online determination to be drawn from it. Therefore the need for a less complex analytical method. The following section discusses the basic orthogonal turning process and its effect on surface finish.
2.1.3 Surface Finish
The quality of a machined part is characterised by the surface finish obtained through machining [ 4], and the physical and mechanical properties of the surface layer of the material cut. The surface roughness depends on the tool geometry during the interface and the material removal process. Therefore as the working tool deteriorates, so too does the surface quality of the work piece. In a realistic machining situation the surface roughness profile and quality depend upon [6]:
• The type of chip formation.
• The chip flow.
Chapter 2 Page 12
• The motion of the machine tool.
• The vibration associated with the machine and tool.
Figure 2.4 shows the geometry of the surface after machining by the cutting tool:
Depth of cut, d
Approach Angle
[image:21.551.130.451.183.393.2]f
Figure 2.4 Surface geometry after cutting [3]
The surface roughness is characterised by two standard relations [3]. These are the peak-to-valley height, Rt (or Ry), and the centre-line-average, Ra.
From the geometry of the above diagram, the following expressions can be obtained:
R =h= I f tan
rp,
+cotTC,
ie R1 =
Jn(J ,rp,,TC,)
Where
(/), =
approachangleTC,
=
minor cutting edge angle f =feed(If the situation arises where Kr = 0, then an ideal surface will result.)
[2.13]
For the case of a simple tool, the surface roughness can also be determined by the centre line average, Ra. This assumes that the centre line is mid way between the peaks and valleys. Thus:
R
=
h a4
f
4( tan <p, +cot
K,)
[2.15]The equations above relate to a simple sharp edged tool. This is unrealistic as in practice a nose radius is given to the cutting tool. This nose radius occurs at the junction of the two flank planes and as a result the surf ace roughness is reduced. This is shown diagrammatically below:
feed,f
Effect of a smaD comer radius, r, on the Nface finish
Figure 2.5 Effect of tool nose radius on surface finish [3]
Now, during the finishing process the feed rate is very small, and the feed marks are
only caused by the comer radius.
f
< 2rsinK, d>htherefore
R1 = (1-cosK,)r+ fsinK,cosK,
-~2frsin
3 K, - f 2 sin4 K,Chapter 2 Page 14
An approximation to this formula has been given by:
1
.J
2 2 R1 = h = r-2
4r -f
R =h=_L_
I - 8r
[2.17]
similarly the center line average can be represented by the approximation:
R
=
/2
a - 18r.J3 [2.18]
The above sections summarise the performance characteristics for turning, and the result on the surface finish of a work piece material. The next section is directly related to the surface finish, in that, as the cutting tool deteriorates, the surface finish quality also decays at a proportional rate.
2.1.4 Failure of Cutting Tools
The cutting tool system and parameters have been set up in the notes above. Based on that information the analysis of cutting tool wear can be done. As materials are machined by a cutting tool, the tool wears and eventually fails. The rate, causes, and types of tool wear, and eventually failure, depends upon factors such as cutting conditions, workpiece material, tool material, and tool geometry. A cutting tool can fail by means of one, or a combination of the following processes [3,4,5]:
a) Gradual wear at the tool flank (flank wear) and/or at the tool face (cratering). b) Mechanical breakage (ie chipping and microcracking).
c) Process of plastic deformation.
Primarily tool failure under normal cutting conditions is usually gradual wear. The useful life of a tool (known as "tool life") is limited by tool wear. The wear can be described as the total loss of weight or mass accompanying the friction of the sliding or rotating parts. The wear is caused by five basic mechanisms:
1. Abrasion wear. Abrasion wear is caused by hard constituents of the work piece material, including fragments of built up edge, plowing into the tool surfaces as they sweep over the tool.
2. Adhesion wear. Where two surfaces are brought into intimate contact under loads and subjected to friction.
3. Diffusion wear .. Where atoms in metallic crystal within the tool, shift from one lattice point to another causing a transfer of the element in the direction of the concentration gradient. The amount of diffusion is dependant on the period at which a high enough temperature is existent.
4. Chemical and electrolytic wear. Chemical wear is caused by interaction between
the tool and workpiece in a chemically active cutting fluid environment. Electrolytic wear is caused by possible galvanic corrosion between the tool and the workpiece.
5. Oxidation wear. Oxidation also causes tool wear at high cutting speeds ( in a
high cutting temperature range ). Through oxidation the tool cutting matrix is weakened, which in tum weakens the strength of the cutting edge.
The tool wear progresses as a cutting operation progresses. The wear land extends
Chapter 2
FLAtlK
WEAR
t
Figure 2. 7 Geometry of crater and flank wear [2]
where:
h 1
=
wear land l = crater width e =depth Re= radiusf
=
distance from the cutting edgePage 16
[2.19]
A typical representation of the development of wear with respect to time is shown in the following graphs:
!
iT
!
~ttr
-j
JT,
m .,
... __
... _
..._
..~"'o'"~"""' n.n:."«:':"llllE:.Wr~
Figure 2.8 Relation of wear to cutting time [2]
Figure 2.8 demonstrates how the tool wear decays is dependent on the operating conditions. The decrease in surface finish quality is directly proportional to the rate in which the tool degrades. A wearing or worn tool will be evident through a higher frequency of vibration, and erratic force components. This will cause the peaks in the surf ace finish to be larger and less uniform.
2.2 SURFACE FINISH QUALITY MONOTORING
In production engineering the cutting process gets more significant in comparison to abrasive processes when machining hardened components. The application of this new technique shows a higher potential, because of the request for better production quality and productivity concomitant to lowering the production costs, abbreviation of the production sequence and minimization of processing times. The need for increased cutting life of a machine tool, and greater quality of the work materials surface finish, has led to the need for greater control over the material removal process. To gain this control, techniques have been developed to analyse various aspects of the cutting process, during or after cutting has been completed. Therefore the methods analysing the cutting process can be split into two main categories,
online or offline.
2.3 OFFLINE MONOTORING
Offline techniques for measurement of tool wear and surface finish, involve examining machining parameters and performance, after the actual material removal rate process has occurred. Thus it is trying to equate a relation for the wear of the tool based on post machining data or trends.
Offline techniques are certainly a lot easier to implement, but it does not capture a realistic image of the actual system parameters. What this means is that the process parameters such as temperature, vibrations, forces and edge wear, cannot be modeled accurately offline. This is because these attributes return to their neutral state as soon as the tool leaves the work material. While offline methods may be inaccurate in their assessment of the above process parameters, they can give important
information on such aspects as:
Chapter 2 Page 18
Various projects have been undertaken to examine tool wear and surface profiles via offline techniques, which can be summarised by the following approaches:
1. Numerical or statistical analysis 2. Microscopy
3. Geometric modeling
4. Force relations 5. Wear maps
These will be individually discussed in depth to examine their effective prediction capabilities.
2.3.1 Numerical or Statistical Analysis
Because it is desirable to replace a tool before it completely fails numerical methods have been developed to obtain a level of permissible tool wear. These are probably
the most basic and dated techniques to determine the life of a tool or the expected surface profile. The first of these is the analysis of the Taylor tool life equation [2]:
The wear criterion for cratering is given by:
h = e -c
t+
f
[2.20]
which has common values of .4 for carbide, and .6 for HSS. Similarly values for the
wearland length h1 for flank wear, are typically given as 0.025in - 0.03in for
n =Exponent depending upon tool material, workpiece material, cutting conditions, and environment.
C =Constant depending upon tool material, workpiece material, cutting conditions, and environment.
[2.21]
This formula is able to obtain basic data, or tool life expectancies, for different varieties of cutting tool. This is illustrated in figure 2.9.
4000 3000
100
r-.. ...
'-
CERAMIC~
-
- CARBIDE '"""--~
-
... ,..__ i - -~.:::: ... HSS...
-
.
..
_
I 2 4 II B 10 20 40 8080100 200TOOL LIFE (mini
1"'9·"'91C01el
TOOL LIFE (mini
WHEN: T• I THEN: V •C
n·-B
Figure 2.9 Tool life with response to cutting speed [2]
While the above equation (Taylor's tool life equation), only takes into account cutting speed and tool life, the equation can be expanded to incorporate feed, and the
depth of cut required [2]:
VT"satp
=
K where: s =feedt = depth of cut
a,fl
=exponents for feed and depth of cut. K =constant[2.22]
A more representative approach to offline management is Statistical Quality Control (SQC) [7]. SQC uses numerical techniques to analyse actual machining trends and can readily be used within the integration of online techniques. Statistical analysis can be put to good use in determining machine performance, especially indicating the near end of useful life of tools. By using SQC it introduces the possibility of having intelligent industrial machines to alert users of impending end of life of the machining tool. The statistical usage of SPC charts are explored for such purpose, and finding out how the recommended approaches be embedded into machines of the
future.
Much has been said on the significance of SQC analysis on processes, detecting process variations and confining them to the control limits and specification limits. It has been attempted to apply the same principles and analytical power of SPC to the machining tools to highlight statistical features of impending tool wear and breakage.
In the same manner SQC helps in highlighting out-of-control process variations, the same philosophy can be applied to highlight successive out-of-process variations in the process. Making an effort to detect the small shifts in the process, and extending this over a number of successive chart points may indicate abnormal tool wear -which is a "warning" sign to abrupt tool breakage. Thus, this approach of using statistical analysis on tools is low-cost to implement (almost negligible cost), and can help to propagate the use of on-line SQC analysis in a manufacturing company.
Special charts are used for tool wear in statistical analysis, being cumulative sum (CUSUM) and exponentially weighted moving average (EWMA) charts. These charts, have several advantages over the traditional Shewhart (x-bar) chart, in that
they are more sensitive to smaller process shifts, less likely to signal false alarms, and are relatively immune to the effects of measurement noise.
An EWMA (Exponentially Weighted Moving Average) chart is used when it is desirable to detect out-of-control situations very quickly. EWMA charts have a built in mechanism for incorporating information from all previous subgroups (data
Thus, the control/out-of-control decision is made with information from previous subgroups as well as the current subgroup. The chief advantage of EWMA charts is that they detect out-of-control conditions more quickly than X-BAR charts and that this detection can be done by using only one rule, that is, being within or outside 3 sigma (sigma is standard deviation) control limits.
A gradually wearing-out tool produces small shifts in the process, which are unlikely to be detectable using the X-BAR charts. The EWMA chart is a good choice because of its intrinsic property of assigning a heavier weight to earlier data points, and gradually a lighter weight to later data points. The direct result will instill a geometrically "ageing process property" to the data points, which is exactly what we is desired to emulate in an ageing (wearing-out) tool. Changing the lambda to smaller values would cause the EWMA chart to detect smaller process shifts and vice-versa.
Judging from this inexpensive approach to tool wear detection, process sensors can be installed on CNC machines, which serve two purposes synergistically and concurrently, being the implementation of normal SPC on processes and automating tool wear detection indirectly.
While this gives a reasonable prediction there are more accurate measures of tool wear, for example, using chip-embedded tool tips, image processing and neural networks to detect patterns of impending tool failure. These techniques may be more costly to implement but their predictive capabilities are far superior.
Yellowley [8] used a similar analytical approach, in examining the force ratios of a turning system, and its impact on the life of a cutting tool. The use of force information, and in particular the ratio of thrust force to power consuming force, is used to analyse both tool wear and tool breakage in turning. The work by Yellowley [8] addresses the issue of the influence of machining conditions in the turning of typical industrial work pieces. Such work pieces contain tapers, arcs and other elements, over which the geometry of cut may influence the force ratio extensively. The influence of cutting conditions on the force ratio has been pointed out in
Chapter 2 Page 22
critical problem. The work in this offline study reveals that in a more realistic turning application, the force ratios are impacted by the wear of the cutting tool.
In a very similar offline approach S. Elanayar, and Y. C. Shin [9] examine the relation for the separation of ploughing forces from shearing forces on the shear plane, and its corresponding impact on the work piece material and tool piece. The forces are decomposed by first separating the shear forces from the total forces and then employing an iterative procedure to calculate the normal forces on the shear plane. The procedure uses the indentation models along with values of tool and work piece material constants to determine the indentation force. Models for the indentation depth have been developed from the designed experiments and the predictions by the established models were compared with experimental results obtained for different cutting conditions.
Once again as with the above technique, the work gives an approximation at an online situation, and hence rough guidelines for the wear rates and surface finish of the work material. However the process is too restricted in that it only considers very few machining parameters, and offers no concrete solution to accurate
monitoring.
While these methods give some insight to the problem, they are a mainly a "text book" or empirical approach, which offers very little practical evidence of a solution. Microscopy, while still very limited, gives some practical evidence towards the tool
wear, surface degradation problem.
2.3.2 Microscopy
On the other hand microscopy is very common in analysing the wear zones of a failed tool. It is very much an offline measurement, as cutting fluids, vibrations, chip
G.M Zhang, T.W. Hwang [10] have presented a new approach to the study of cutting dynamics in microscale. The manipulation of the cutting force generated during machining is based on the characteristics of microstructures within the work piece material being machined. Mathematical modeling of the hardness variation around the circumference of the work piece reveals the cohesiveness between the macroscale and microscale analyses. The case study illustrates the procedures used to evaluate the cutting force through the microscale analysis. A model-based indirect tool wear monitoring methodology has been developed to show the potential of applying the cutting dynamics in microscale for the design of on-line quality and process control
systems.
While microscopy gives some experimental evidence into the decay cycle of the tool and the corresponding surface finish, there are not enough process variables
exhibited to make it a feasible process prediction method. Also it is offline, and not a feasible process to implement online, therefore a reliable prediction cannot be achieved for a range of machining conditions. A similar restrictive approach is geometric modeling.
2.3.3 Geometric Modeling
Geometric modeling is an almost identical process to microscopy, in that its desired output variables are the same. Different geometrical methods are used however to
obtain the output.
When machining hard (high strength) steels with geometrically defined cutting tools, the geometry of the cutting tool changes continuously due to various wear mechanisms and therefore variations in component quality must be expected. Various study has been carried out to investigate the fundamental relationships which
Chapter 2 Page 24
S. G. Kapoor and R. E. DeVor [11] have taken a geometrical approach to the analysis of a worn cutting tool and its impending effect on the surface quality, but have also based it on force modeling as in the first section. The effects of tool wear, on the economic viability of the machining process is immense. A dramatic rise in cutting forces is typically associated with a worn tool flank. This has a serious effect on the tool/work piece deflections which result in dimensional inaccuracy in the finished part. The geometric change in the tool itself resulting from flank wear causes undesirable changes in the dimensions of the cut. The high temperatures and stresses which result from the increased friction and rubbing of a worn tool also strongly affect surface quality, cutting power, and stability.
A force model that simulates the effects of wear and predicts the resulting changes in forces accompanying a worn tool has the potential to alter the current approach to wear and greatly improve process efficiency and tool utilization. Not only can such a model be used during design to estimate part errors, fixture requirements, and tool life, but it can also be incorporated into an on-line tool condition monitoring system for estimating current wear, scheduling efficient tool changes, and detecting the deterioration of part quality based on a measured force signal.
The proposal of S. G. Kapoor and R. E. DeVor describes an in-depth study of tool wear aimed at developing a wear-force relationship and modifying existing mechanistic modeling approaches to incorporate that relationship. Their focus is on flank wear and the prediction of cutting forces given a specific geometry of work tool flank. The reverse problem is also to be considered in which the current flank geometry is to be estimated given the force signal. The model has initially been developed for orthogonal cutting and then, as was accomplished successfully in sharp-tool models, the approach is to be extended to the traditional three-dimensional processes described above. Specific objectives are as follows:
geometry and the basic force system defined on the shear plane and flank wear land.
2. Apply the mechanistic modeling approach to the analytical orthogonal cutting model to relate the measured forces on the tool to the traditional process
inputs (i.e., feed rate, cutting speed, flank geometry, etc.) in such a way that expensive, time-consuming wear experiments are not needed for calibration.
3. Extend the mechanistic model for orthogonal cutting of worn tools to the three-dimensional sharp-tool models which exist for face/end milling, boring, an drilling.
The work achieved by the offline technique, gives Industrial users of metal-cutting
tools an empirical answer to the problem of tool wear. The proposed research enhances existing process models to include the effects of wear. These models, now well established for predicting process outputs from a sharp tool, will be modified to accept a level of flank wear as an input to the process. The resulting prediction capability will allow designers to understand the quantitative effects of wearing a tool to a certain level, thus aiding in the selection of processes, fixtures, and product dimensions. Thus product and process design can occur simultaneously, with consideration given not only to the first item produced with a perfectly sharp tool by
also to the many items produced before a tool finally reaches the end of its useful life. The model can also be used to better establish a criterion for tool life as well as monitor.the process to detect when that life is near its end.
Chapter 2 Page 26
C Y H Lim [12], has used a geometrical approach, in that of wear maps. A wear map is a multi- (usually two) dimensional graphical presentation of wear data. It is a similar approach to geometric modeling or microscopy, where the wear of the tool is monitored offline. However unlike most other conventional approaches, which tend to restrict the breadth and depth of wear information reported, a wear map is able to show a fuller picture of a wearing system by linking measured wear rates with observed wear mechanisms over a much wider range of conditions. Wear maps have been developed successfully for the sliding wear of metals, ceramics, metal-matrix composites and polymers, and for the wear of uncoated tools in actual machining operations.
The current project investigates the wear behavior of titanium carbide- (TiC-) coated cemented carbide tools in turning operations. Experimental tool wear data from carefully executed single point dry turning tests, together with similar data culled from the technical literature, are used in the construction of wear maps showing the
flank and crater wear characteristics of these tools over a wide range of machining conditions. The maps are shown here in Figures 2.10 and 2.11, respectively. The axes of the wear maps are defined by cutting speed and feed rate, which are the two most important factors that affect tool wear. The boundaries on the maps demarcate areas of machining conditions within which the same ranges of wear rates are observed.
~ . . . . . . . ~ . ~ .. . .. .
.
..
, . . . . ,, . . ... . . ... ~ . . ,... ,... . . ... . . . . . .. .
• • • • • • < • ·• • ,... • • • • • • ~ • • • • • • • • ..
. . . . ... . . . . . . . , .. ·•
.
.._ ·•. ,, ... , ... .~ , .. . . . . . . _,. ,... . . . . ~. '
• • ~ < • ~ • " • ... • • • .. • • • • • • •
, ': .• . , •• .tEAST~WfAfLRcGIM£' .... : .
SAFETY ZONE
.. ' ,.. ' ... - .
, . ,
. . . ' .
15ll 200 1SQ 300 WO
currnrn SPEE!l lmtminl
. .... ,-·1
'-'-~__,,.<·~· ~.,.,,,,.,,.,. ... .i:: ... _.;
;so too
Figure 2.11 Wear map showing crater wear characteristics [ 12]
Both the maps show that the extent of flank and crater wear varies according to cutting speed and feed rate. On each map, there exists a range of conditions, denoted the "safety-zone", under which the coated tools would suffer the smallest amount of flank or crater wear. Also of significance are the regions of the next lowest wear rates (shaded with dots). These cover far wider ranges of machining conditions than the safety zones and allow greater flexibility in the choice of cutting conditions that will still result in a low wear rate.
While this method offers a reference for machining, it offers only a guide to turning tool wear. There is no relation found between the wear maps, and the surface finish profile. Also rather than decreasing the quality control the quality control period, it ineffectively increases it. The importance to the customer is the quality of the product they are receiving, therefore the emphasis must be placed on the quality of the product, as opposed to the wear on the machine.
Chapter 2 Page 28
2.4 ONLINE MONOTORING
One of the most important manufacturing process is machining. According to some researchers, it turns into chip nearly 10% of the global metal production. Moreover, machining is responsible for more than 40% of the production cost of different types of parts [13,14, 15].
In recent years machining processes have suffered dramatic changes aiming to increase productivity and quality assurance, which has been reached by means of process automation, e.g., CNC machines. However, in order to have a fully
automated machining process, it's necessary to use online tool life monitoring systems, which will lead to establishing a quantitative surface finish prediction. Nowadays the strategies used, to establish the region of surface wear are based on
statistical data. But due to machining process complexity and unpredictability, the surface finish range is very wide. Therefore, many tools are replaced in conditions to be used, which increases tool consumption and dead time. For the reasons described above the use of monitoring systems may be very useful to optimise tool life and decrease production costs.
Online or 'in-process' surface finish monitoring has attracted wide interest for a long time. It has presently acquired more importance than ever as manufacturing systems are increasingly required to provide greater automation and flexibility, while keeping high productivity levels. In unattended manufacturing, worn tools must be changed on a statistical basis, eg., with reference to the shortest life expectancy of the tools used. Such procedures are inefficient as much of the useful life of the tools may be wasted and high tool changes would mean higher machine downtime, decreasing thereby the system productivity. In-process monitoring techniques which allow for the optimal utilization of tool life, though highly desirable, are to date not yet fully developed.
1. Acoustic Emission 2. Vibration/Damping 3. Sensor Fusion 4. Neural Networks
5. Optical computer vision 6. Metallurgy
7. Radiography 8. Fuzzy Logic 9. Force modeling
And each previous investigation or field of study, may recognise or utilise one or more of these online techniques.
2.4.1 Acoustic Emission
Acoustic emission study, relates the noise frequencies from the machining process, to the wear region of the cutting tool, and also the corresponding surf ace finish level. Different wear types (wear of tool flank face and tool chipping) result in changes in the different characteristic values of the noise signal. In case of a uniform abrasion of the insert, e.g., flank face or crater wear, an increased mean signal level is observed, whereas for microbreakage at the edge, an increase of the crest factor with nearly constant mean signal level is found [13].
Chapter 2 Page 30
It was shown that AE frequencies in the range of 50 to 100 kHz are primarily due to plastic deformation in the near-surface tool regions and the primary, secondary, and
tertiary shear zones of the work piece. Cracking leading to coating delamination and WC grain pull-out generates frequencies in the range of 170 to 200 kHz.
This study generates positive feedback, relating values of acoustic emissions to the region of tool wear and level of surface finish. The main problem is that the online study gives no further progress into the online detection of surface finish quality, especially since the machining parameters are mostly kept constant, the AE data gives no true indication for a broad spectrum machining process.
J. A. Rice, S. M. Wu, Reid and Polly Anderson [17] have compiled a similar study on the feasibility of catastrophic cutting tool fracture prediction via acoustic emission analysis. The prediction of catastrophic cutting tool fracture and is effect on the
surface finish is explored through monitoring the acoustic emission (AE) from a cutting process. A prediction parameter is derived which combines the AE signal with a physical model of a cracked tool to form an estimate of the spatial energy release rate.
Monitoring the energy release rate is found to be largely dependent on the detection of crack advancement. Experiments were performed with both new and artificially cracked inserts during interrupted cutting. Epoches denoting crack advancement
were detected through high time homomorphic analysis of the acquired AE signals. AE bursts prior to and leading up to fracture were analyzed for crack advancement. The calculated energy release rate was found to exponentially increase as fracture was approached. Crack advancement could be feasibly detected approximately six cuts prior to fracture.
While this study advances on the last, once again the data is coherent only to the cutting conditions of their individual setup. Also it is completely unfeasible to
integrate an online based knowledge into the cutting routine, when it is so restricted by cutting variables, and its accuracy questionable. The surface finish quality can
the tool wear. The data is too unrestricted to pinpoint a known region of surface quality.
2.4.2 Vibration I Damping
The study of vibration and damping involves analysing frequency of vibration of the cutting tool or its directly related components. From the frequency output,
parameters can be established to the region of the tool wear and the corresponding surface finish quality.
A.A. Hood [18] has designed a control system for Active Vibration Control of a turning process using PMN actuators. In recent years, intensive research has been
conducted concerning the use of smart materials for active vibration control and also vibration attenuation for machine tools. This research investigates vibration control of a machining operation using actuators made of smart materials.
In the study, the effectiveness of using electrostrictive actuators for active vibration control during a turning process on a conventional engine lathe is investigated. The actuators are made of Lead Magnesium Niobate (PMN) and are in a multi-layered configuration. The test bed is a steel structure, called the smart tool post. It is designed to be a key component of a conventional engine lathe machine tool and its purpose is to transmit compensating energy from the actuators to the tool tip during machining. The unique characteristics of PMN actuators to provide accurate displacements ensure the performance of vibration cancellation on the micron scale. The focus of the research was the design of a control system for performance optimization. The research combines both analytical and experimental approaches. In the analytical aspect, optimal and adaptive control schemes are proposed. Mathematical models of the smart tool post, based on first principles, are derived and evaluated. In the experimental aspect, system identification of the tool post's dynamics as well as the actuator's
Chapter 2 Page 32
Results from this thesis show that PMN actuators are good smart material, candidates for active vibration control. Optimal, and adaptive control, designs are critical to achieve effective broad band vibration compensation. This thesis gives a systematic presentation of the smart tool post's system modeling, control system design, and real-time microprocessor implementation. But most of all, the study illustrates that the use of PMN ceramic material as actuators does indeed have practical applications in precision machining.
Damping capacity greatly affects the dynamic rigidity of a machine tool system. The thesis paper by M. Hashimoto, S. Kato [19], deals with the damping capacity of turning tools. Damping capacity is measured as a function of clamping conditions such as clamping load or surface topography of tool shank. An empirical equation of damping capacity representing the clamping load dependence is induced for the fundamental mode of vibration in tangential and normal directions. The optimum clamping load, at which the stability of turning tool for chatter excitation becomes a maximum, is experimentally clarified.
A second field of study was attempted [20]. This was to examine the mechanism initiating the damping capacity of a turning tool. The turning tool is considered as a beam on an elastic foundation. Parameters of the model are estimated from the experimental result of the free damped vibration frequency. Next, the magnitude of damping energy is calculated from the friction resistance and the relative slip between the tool shank and the tool post (elastic foundation) during vibration in both tangential and normal directions. The calculated result of damping energy agrees well with the experimental result of the damping capacity qualitatively, for various clamping loads and various surface topographies. This result indicates that the damping capacity of the turning tool system is mainly caused by the relative slip at
the tool shank.
precisely. In the development of the system model, the intermittent turning process is mathematically formulated and analyzed as a system associated with three periods, namely, the impact, cutting, and non-cutting periods. The main investigative methodologies used were:
1. Applying modem control theory to perform dynamic cutting analysis in the cutting and non-cutting periods.
2. Employing wave propagation theory to study the impact force during the impact period.
3. Using numerical simulation and finite element method to examine the impact process and its effect on the machining performance.
The emphasis is focused on the effect of impact on the tool motion and the effect of the work piece damping on the machining performance. The research results indicate that the impact between the cutting tool and the work piece at the every beginning of each cutting period is the main cause leading to mechanical failures of tool during the intermittent machining. Laboratory experiments have been conducted, and the obtained results show a general, good agreement with the results predicted by the developed system model. An attempt has been made to construct a stability boundary map.
This field of work is very practically unfeasible. While it has been discovered that the main tool wear through vibration occurs in the impact between the tool and work
material, there is no conclusive evidence as to which point this will cause the tool to fail, or any prediction to which point in time that it may occur. And further more, there is no indication of the discreet relation between the vibration signals, and the state of the surf ace finish of the output component.
Chapter 2 Page 34
interfaces produces vibrations. Cutting force oscillations also produce vibrations. As cutting time elapses and tool wears, the frequency of vibration changes. On the other hand, electrical power and current consumed by the machine tool are proportional to the mechanical power consumed by the machining process and also proportional to cutting force. Therefore, a system that is able to relate variations in the vibration frequency or variation in the motor current to the tool wear may be useful to assure online tool life monitoring.
The mam goal of this work is to correlate vibration signal variation and motor current variation with surface wear and the tool condition, when finish and rough turning. The experimental set up presented below. Experiments were carried out in
[image:43.551.206.381.356.461.2]order to compare vibration signal and current sensibility in the online monitoring system.
Figure 2.12 Experimental set up of Fabio Nogueira Leao [15]
The components of this experimental setup are listed below:
1- CNC power lathe 2- Main motor 3- Hall element 4- Computer 5-NDboard 6- Signal analyser
7- Piezoelectric accelerometer 8- Cutting tool
This work approaches the goal of obtaining a quantitative surface finish approximation, in that two major process parameters are considered. The main problem is that there is still not enough experimental variables to be able to enable a smart system to be incorporated, and the testing variables limit the process to this particular system. There is very little variance of turning conditions allowed for. Furthermore the process is concerned with evaluating the tool wear, and offers very little reference to the quality of the produced components.
The predictive capability of this form of online system is quantitatively unreliable. A
more reliable method of obtaining data is through the use of sensors.
2.4.3 Sensor Fusion
Sensor fusion simply utilises sensor components to analyse the wear of a tool or the corresponding surface finish quality. While study is concentrated on sensor fusion, the online models are usually associated with several other techniques, such as neural networks or fuzzy logic.
Kai Frank Goebel [21] has provided a means to deal with uncertainty in complex sensor driven systems, in particular for sensor validation, sensor fusion, and diagnosis. These means come from probability theory, neural network theory, and fuzzy logic and are more generally termed as "soft computing" techniques. The investigation considered systems that had to be controlled based on monitored sensor readings to allow corrective action in case of aberrations from a desired value. Since all sensor readings are always subject to a variety of noise conditions, such as Gaussian noise, bias, clutter, outliers, and non-symmetric noise distributions, the aim is to perform sensor validation and D in case of multiple sensor readings, ie sensor
fusion.
This dissertation provides means for fuzzy sensor validation and fusion. The approach was compared with a probabilistic method, which is a Kalman filter based
Chapter 2 Page 36
assigned confidence values. Each sensor has its own dynamic validation curve, which is shaped according to sensor characteristics. These characteristics can take into account the range, external factors affecting the sensor, reliability of the sensor, etc. The curves have its maximum value at the predicted value which is arrived at using fuzzy exponential weighted moving average time series predictor. Sensor readings have value 0 at the boundaries of the validation gate which is determined by the maximum possible change a system can undergo in one time sample. Since
readings outside the gate are implausible, they are discarded. Readings closer towards the predicted value are rewarded with a higher confidence value.
Fusion is performed using a weighted average of sensor readings and confidence values and the predicted value scaled by the operating condition. Each method performs best in the presence of certain types of noise and recommendations are made as to which approach is more appropriate under various conditions. Another aspect of this dissertation is to provide a tool for diagnosis in the presence of vague
symptoms. This is achieved though fuzzy abduction which can diagnose crisp as well as soft faults. This means that faults can be diagnosed if they occur to some degree. The proposed algorithm computes a closeness measure taking into account the distance from an observed symptom set to the modeled symptom set for all failure combinations. It then ranks the failure sets according to maximum closeness measure and minimum cover, i.e., number of faults. As an extension, a framework for fuzzy influence diagrams is provided which uses this closeness measure. Several applications from extant systems show the feasibility of the approaches developed here. From a manufacturing point of view, it shows how the neural network tools
provided allow for improved decision making for optimal tool exchange in a high speed milling machine environment by monitoring the degree of component wear on-line. This process approaches a reliable prediction model, but with input data only
consisting of ideal (non-discarded) values and ideal experimental conditions (conforming noise signals), evaluating the trends becomes unreliable when considering a real cutting scenario.
![Figure 2.1 Typical turning operation [2]](https://thumb-us.123doks.com/thumbv2/123dok_us/8460697.338198/14.548.127.451.232.413/figure-typical-turning-operation.webp)
![Figure 2.4 Surface geometry after cutting [3]](https://thumb-us.123doks.com/thumbv2/123dok_us/8460697.338198/21.551.130.451.183.393/figure-surface-geometry-after-cutting.webp)
![Figure 2.12 Experimental set up of Fabio Nogueira Leao [15]](https://thumb-us.123doks.com/thumbv2/123dok_us/8460697.338198/43.551.206.381.356.461/figure-experimental-set-up-of-fabio-nogueira-leao.webp)
![Figure 2.15 Topology of the CNN Network [34]](https://thumb-us.123doks.com/thumbv2/123dok_us/8460697.338198/52.550.194.393.144.275/figure-topology-cnn-network.webp)
![Fig. 3 .11 Basic architecture of a radial basis function network [ 117]](https://thumb-us.123doks.com/thumbv2/123dok_us/8460697.338198/96.551.174.414.59.248/fig-basic-architecture-radial-basis-function-network.webp)