Lipids in
Euphausia superba
by
Patti Virtue, BSc.(Hons.)
University of Victoria, B.C., Canada (IASOS, University of Tasmania, Australia)
Submitted in fulfilment of the requirements for the degree of
Doctor of Philosophy
University of Tasmania (February, 1995)
This thesis contains no material which has been accepted for the award of any other degree of diploma in any tertiary institution. To the best of my
knowledge this thesis does not contain material written or published by another person, except where due reference is made.
This thesis may be made available for loan and limited copying in accordance with the Copyright Act 1986.
Table of Contents
Appendices ... iv
List of Figures ... .' ... v
List of Tables ... vii
Abstract ... viii
Acknowledgments ... x
Chapter 1. General Introduction. 1.1 Antarctic Krill ... 1
1.1.1 Krill Biomass ... 2
1.1.2 Krill Production ... 3
1.1.3 Chemical composition of krill ... .4
1.2 Lipids ... 6
1.2.l Fatty Acids ... 7
1.2.2 Triacylglycerols ... 9
1.2.3 Phospholipids ... 10
1.2.4 Sterols ... 11
1.2.5 Hydrocarbons and pigments ... 12
1.2.6 Lipid biomarkers ... 14
1.5 Objectives of this investigation ... 16
Chapter 2. Dietary related mechanisms of survival in Euphausia superba: changes during long term starvation and bacteria as a possible source of nutrition. 2.1 Abstract ... 18
2.2 Introduction ... 19
2.3 Materials and Methods ... 21
2.3.1 Krill collection and experimental conditions ... 21
2.3.2 Bacteria collection and culture ... 23
2.3.3 Lipid extraction and analysis ... 24
2.3.4 Sample preparation for electron microscopy ... 28
ii
2.4 Results ... 29
2.4.1 Growth, mortality and sexual maturation of krill ... 29
2.4.2 Lipids ... 30
2.5 Discussion ... 37
2.5.1 Growth of krill during starvation ... 37
2.5.2 Sexual regression of krill during starvation ... 37
2.5.3 Lipids ... 38
Chapter 3. Changes in the digestive gland of Euphausia superba during short-term starvation: lipid class, fatty acid and sterol content and composition. 3.1 Abstract ... 43
3.2 Introduction ... 45
3.3 Materials and Methods ... 46
3.4.1 Statistics ... 46
3.4 Results ... 47
3.4.1 Lipid composition and content ... .47
3.4.2 Fatty Acids ... 47
3.4.3 Sterols ... 50
3.5 Discussion ... 56
Chapter 4. The lipid composition of Euphausia superba Dana in relation to the nutritional value of Phaeocystis pouchetii (Hariot) Lagerheim. 4.1 Abstract ... 62
4.2 Introduction ... 63
4.3 Material and Methods ... 66
4.3.1 Statistics ... 67
4.4 Results and Discussion ... 68
4.4.1 Krill lipid, composition and content ... 68
4.4.2 Phytoplankton fatty acid composition ... 70
4.4.3 Fatty acid composition of krill lipid classes ... 72
iii
Chapter 5. Reproductive trade-off in male Antarctic krill.
5.1 Abstract ... 81
5.2 Introduction ... 82
5.3 Materials and Methods ... 84
5.4 Results and Discussion ... 85
Chapter 6. The biochemical composition of Nyctiphanes australis and its possible use as an aquaculture feed: lipids, pigments and fluoride content. 6.1 Abstract ... 93
6.2 Introduction ... 94
6.3 Materials and Methods ... 95
6.3.1 Biochemical analyses ... 96
Protein analysis ... 97
" Pigment analysis ... 97
Fluoride analysis ... 98
6.4 Results ... 99
6.5 Discussion ... 102
Chapter 7. Summary and Conclusions ... 107
iv
Appendices
Appendix 1. Sexual maturity stages of Euphausia superba ... 128
Appendix 2. Rectangular midwater trawl net (RMT 8) used for
collection of krill in this study ... 131
Appendix 3. Fatty acid and sterol nomenclature ... 132
Appendix 4. Representative partial gas chromatogram of fatty acids
found in Euphausia superba ... 133
Appendix 5. Representative partial gas chromatogram showing
sterols found in the digestive gland of Euphausia superba ... 134
Appendix 6. Mass spectral data for isoprenoid hydrocarbons found in the
v
List of Figures
Figure 1.1 A simplified scheme of the Antarctic marine food web. 1
Figure 1.2 Fatty acid structures. 6
Figure 1.3 The synthesis and hydrolysis of triacylglycerol. 8
Figure 1.4 Structure of phospholipid. 9
Figure 1.5 Sterol structures. 10
Figure 1.6 Structure of a C 25 isoprenoid alkane. 11
Figure 1.7 Carotenoid pigments found in krill. 12 Figure 2.1 Prydz Bay region, Antarctica showing typical krill 22
sampling stations.
Figure 2.2 Schematic diagram outlining separation of lipid classes 26 and methods of analysis.
Figure 2.3 Percentage growth of Euphausia superba during starvation. 29 Figure 2.4 Triacylglycerol and polar lipid levels in male and female 32
Euphausia superba during starvation.
Figure 2.5 Electron micrographs showing bacteria in the stomach 35 of freshly caught krill.
Figure 2.6 Partial gas chromatogram showing isoprenoid hydrocarbons 40 in Euphausia superba.
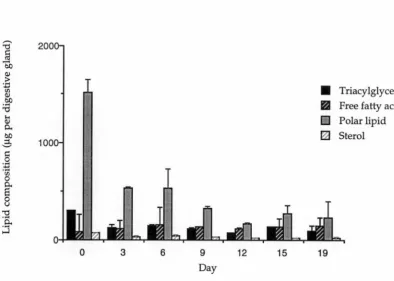
Figure 3.1 Lipid composition of total lipid in the digestive gland of 49
Euphausia superba during 19 days starvation.
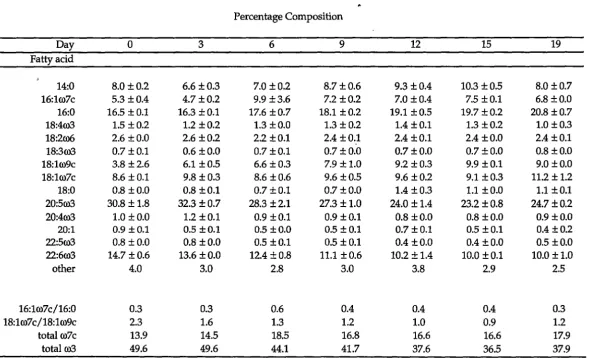
Figure 3.2 Fatty acid composition of total lipid in the digestive gland 49 of Euphausia superba during 19 days starvation.
Figure 3.3 Sterol composition of total lipid in the digestive gland of 55
Euphausia superba during 19 days starvation.
Vl
Figure 4.2 Interaction between percentage fatty acids in the lipid 75 fraction of Euphausia superba fed on Phaeocystis,
Phaeodactylum and a mixed diet.
Figure 4.3 The ratio of 16:lro7c/16:0 in lipid classes of krill fed diets 76 of Phaeocystis, Phaeodactylum and a mixed diet.
Figure 5.1 Comparison between male triacylglycerol and total lipid 85 levels with those found in female, juvenile and starved krill.
Figure 5.2 Correlation between triacylglycerol levels and total lipid 86 in male krill caught over three summers.
Figure 5.3 Electron micrographs showing diatom fragments in 88 the stomach of freshly caught reproductive male krill.
Figure 5.4 Algal sterols in the digestive glands of krill with low 87 triacylglycerol stores (0-2%) immediately after capture.
Figure 5.5 Percentage composition of males in the total sub-adult 92 and adult population >35 mm.
vii
· List of Tables
Table 2.1 Total lipid in Euphausia superba during starvation. 31
Table 2.2 Percentage fatty acids of Euphausia superba during starvation. 33
Table 2.3 Percentage fatty acids of bacterial cultures from stomach 36 and digestive glands of Euphausia superba.
Table 3.1 Total lipid, lipid class content and composition, and lipid 48 class ratios of lipids in of the gland of Euphausia superba
during starvation.
Table 3.2 Percentage fatty acid composition of the total lipid in the 51 digestive gland of Euphausia superba during starvation.
Table 3.3 Analysis of percentage fatty acid data of total lipid of 52 digestive gland of Euphausia superba during starvation.
Table 3.4 Correlation matrix using percentage composition of fatty acids 53 of the digestive gland of Euphausia superba during starvation.
Table 3.5 Percentage sterol in the digestive gland of Euphausia superba 54 during starvation.
Table 4.1 Lipid class dry weight and lipid class ratios of Euphausia 68
superba fed on Phaeocystis, Phaeodactylum and a mixed diet.
Table 4.2 Fatty acid composition of Phaeodactylum and Phaeocystis 71 strains.
Table 4.3 Percentage fatty acid composition of Euphausia superba fed 73 on Phaeocystis, Phaeodactylum and a mixed diet.
Table 4.4 Percentage sterol composition of Euphausia superba fed 78 on Phaeocystis, Phaeodactylum and a mixed diet.
Table 5.1 Percentage fatty acid of the total lipid of male, female 89 (gravid and spent), and juvenile Euphausia superba.
Table 6.1 Lipid class, total lipid, lipid class ratios, cholesterol, 100 carotenoid and fluoride levels of Nyctiphanes australis as
a function of season and life stage.
viii
Abstract
Aspects of the life history and overwintering survival strategies of Antarctic krill (Euphausia superba) were interpreted through analyses of lipid class, fatty acid and sterol content, and composition. Both laboratory and field studies were undertaken to provide information on the biochemical and physiological consequences of starvation, on dietary sources and on reproduction.
Starvation in krill, both short term (19 days) and long term (130 days), was investigated. Lipids are a source of short term energy in krill. The relative levels of polar lipids, free fatty acids and cholesterol in the digestive gland provide indices of the nutritional condition of Euphausia superba in the field in the short term. However, throughout long term starvation levels of both triacylglycerol and polar lipid in krill did not change significantly.
Therefore, lipid metabolism is not considered to be the major mechanism for energy production during long term starvation as is usually the case in most other polar zooplankton.
Lipid profiles of krill fed on diets of Phaeocystis pouchetii, and of diets of diatoms were compared. Krill fed these two diets showed no significant differences in lipid levels. Phaeocystis pouchetii, although being deficient in a number of what are normally referred to as the essential fatty acids, was found to be nutritionally equivalent to diatoms as a food source for
Euphausia superba. Krill may possess the ability to convert exogenous shorter
chain fatty acids to the long chain essential polyunsaturated fatty acids, eicosapentaenoic (EPA, 20:5co3) and docosahexaenoic (DHA, 22:6co3); this hypothesis has also recently been proposed for penaeid prawns. The results from the present investigation of Euphausia superba suggest the ability to convert dietary derived fatty acids to EPA and DHA may be more widely spread than previously believed.
ix
levels (approximately 50% of total fatty acids) of essential fatty acids found in the digestive gland of krill.
Lipid biomarkers in krill were investigated. It was found that sterols in the digestive gland indicate composition of the recent diet of krill. Sterols can be also be used to quantify dietary input from individual phytoplanktonic species. Fatty acids, like sterols, can be used as biomarkers to provide information on food sources of Euphausia superba.
The role of lipids in reproduction was investigated. Reproductive stores were determined in both male and female krill. High lipid levels were found in reproductive female krill and very low levels of lipid were found in male krill following reproduction. Despite male krill feeding actively during
reproduction, the level of storage lipid (triacylglycerol) was depleted. Female krill regressed sexually after spawning and survived through to the
following season. Male krill, however, died shortly after reproduction. Fewer males in the Antarctic krill population would reduce competition during the food-limited winter allowing resources to be preferentially invested in females.
The lipid profile of Euphausia superba was compared to that of a temperate
euphausiid, Nyctiphanes australis. Seasonal comparisons between the polar
and temperate species were made. The potential of the euphausiid,
Nyctiphanes australis as an aquaculture feed in terms of lipid, pigment and
fluoride content was investigated. Like Euphausia superba, Nyctiphanes australis contained high levels of the essential long chain polyunsaturated
fatty acids (PUFA); EPA and DHA. Astaxanthin was the main carotenoid in
Nyctiphanes australis. Both high PUF A and astaxanthin levels suggest this
x
Acknowledgments
I'd like to acknowledge Peter Nichols for introducing me to the ecological significance of lipids. His prevalent positive attitude, good humour and gentle spirit guided me through this research. Having Peter Nichols as a research supervisor was one of the finer things that has been laid upon my table. My supervisor Stephen Nicol, I would like to thank for his critical
questioning, his constructive criticisms, and for bringing back the biological perspective when it all got a bit too chemical.
Andrew McMinn is acknowledged for his encouragement along the way and for happily signing those grant applications for me. Thanks to Liz Sikes for her support and respect. I am also very grateful to David Thomas for his initial encouragement of this research.
The CSIRO Division of Oceanography supported the laboratory work for this research. I would like to thank David Nichols, Graham Green, Stephanie Barrett, Rhys Leeming, Jenny Skerratt, Michael Bakes, Danny Holdsworth, Teresa O'Leary, Mark Rayner and Graeme Dunstan of the Organic Chemistry group, CSIRO Division of Oceanography, for their assistance throughout this work
I am indebted to both Barbara and Roger Lewis for their generous and loving care of Jacob whilst I was in Antarctica and at conferences. I'd like to also thank Barbara for always having my best interest at heart.
Thanks to my friend and colleague Mike Pook who travelled the road beside me and helped me ride those bumps. I would like to gratefully acknowledge Martin Stolp of the Antarctic Division for his friendship and for always giving -priority to my research. Gerry Nash and Andrew Davidson of the Antarctic Division are acknowledged for their kind help along the way.
My family Catherine, Julie, Kim and John supported my aspiration to do this PhD through their encouragement and generosity. Thanks to Kim, who's prevailing spirit has always been there for me.
Chapter 1. General Introduction
1.1 Antarctic Krill
'Krill' is a word originally applied by Norwegian whalers to the shrimp-like crustaceans which are extremely abundant in polar seas. Krill belong to the order Euphausiacea of which 85 species are known. Although there are seven species of euphausiids that live in Antarctic waters, the term Antarctic krill usually refers to the dominant species, Euphausia superba (Appendix 1).
Euphausia superba are of considerable importance in the Antarctic marine
ecosystem. Krill are one of the prime converters of phytoplankton and hence most Antarctic marine vertebrates either depend on krill directly or through a close trophic association (Figure 1.1). The importance of krill in the
economy of the Southern Ocean was expressed by Marr (1962) during the
Discovery Investigations. "The astronomical abundance in which it exists and the key position it holds in the industry and ecology of the Antarctic seas is revealed by a review of the vast and catholic multitude of its predators".
IPenguinsl
I
[image:14.536.79.482.523.676.2]---11~.- Pther Whales
I
/
In addition to this multispecies dependency, krill are also commercially harvested for both human and animal feed primarily by Chile, Japan, Ukraine, Poland and Russia. The Soviets started fishing krill in the early 1960s and reported vast schools that "turned the ocean red" (Ross and Quetin 1988). To determine just how vast schools of krill are is proving difficult. Although Antarctic krill have been investigated intensely, there are still major discrepancies in our understanding of the life history of this species.
Commercial krill catches have been as high as 5,3x10s tons in 1981/82, however, catches have declined considerably with only 8,4 xl03 tons being caught in 1993/94(Miller1991, Anon 1995). Based on present biomass estimates and catch levels, the krill fishery has not reached potential
harvesting capacity (Miller 1991). A management body to regulate the krill harvest was established in 1980 as a result of both concerns of
over-harvesting, and the historical exploitation of Antarctic marine resources (Nicol 1990). Due to the critical position of krill in the Southern Ocean ecosystem, the associated ecological costs of over-harvesting would be devastating. Confident biomass and production estimates must be used to manage the krill fishery as a sustainable resource.
1.1.1 Krill Biomass
One of the major difficulties in estimating krill biomass is due to the sheer size of the Southern Ocean and the associated seasonal fluctuations in ice cover. Large scale extrapolations of commercial catch data and krill survey results must be made in estimating krill abundance. Euphausia superba have a
circumpolar distribution which is restricted to the north by the Antarctic Polar Front. Distribution is thought to be influenced by large-scale oceanic circulation patterns in this region. Information on early summer and winter distribution is scarce as most of the area to the south of the front is under pack ice during this time.
enhanced reproductive success and evasion of predation have been
implicated in swarming behaviour (reviewed by Miller and Hampton 1989). Due to the huge variations in size of these krill aggregations, the task of assessing biomass using both catch data and acoustic surveys is difficult. Reported estimates of standing stocks of krill, range from between 55 to 7000 million tonnes (Miller and Hampton 1989).
1.1.2 Krill Production
Fundamental gaps in our knowledge of the basic krill biology and physiology makes estimating krill production difficult. To estimate krill production, parameters such as growth rate, mortality and reproduction must be fully described. Traditional length frequency analysis cannot be applied because morphometric characteristics of krill are not linear with age. During times of limited food supply (which can be up to 8 months of the year), growth rates of krill have been reported to be negative (Ikeda and Dixon 1982, Ettershank 1983, Quetin and Ross 1991). This makes determining krill growth rates and longevity inherently difficult. Although there is
conflicting evidence for the existence of overwinter lipid stores (Hagen 1988, Quetin et al. 1993, Clarke 1984), laboratory studies have shown that krill utilise body protein as a source of metabolic energy during starvation. As they continue to moult they decrease in body size (Ikeda and Dixon 1984).
Natural mortality rate is a function of age and estimates also vary widely. The causes of mortality in krill (excluding predation) are not well
understood. Mortality in the winter as a result of environmental stress is not known. Mortality associated with reproduction has been reported in other euphausiids, Meganyctiphanes norvegica and Thysanoessa raschi (Mauchline
1960, Mauchline 1966). However, conflicting evidence exists for breeding related mortality in Euphausia superba (Marr 1962, Quetin and Ross 1984,
Watkins et al. 1986).
In estimating production, one of the many parameters involved in the formulation of an energy budget includes the cost of reproduction. To date all reproductive costs in krill have been associated with egg production and seasonal fecundity (Miller and Hampton 1989). Costs of male reproduction is considered_ insignificant, however, nothing is known of the energy associated with sperm production and transfer (Quetin et al. 1994).
1.1.3 Chemical composition of krill
The chemical composition of krill has been widely researched in view of its commercial use for both human and animal consumption. Krill are nutritious and have a sweet taste which is similar to that of shrimp. Frozen and dried krill are used for animal food and peeled tail meats are used for human consumption. On average krill contain 78 - 83% water, 12 - 15% crude protein, about 2% chitin and glucides and 3% ash (Grantham 1977, Suzuki and Shibata 1990). Krill have large amounts of vitamins A and E and a high concentration of the pigment, astaxanthin (Funk and Hobson 1991).
Many studies have been conducted on the lipid content of Euphausia superba.
Reported levels of total lipid range from 6-43% dry weight depending on life stage, sexual maturity, temporal and spatial variations (Ferguson and
what form they are stored. This kind of information is essential in considering the basic life history of a species.
With the high levels of proteins, polyunsaturated fatty acids and vitamins, krill is an ideal food for most animals. One major draw back of using krill as an animal feed is it's high fluoride content. Levels of fluoride in Euphausia superba have been found to be unacceptable for either human consumption
or for stock feed (Budzinski et al. 1985, Nicol and Stolp 1989). Fish, on the other hand, accumulate fluoride in their skeleton only and fish flesh is unaffected by fluoride content of the food source (Oehlenschlager and Manthey 1982). Hence, as a fish feed krill are considered ideal.
The commercial interest in krill has long been established. As krill are of immense importance to the Antarctic marine ecosystem, relevant data necessary for scientific management of this crustacean fishery is imperative.
It is difficult to determine the productivity of Antarctic krill based on
1.2 Lipids
Lipids are a diverse group of compounds. They are of great nutritional and reproductive significance in all living organisms. The major lipid classes include triacylglycerols, phospholipids, glycolipids, sterols and
hydrocarbons. Lipids are used in physiological and biochemical studies because they are important both as energy reserves and as structural
components of the cell. In food chain studies lipids can be used as chemical signatures or biomarkers that identify the presence of certain organisms or groups of organisms.
On a weight for weight basis, lipids liberate double the energy content (9.5 kcal/ gram) compared to proteins (4.4 kcal/ gram) and carbohydrates (4.2 kcal/ gram) (Fessenden and Fessenden 1982). Lipid is the ideal medium if large energy storage is required by an organism, as it requires the least mass. In the polar marine environment, where food is abundant for a few months
and scarce for the remainder of the year, in most organisms the ability to store lipids is their currency for survival. In addition to the high energy content, lipids have a low specific gravity which provides buoyancy in pelagic marine organisms (Hagen 1988).
Antarctic phytoplankton incorporate as much as 80% of their fixed carbon into lipid as compared to 20% incorporation in temperate phytoplankton (Smith and Morris 1980). The energy of the summer phytoplankton
production is conserved in lipid reserves in the herbivorous crustaceans in Antarctica (Hagen 1988). These reserves are in tum the vital link to winter survival for the many dependant predators. Due to the absence of wax ester storage, there has been much speculation as to whether krill use lipid as a source of energy in the winter (Clarke 1980, Hagen 1988, Quetin et al 1994).
1.2.1 Fatty Acids
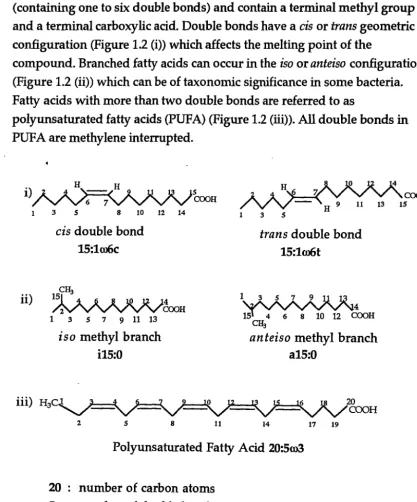
Fatty acids are the essential building blocks of many of the complex lipids. Most fatty acids in plants and animals contain between 12 to 32 carbon atoms per molecule. Fatty acids are usually straight chain but can be branched or cyclic. They are either saturated (containing no double bonds) or unsaturated (containing one to six double bonds) and contain a terminal methyl group and a terminal carboxylic acid. Double bonds have a cis or trans geometric
configuration (Figure 1.2 (i)) which affects the melting point of the
compound. Branched fatty acids can occur in the iso or anteiso configuration
(Figure 1.2 (ii)) which can be of taxonomic significance in some bacteria. Fatty acids with more than two double bonds are referred to as
polyunsaturated fatty acids (PUPA) (Figure 1.2 (iii)). All double bonds in PUPA are methylene interrupted.
i)
ii)
H
3 s 8 10 12 14
cis double bond
15:1oo6c
CH3
151 -4 6 8 LO 12 14
~COOH
1 3 s 7 9 11 13
iso methyl branch
i15:0
2 s 8
s
COOH
11
trans double bond
15:1oo6t
1
",,J....
J....J....
.A
~R.
1,;\'
~
":' ";"
Yo
Yz
1:4ooa
CH3
anteiso methyl branch
a15:0
14 17 19
20
COOH
Polyunsaturated Fatty Acid 20:5ro3
20 : number of carbon atoms 5 : number of double bonds
[image:20.548.67.485.196.698.2]co3: position of the first double bond from the methyl end
Fatty acids are important components of the cell and organelle membrane. The fluidity of biomembranes is a function of the degree of unsaturation of its constituent fatty acids. The degree of unsaturation present in membrane lipids is thought to be directly related to temperature. Unsaturated fatty acids have a lower melting point than saturated fatty acids. The more double bonds in fatty acids within the membrane, the more fluid the cell membrane. The problem of maintaining membrane fluidity (and the associated
metabolic processes) is more acute in organisms in polar waters than in temperate and tropical waters. Polyunsaturated fatty acids are therefore of particular significance in organisms living in cold waters. It has been suggested that the phospholipids of Antarctic plankton contain a higher degree of unsaturation in order to maintain membrane fluidity at low
temperatures (Clarke 1983). The seasonality of lipid storage in euphausiids is believed to be the key to understanding differences in lipid content and composition. However, few comprehensive seasonal studies on lipids of euphausiids have been performed.
Polyunsaturated fatty acids are generally thought to be only synthesised de
novo by photosynthetic organisms (Sargent and Whittle 1981) and are
therefore considered essential to heterotrophic organisms.
PUFA of the linolenic (m3) and the linoleic (ro6) families have been recognised as very important nutrients for the growth of crustaceans.
It has been suggested that crustaceans must derive these nutrients
exclusively from their diet (Sargent and Whittle 1981, D'Abramo and Shyn-Shin 1993). Polar herbivorous crustaceans are rich in the ro3 fatty acids, especially 20:5ro3 (eicosapentaenoic acid) and 22:6ro3 (docosahexaenoic acid) as dictated by the high PUF A levels in the phytoplankton on which they feed. The levels of PUFA and in fact the fatty acid profiles of phytoplankton vary between species. Fatty acids can be use to determine quantity and composition of food sources, because zooplankton can reflect, to a certain degree, the fatty acid profile of their diet (Sargent and Whittle 1981, Saether
1.2.2 Triacylglycerols
Triacylglycerols are neutral lipids which contain two unit molecules: glycerol and fatty acids (Figure 1.3).
0 0
" :---1
"
~(CHz) 16-C-CJtI __ _:i: _ _!i9_-c~ ~(CHz) 16-c- o-c~
~
·---, I
synthesis~
I
C~(CHz) 16-c-qtt + Hd,-CH-~--... - ~(CHz) 16-c- O-CH +3H20
f
.~~~~~~~~~---_:
I
hydrolysisf
I
~(CHz) 16-c-dH + ... ___________ _ Hd,-C~ CH3(CHz) 16-c- o-c~
[image:22.535.77.529.158.373.2]3 fatty acids + glycerol triacylglycerol + 3 waters
Figure 1.3 The synthesis and hydrolysis of triacylglycerol.
Fatty acids are released upon hydrolysis of triacylglycerols (Figure 1.3). When an organism ingests triacylglycerols they are hydrolysed into
monoglycerides, diglycerides, glycerol and fatty acids which are absorbed through the intestinal wall (Fessenden and Fessenden 1982). These products are then: (1) used to synthesise the organisms own lipids or other
compounds~ and (2) metabolised for energy. The major site for lipid storage and synthesis in crustaceans is thought to be the digestive gland (Teshima and Kanazawa 1980, Dall et al. 1992). Triacylglycerol is the major deposit of storage lipid in all animal cells (Lehninger 1975) and it represents an
important energy reserve in crustaceans. Generally, triacylglycerol is accumulated during feeding and depleted during starvation. As
1.2.3 Phospholipids
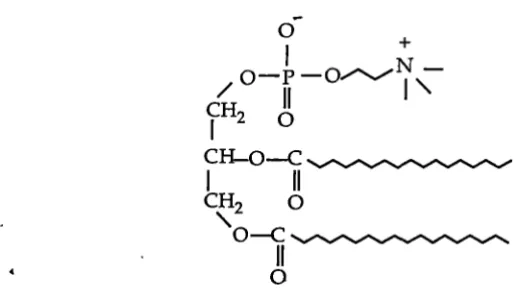
Phospholipids (Figure 1.4) are amphoteric in nature and thus form the
infrastructure of biomembranes. They are essentially constructed in the same fashion as triacylglycerol except that in the place of the third fatty acid there is a phosphate group (or grouping that may contain both phosphate and nitrogen).
0 +
I
O-P-0 ... N
-/
II
I '
CH2 0
I
C~-C~
I II
CH2 0
'o--c~
II
[image:23.535.107.364.210.356.2]0
Figure 1.4 Structure of phospholipid (phosphatidyl choline).
The phosphate group can be ionised and hence is soluble in water while the long fatty acid chain is hydrophobic. These molecules are arranged in a bilayer with the nonpolar alkyl chains of the fatty acids in the centre and the polar phosphate end orientated on the surface of the cell membrane. Transfer of nutrients and metabolic products across the membrane is thus facilitated. Membrane fluidity is vital to achieving this transfer of nutrients so a high concentration of PUF A can be found in the phospholipids of membranes.
1.2.4 Sterols·
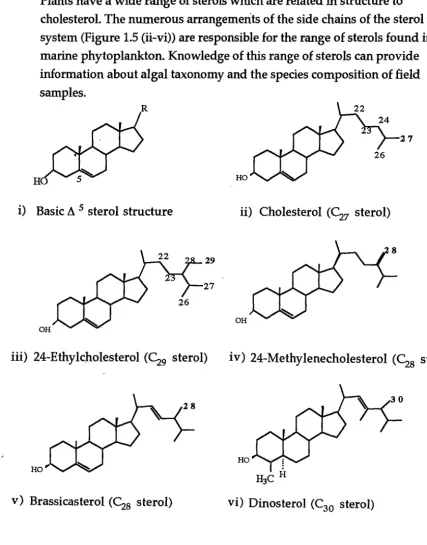
Sterols are compounds containing a four ring system (Figure 1.5 (i)).
Cholesterol is the major sterol found in animals (Figure 1.5 (ii)) and it is the precursor of steroid hormones such as progesterone, testosterone and cortisol Sterols are components of all eucaryotic plasma membranes (Stryer 1988). Plants have a wide range of sterols which are related in structure to
cholesterol. The numerous arrangements of the side chains of the sterol ring system (Figure 1.5 (ii-vi)) are responsible for the range of sterols found in marine phytoplankton. Knowledge of this range of sterols can provide information about algal taxonomy and the species composition of field samples.
R
27
HO
i) Basic ll. 5 sterol structure ii) Cholesterol (C27 sterol)
29
27
OH OH
iii) 24-Ethykholesterol (C29 sterol) iv) 24-Methylenecholesterol (C28 sterol)
HO HO
v) Brassicasterol (C28 sterol) vi) Dinosterol (C
30 sterol)
[image:24.542.38.465.197.741.2]The majority of marine organisms rely on phytoplankton as their sole source of sterols, directly in the herbivores and indirectly for the carnivores
(Ballantine et al. 1979). Marine crustaceans cannot synthesise sterols de novo however, they are able to dealkylate phytosterols which are then converted to cholesterol (Teshima 1982).
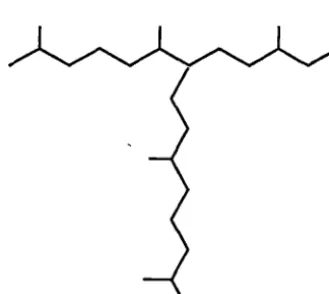
1.2.5 Hydrocarbons and pigments
Hydrocarbons, as the name implies, are a class of compounds containing hydrogen and carbon which are formed by biosynthetic processes in both marine and land organisms. Hydrocarbons can vary in molecular weight, degree of saturation and polarity. A remarkable array of compounds are formed from the linkage of the basic isoprenoid (Cs) unit:
CH3 I
~Hz= C- CH= CHz
Plants absorb light due to the alternating double and single bonds of the isoprenoid units in pigment compounds (Stryer 1988). A wide range of photosynthetic pigments and other isoprenoid alkanes are present in phytoplankton (Figures 1.6 and 1.7) and can be species specific.
[image:25.541.197.362.510.657.2]Measurement of these isoprenoid biomarker compounds can be used to determine algal classes present in phytoplankton populations.
The most spectacular of pigments are the vivid red carotenoids (C40 isoprenoid hydrocarbons) which are found widely among invertebrates, particularly in Crustacea. The carotenoids such as astaxanthin and
canthaxanthin, (Figure 1.7) which are found in marine organisms such as krill and salmonoids, are derived from dietary plant carotenes and
xanthophylls. Their major metabolic role is that of photoprotection (Hairston 1979), and are also used as antioxidants and as precursors to vitamin A (Goodwin 1984). These pigments cannot be biosynthesised by aquatic
animals, they must be assimilated from the diet. In the aquaculture industry there is a high demand for these carotenoids as feed supplements,
particularly in the rearing of salmonids where the maintenance of it's pink flesh is of high commercial importance (Storebakken 1988). Krill, being high in astaxanthin levels, are therefore a potential component for aquaculture feeds (Shimizu et al. 1990).
'
0
HO
Astaxanthin
0
YLt
~/x
[image:26.539.77.425.379.595.2]Canthaxanthin
1.2.6 Lipid biotnarkers
Various fatty acids, sterols, and hydrocarbons that move unaltered through the trophic chain can be used as biomarkers. Both fatty acids and sterols are of interest as biomarkers because they can be markedly species specific (Sargent and Whittle 1981). Hydrocarbons are considered metabolically inert, hence dietary derived hydrocarbons generally are not altered through the food web (Mackie et al. 1974).
Biomarker distributions can be used to understand trophic relationships between organisms, from bacteria to mammals. The presence of lipid
compounds in organisms can be adequately species specific so as to be useful in taxonomic classification. In addition to their chemotaxonomic uses,
biomarkers can provide insight into the biochemical and geochemical cycling of organic matter (Laureillard and Saliot 1993). Many lipid biomarkers are resistant to degradation. These organic compounds can be preserved over extended periods in sediments and also may be useful in
paleoenvironmental studies (Sikes and Volkman 1993).
Fatty acids derived from the phospholipids of microorganisms associated with sediments provide reproducible and quantitative measures of the biomass and community structure of microbial assemblies (e.g. White 1983, Guckert 1985). For example, iso and anteiso branched fatty acids are
characteristic of bacteria, hence their presence in higher organisms can be used to identify bacterial association.
Sterols can be used as chemical markers for distinguishing algal classes, and in some cases, specific algal species. 24-Methylcholesta-5,22E-dien-315-ol (Figure 1.5 (iv)) is a characteristic sterol in diatoms (Patterson 1987). More specifically 23,24-dimethylcholesta-5,22E-dien-3B-ol has been found to be a major sterol in the pennate diatom, Fragilaria pinnata (Barrett 1995). The
authors suggest this sterol may be a used as a biomarker for Fragilaria pinnata. Dinosterol (4,23,24-trimethyl-5a-cholest-22E-en-315-ol) (Figure 1.5
which can be derived through the conversion of phytosterols. Phytosterols are of interest in food chain studies because in addition to providing information on the recent diet of a grazer, rates of sterol conversion can be determined.
Fatty acids in phytoplankton can prove useful taxonomic tools. Fatty acid profiles in Antarctic diatoms show high levels of 20:5ro3, 16:1ro7c, 18:1ro7c and 18:lro9c (e.g. Gillan et al. 1981, Nichols et al. 1986a). Although these compounds are not specific to diatoms, this particular fatty acid profile can be used to distinguish diatoms from another dominant algal species in Antarctic waters, the prymnesiophyte Phaeocystis pouchetii. Phaeocystis has very low levels of 20:5co3 and is high in both 18:4co3 and 18:5ro3 (Sargent et al. 1985, Nichols et al. 1991). 18:4co3 can be a prominent component of the fatty acids in the calanoid copepod found feeding on Phaeocystis in Norwegian waters. In tum, 18:4ro3 has been found to be the prominent fatty acid in herring and sand eels which were feeding on the copepods in this region (Sargent and Henderson 1987).
Different species of krill can have distinct fatty acid profiles which provide information on feeding grounds and food sources of predators higher up the food chain. Analysis of lipids from finwhales feeding on krill
(Meganyctiphanes norvegica) in Nova Scotian waters showed profiles high in
20:1and22:1 compared to lipids from finwhales feeding on Euphausia superba
which are low in these fatty acids (Ackman and Eaton 1966). Fatty acids in milk samples of lactating Antarctic fur seals taken during foraging trips were analysed. The characteristic fatty acid pattern of the specific diatom diet upon which krill (Euphausia superba) had been feeding was evident in the fur seal milk (Iverson 1993).
Sterol biomarkers, in conjunction with fatty acids and other lipid
compounds, can be used as powerful tools for biological studies. The use of biomarkers is a complementary technique or potentially a viable alternative to tedious microscopic methods used to determined the presence of
1.5 Objectives of this investigation
This study has attempted to gain an insight into several aspects of krill life history using lipids as the main investigative tool. Although the following chapters are distinct independent studies they are connected by a central theme. Using the various individual studies that this thesis comprises, a lipid based model was developed. The model is driven by the fundamental input into the system, being food. How the availability of food, in terms of both the quantity and quality of lipid, influences the survival of krill over winter. The extent of lipid expenditure on reproduction is incorporated into the model including implications on resource appropriation. Techniques incorporating thin layer chromatography - using a flame ionisation detector (TLC-FID), gas chromatography (GC) and gas chromatography /mass spectrometry
(GC/MS) have allowed the quantitative and qualitative determination of lipid data.
Because krill are inaccessible to study in situ for a substantial part of the year,
laboratory starvation studies were undertaken to investigate how krill might respond physiologically to a limited winter food supply. A better
understanding of overwintering mechanisms in relation to food supply is fundamental to our knowledge of growth and the aging process of krill. Several questions were posed: Are lipids a source of metabolic energy during starvation (both short and long term)? What is the rate of depletion of energy reserves during starvation? What is the role of the digestive gland in krill during starvation? By how much do krill shrink during starvation and are there differences between sexes? Do both male and female sexually regress at the same rate?
Growth is directly affected by both the quantity and quality of nutrients in the food source. Little is known about the nutritional characteristics of feed or alternative dietary sources for krill. When food is limited how do krill satisfy PUFA requirements? Krill were fed controlled diets in the laboratory to investigate the incorporation of dietary lipid. The nutritional value of
Phaeocystis pouchetii, the diatom Phaeodactylum tricornutum, and bacteria as
The cost of reproduction is a major component of the energy budget in krill. The reproductive investment in male krill was investigated in this study. Lipid classes were used to assess the physiological status of male
reproductive krill. Male mortality rate during reproduction was determined and compared to the rate found in female and non-reproductive krill.
Chapter 2. Dietary related mechanisms of survival in
Euphausia superba: biochemical changes during long term
starvation and bacteria as a possible source of nutrition.
Published in: Proceedings from the SCAR VI Biological
Symposium. B. Battaglia, J. Valencia, D. W. H. Walton,
(editors). Cambridge University Press, 1995, (in press).
Co
-authors: P. D. Nichols and S. Nicol.
Chapter
2
has been removed
f
or
copyright or proprietary reasons.
A version of the article has been published as:
Chapter 3. Changes in the digestive gland of Euphausia
superba during short-term starvation: lipid class, fatty acid
and sterol content and composition.
Published in: Marine Biology, 1993, 117, 441-448. Co-authors: S. Nicol and P. D. Nichols.
3.1 Abstract
During a period of short-term starvation total lipid in the digestive gland of Euphausia superba Dana decreased from 21 to 9% (dry weight)
throughout a 19 Day starvation period. Total lipid per digestive gland decreased significantly during starvation when compared to Day 0
animals, falling from 1960 (±172) to 385 (±81) µg. Polar lipid was the major lipid class utilised during starvation falling from 1510 (±225) to 177 (± 46) µg per digestive gland (76 to 45%). Absolute levels of triacylglycerol fell from 300 (±41) to 76 {± 5) µg, however relative levels remained unchanged. The relative level of free fatty acid increased significantly with starvation (4% to 39%) with absolute levels ranging from 79 (±1) to 156 (±20) µg per digestive gland. Absolute levels of all fatty acids. per digestive gland declined continually until the end of the starvation period. The long chain polyunsaturated acids; eicosapentaenoic (20:5ro3) and docosahexaenoic (22:6ro3), decreased with starvation from 37 to 26% and 15 to 10% respectively whereas the saturated fatty acid, palmitic acid (16:0), increased from 15 to 22%. Cholesterol, the major sterol in this organ,
increased from 17 (±20) to 44 (±13) µg per digestive gland on Day 3 and by Day 19 had returned to levels found in the digestive gland of Day 0
animals to near zero amounts by Day 6. The digestive gland of Euphausia
superba plays a dynamic role during short-term starvation in terms of lipid
content and composition. The relative levels of polar lipids, free fatty acids and cholesterol in the digestive gland may provide reliable indices of the nutritional condition of Euphausia superba in the field. Sterols in the digestive gland are indicative of recent dietary composition of krill and may also be used to quantify dietary input from individual
3.2 Introduction
Antarctic krill are subjected to a marked seasonality in phytoplankton production which may result in limited food availability for up to eight months of the year, but with excess during the spring bloom conditions.
Euphausia superba have been reported as having an extremely high
tolerance to starvation and are able to survive up to seven months without food in the laboratory (Ikeda and Dixon 1982). To date overwintering mechanisms of Euphausia superba are still rather speculative due to the lack
of adequate winter sampling. Several hypotheses have been put forth to interpret survival strategies during these periods of reduced
phytoplankton abundance. Conflicting evidence has been reported on overwintering lipid stores, however recent reports suggest that krill utilise lipid reserves, mainly triacylglycerols, as an energy source in winter
(Hagen 1988, Quetin et al. 1994).
The pathways of lipid catabolism during starvation in Euphausia superba
are unknown. The major site of lipid storage and synthesis in crustaceans is thought to be the digestive gland or midgut gland (Teshima and
Kanazawa 1980, Dall et al. 1992). This organ is also reported as being the principal site of absorption 'of digested food and storage of metabolites (Dall and Moriarty 1983) and marked changes occur in the fatty acids of the digestive gland of the tiger prawn Penaeus esculentus during starvation
(Dall et al. 1992). If the role of the digestive gland in Euphausia superba is
similar to that of other crustaceans, then dietary effects such starvation would be most evident in this organ.
The aim of this study was to determine the lipid class, fatty acid and sterol profiles of the digestive gland of Euphausia superba immediately after capture
3.3 Materials and Methods
Specimens of Euphausia superba were caught on February 2nd, 1991 in the
Prydz Bay region of Antarctica 65°30.00 Sand 77°59.00 E (Figure 2.1) in the top 20 meters of the water column with an RMT 8 net. Krill were
subsequently maintained in darkness in a cold room (0
±
0.5°C) on board RSV Aurora Australis for a 19 day period. Krill were kept in a 90 litre plastic container with sea water filtered through a 0.45µ Millipore filter. Krillsamples were taken every three days during the starvation period (days 0, 3, 6, 9, 12, 15, 19). Carapace lengths were measured and digestive glands were dissected out and frozen in liquid nitrogen. Recent feeding was evident by the dark green colour of the gut contents of freshly caught krill which were designated the Day 0 animals (the day of capture). Samples were stored for 2-12 months in liquid nitrogen prior to extraction. Three analyses of batched digestive glands were performed for each day sampled using a total of seven digestive gland per day (three, two and two digestive glands per analysis). Krill used for this experiment were all of similar size with the daily mean carapace length between 14.75 and 15.75 mm. Three additional digestive glands for each day were freeze dried and weighed individually to
determine water content. The average of these three dry weights per day was used to convert lipid, lipid class, fatty acid and sterol wet weight to their dry weight equivalence. Digestive gland weights were assumed to be equal and individual data reported is a third or a half of the batched sample wet
weight. Procedures for lipid extraction and analysis are the same as those · described in Chapter 2.
3.4.1 Statistics
A one factor analysis of variance was performed for total lipid, lipid class and sterol data for animals on each day of the starvation period compared to the Day 0 animals. Fisher's PLSD multiple comparison test was used and results reported using a significance level of 99%. Percentage fatty acid data were treated by both a correlation matrix analysis and least squares
3.4 Results
3.4.1 Lipid composition and content
Total lipid content decreased throughout the starvation period as would be expected resulting from a significant decrease (12<0.01) in the dry weight of the digestive gland itself from 9.7 (±1.2) mg on Day 0 to 4.3 {± 0.8) on Day 19. Total lipid fell from 1960{±172) µg per digestive gland on Day 0 (21 % dry weight) to 385 {± 81) µg lipid per digestive gland on Day 19 (9% dry weight) {Table 3.1). The amount of total lipid per digestive gland differed significantly between the Day 0 samples and other days. There were no significant differences in the amount of lipid per digestive gland between all other adjacent days (e.g. between Day 3 and 6, Day 6 and 12 etc).
The lipid class composition showed significant differences between the Day 0 and starved animals in the relative levels (ie. as a proportion of total lipid) of both the free fatty acids and polar lipids (Table 3.1). Free fatty acids increased with starvation from 5 to 30% and polar lipids decreased from 77 to 46% {Table 3.1). In terms of the absolute amount of lipid class per digestive gland, polar lipids decreased from 1510 (±225) to 177 {±46)µg with significant differences foun~ between the Day 0 and the starved animals on every day analysed (J;2.<0.01). Significant differences (J;2. <0.01) between all starved and the Day 0 animals were also noted in the absolute level of sterols which fell from 74 {±2) to 19 {±3) µg per digestive gland. There were no significant differences in levels of triacylglycerol in the digestive gland between the Day 0 and the starved animals (Figure 3.1).
3.4.2 Fatty Acids
Table 3.1 Total lipid, lipid class and lipid class ratios of the digestive gland (DG) of Euphausia superba during 19 day starvation. Data are the mean of three analyses± SE,
*
ANOV A comparing each day with day 0 (p<0.01).Day 0 3 6 9 12 15 19
Total Lipid (% dry weight of DG) 21.0±1.0 14.5 ±3.5 21.6 ±3.0 17.5. ±3.5 14.0 ±0.7 14.6 ±4.5 9.0 ±2.2 * Lipid Class (% of total lipid)
Triacylglycerol 16.0 ±4.0 15.5 ±6.6 16.5 ±0.5 18.5 ±6.5 19.0 ±5.0 25.0 ±7.0 20.5 ±2.5 Free Fatty Acid 4.5 ±0.5 14.0 ±4.0 * 20.5 ±8.5 * 22.5 ±4.6 * 30.0 ±0.3 * 24.5 ±5.0 * 29.5 ±0.5 * Polar Lipid 76.5 ±4.5 67.0 ±12 59.0 ±8.0 54.0 ±2.0 45.5 ±4.5 * 46.5±11 * 45.5 ±2.5 *
Sterol 3.5 ±0.5 3.5±1.5 5.0 ±0.0 4.5 ±0.5 5.0 ±0.0 4.5 ±0.5 5.0 ±0.0
Triacylglycerol/Polar Lipid 0.2 0.2 0.3 0.3 0.4 0.5 0.5
:rj' 200 ~
-
00 Q) > ·.c•
Triacylglycerol (/)Q)
00
II Free fatty acid
.
...
"O
Jo< I!)
Polar lipid
Q)
0..
00 la Sterol
::1. 100
' - ' c 0
....
....
...
(/) 0 0..s
0 u "O.
...
. &
,_J0 3 6 9 12 15 19
[image:38.533.83.478.67.348.2] [image:38.533.91.446.452.691.2]Day
Figure 3.1 Lipid composition of total lipid in the digestive gland of Euphausia superba during 19 days starvation. Error bars= SE .
:rj'
•
14:0~ 300
FJ
16:1co7-
00!!I
16:0Q)
> l':;2J 18:4co3
.
......
(/)D
Q) 18:2co6 00....
"O 20
•
18:lco9 Jo<Q)
~ 18:1co7
0..
00
D
18:0~
...
Ea
20:5co3c
Q)
... 10
D
22:6co3 c0
u "O
.
u...
rt! >, ... 0 ... rt! 11.
0 3 6 9 12 15 19
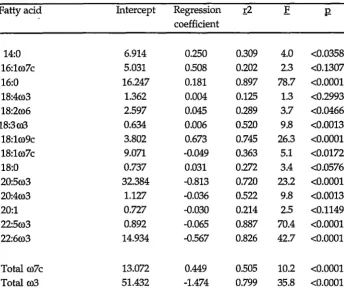
The long-chained polyunsaturated fatty acids; eicosapentaenoic (EPA) and docosahexaenoic (DHA) fell from 301 {± 38) to 26 {± 26) µg and 145 {± 21) to 10 {± 3) µg/ digestive gland respectively. The total ro3 fatty acids in relative terms (ie as a proportion of total lipid) decreased significantly (using least- squares regression analysis; :p.< 0.01) from 50 to 38% over the starvation period. Although absolute levels of the total ro7 fatty acids decreased, in relative terms a significant increase was noted (from 14 to 18%, :p.< 0.01) (Tables 3.2 and 3.3). Absolute levels of 18:lro9c decreased from 45 {± 32) to 9 {± 3)µg per digestive gland while relative levels
increased significantly (:p.< 0.01) from 4 to 9%. The C16 saturated fatty acid (16:0) fell throughout starvation from 164 {± 30) to 22 {± 9) µg per
digestive gland however, relative levels increased significantly (12< 0.01) from 16 to 21 % {Table 3.2 and 3.3). A positive correlation was found between EPA and DHA using a correlation matrix (Table 3.4). This positive correlation was particularly evident between EPA and all C20 ro3 fatty acids. A negative correlation was noted between EPA and 16:0 and between DHA with 16:0. Negative correlations were also evident between these two PUFAs and 18:1ro9c (Table 3.4).
3.4.3 Sterols
Total sterol content in the digestive gland ranged from 0.7- 2% dry weight corresponding to 2- 5.5% of the total lipid. Sterols in the digestive gland in order of elution included: cholest-5-en-3 B-ol (cholesterol), cholesta-5,22E-dien-3 B-ol (22-dehydrocholesterol), cholesta-5 ,24-cholesta-5,22E-dien-3 B-ol ( desmosterol), 5,22E-dien-3B-ol (brassicasterol), 24-methylcholesta-5,24(28)-dien-3 B-ol (24-methylene cholesterol), 24-methylcholest-5-en-3 B-ol (campesterol), 24-ethylcholesta-5,22E-dien-3B-ol (stigmasterol), an
unidentified sterol, ethylcholest-5-en-3 B-ol (sitosterol) and 24-ethylcholesta-5 ,24{28)Z-dien-3B-ol (isofucosterol) (Table 3.5). The unidentified C29 sterol with a relative retention time of 1.50
Table 3.2 Percentage fatty acid composition of total lipid in digestive gland of Euphausia superba during a 19 day starvation period. Data are the mean of three analyses± SE.
Percentage Composition
Day 0 3 6 9 12 15 19
Fatty acid
14:0 8.0 ±0.2 6.6 ±0.3 7.0 ±0.2 8.7±0.6 9.3 ±0.4 10.3 ±0.5 8.0 ±0.7 16:1ro7c 5.3 ±0.4 4.7±0.2 9.9 ±3.6 7.2 ±0.2 7.0 ±0.4 7.5 ±0.1 6.8 ±0.0 16:0 16.5 ± 0.1 16.3 ±0.1 17.6 ±0.7 18.1 ±0.2 19.1±0.5 19.7 ±0.2 20.8 ±0.7 18:4ro3 1.5 ±0.2 1.2 ±0.2 1.3 ±0.0 1.3 ± 0.2 1.4 ±0.1 1.3 ±0.2 1.0 ±0.3 18:2ro6 2.6 ±0.0 2.6 ±0.2 2.2 ±0.l 2.4 ±0.1 2.4 ±0.1 2.4 ±0.0 2.4 ±0.1 18:3ro3 0.7 ±0.1 0.6 ±0.0 0.7 ±0.1 0.7 ±0.0 0.7 ±0.0 0.7 ±0.0 0.8 ±0.0 18:1ro9c 3.8 ±2.6 6.1 ±0.5 6.6 ±0.3 7.9±1.0 9.2 ±0.3 9.9 ±0.1 9.0 ±0.0 18:lro7c 8.6 ±0.1 9.8 ±0.3 8.6 ±0.6 9.6 ±0.5 9.6 ±0.2 9.1 ±0.3 11.2±1.2 18:0 0.8 ±0.0 0.8 ±0.1 0.7 ±0.1 0.7±0.0 1.4 ±0.3 1.1 ±0.0 1.1 ±0.1 20:5ro3 30.8±1.8 32.3 ±0.7 28.3 ±2.1 27.3±1.0 24.0±1.4 23.2 ±0.8 24.7 ±0.2 20:4ro3 1.0 ± 0.0 1.2 ± 0.1 0.9 ±0.l 0.9 ±0.1 0.8 ±0.0 0.8 ±0.0 0.9 ±0.0 20:1 0.9 ±0.1 0.5 ±0.1 0.5 ±0.0 0.5 ± 0.1 0.7 ±0.1 0.5 ±0.1 0.4 ±0.2 22:5ro3 0.8 ±0.0 0.8 ±0.0 0.5 ±0.l 0.5 ±0.1 0.4 ±0.0 0.4 ±0.0 0.5 ±0.0 22:6ro3 14.7 ±0.6 13.6 ±0.0 12.4 ±0.8 11.1 ±0.6 10.2 ±1.4 10.0 ±0.1 10.0 ±1.0
other 4.0 3.0 2.8 3.0 3.8 2.9 2.5
16:1ro7c/16:0 0.3 0.3 0.6 0.4 0.4 0.4 0.3
18:1ro7c/18:lro9c 2.3 1.6 1.3 1.2 1.0 0.9 1.2
total ro7c 13.9 14.5 18.5 16.8 16.6 16.6 17.9
[image:40.828.120.711.104.462.2]Table 3.3 Analysis of percentage fatty acid data of total lipid of digestive gland (n=21) of Euphausia superba during starvation, showing dependent variables: independent variable was "day". All data treated by least squares regression.
Fatty acid Intercept Regression r2 E coefficient
14:0 6.914 0.250 0.309 4.0 <0.0358 16:1co7c 5.031 0.508 0.202 2.3 <0.1307 16:0 16.247 0.181 0.897 78.7 <0.0001 18:4co3 1.362 0.004 0.125 1.3 <0.2993 18:2co6 2.597 0.045 0.289 3.7 <0.0466 18:3co3 0.634 0.006 0.520 9.8 <0.0013 18:1co9c 3.802 0.673 0.745 26.3 <0.0001 18:1co7c 9.071 -0.049 0.363 5.1 <0.0172 18:0 0.737 0.031 0.272 3.4 <0.0576 20:5co3 32.384 -0.813 0.720 23.2 <0.0001 20:4co3 1.127 -0.036 0.522 9.8 <0.0013 20:1 0.727 -0.030 0.214 2.5 <0.1149 22:5co3 0.892 -0.065 0.887 70.4 <0.0001 22:6co3 14.934 -0.567 0.826 42.7 <0.0001
[image:41.535.79.424.204.494.2]'l
Table 3.4 Correlation matrix using percentage composition of individual fatty .acids of the digestive gland of Euphausia superba during a 19 day starvation period (n=7). *Denotes correlations of significance interest which are discussed in the text.
14:0 16:1ro7c 16:0 18:4ro3 18:2ro6 18:3ro3 18:lro9c 18:1ro7c 18:0 20:5ro3 20:4ro3 20:1 22:5ro3 22:6ro3
14:0
16:1ro7c 0.14
16:0 0.59 0.35
18:4ro3 0.24 -0.04 -0.53
18:2ro6 -0.13 -0.98* -0.45 0.18
18:3ro3 0.31 0.36 0.78 -0.37 -0.42
18:1ro9c 0.66 0.37 0.86 -0.44 -0.47 0.39
18:1ro7c -0.03 -0.26 0.61 -0.84 0.0$ 0.45 0.48
18:0 0.6 -0.05 0.66 -0.06 -0.04 0.33 0.66 0.38
20:5ro3 -0.8 -0.46 -0.92* 0.2 0.53 -0.63 -0.9* -0.3 -0.73
20:4ro3 -0.78 -0.64 -0.73 -0.13 0.65 -0.63 -0.68 0.04 -0.54 0.9*
20:1 0.09 -0.36 -0.48 0.85 0.47 -0.17 -0.59 -0.56 0.07 0.29 0.04
22:5ro3 -0.67 -0.7 -0.79 0.16 0.76 -0.5 -0.88 -0.16 -0.54 0.92* 0.9* 0.41
[image:42.828.60.723.174.455.2]Table 3.5 Percentage sterol in the digestive gland of Euphausia superba during a 19 day starv..ation period. Data are the mean of three analyses± SE. * ANOVA comparing each day with day 0 (p<0.01).
Day Sterol
Cholesta-5,22E-dien-3g-ol Cholest-5-en-3g-ol Cholesta-5,24-dien-3g-ol
24-Methylcholesta-5,22E-dien-3g-ol 24-Methylcholesta:5,24(28)-dien-3g-ol 24-Methylcholest-5-en-3g-ol
24-Ethylcholesta-5,22E-dien-3g-ol Unidentified sterol
24-Ethylcholest-5-en-3B-ol
24-Ethylcholesta-5,24(28)Z-dien-3B-ol
# C24 stereochemistry not determined.
Trivial name
22 -Dehydrocholesterol Cholesterol
Desmosterol l!,rassicas terol #
24 -Methylene cholesterol Campesterol
Stigmasterol #
Sitosterol (lso) fucosterol
0 3
6.5 ±1.1 2.3 ±0.2" 59.3 ±2.9 69.8 ±3.2
8.2 ±2.6 17.3±1.4 5.4 ±1.8 0.7 ±0.0 " 1.5 ±0.3 0.6 ±0.0 .. 1.3 ±0.5 0.3 ±0.0 2.1 ±0.6 0.7 ±0.5 8.2 ±0.7 3.5 ±0.6 .. 4.8 ±1.4 2.8±1.8 2.7 ±0.6 1.9±1.4
Percentage Composition
6 9 12 15 19
1.6 ±0.2" 1.0 ±0.0 .. 0.7 ±0.1 " 0.6 ±0.0 .. 0.7 ±0.2" 78.5 ±1.0 .. 75.5 ±0.7 .. 80.3 ±0.7 .. 84.4 ±0.7" 85.9 ±3.2 .. 16.5 ±0.9 20.3 ±0.l .. 17.6 ±0.8 14.3 ±0.5 12.5 ±3.6
[image:43.829.42.807.210.389.2]The absolute levels of total sterols rose from 28 (± 6) µg on Day 0 to 62 (± 17) µg per digestive gland on Day 3 and then decreased to 5 (± 3) µg per digestive gland at the end of the starvation period. Cholesterol and
desmosterol, the main sterols detected, also followed this pattern while all minor sterols ( <10% of the total sterols) had fallen to near zero levels by Day 6 (Figure 3.3).The relative level of individual sterols in the digestive gland changed significantly with starvation. The unidentified C29 sterol
fell
from 8 to 0% during starvation (Figure 3.3, Table 3.5). Cholesterol increased from 59% (± 3) on Day 0 to 85% on Day 19 (± 0.5). Theincremental increase in cholesterol was significant (p<0.01) on each day sampled throughout starvation compared with the digestive gland of the Day 0 krill. Desmosterol increased from 8 (± 3) to 20 (± 0.1)% until Day 12, and then fell to 12 (±4)% by Day 19. There was no significant difference however, in the absolute levels of cholesterol and desmosterol throughout starvation.
-
3"t:l
[image:44.535.81.485.367.662.2]la
...
•
unidentified sterol00
QJ
llJ 22-dehydrocholesterol >
-.i::
<ll
Ill brassicasterol
QJ
00 2
...
Ea sitosterol
"t:l
'""
QJ
D isofucosterol 0...
gf Ill campesterol
...
§ EifJ 24-methylenecholesterol
...
....
1 Ill stigm.asterol
... <ll 0
s-0 u ... 0-. '"" ~(/) 0 ... _Jl.m I
0 3 6 9 12 15 19
Day
Figure 3.3 Sterol composition of total lipid in the digestive gland of
Euphausia superba during 19 days starvation (cholesterol and
3.5 Discussion
The digestive gland in crustaceans is thought to play a major role in lipid metabolism. This organ is generally regarded as having several functions, including digestion, absorption and short-term storage of lipids from the gut (Dall et al. 1992). In the present study, the lipids in the digestive gland · of Euphausia superba appeared to be utilised as an energy source
throughout short-term starvation, as evidenced by the substantial decrease in total lipid. Major changes occurred in the relative levels of individual lipid classes in the digestive gland. Polar lipid was the major constituent, which may be a reflection of the lipid constituents of the algal diet of
Euphausia superba. Volkman et al. (1989) reported that polar lipid was the
dominant lipid class for microalgal species commonly used in mariculture harvested during logarithmic growth phase, with levels ranging from 44 to as high as 99°/~ of the total lipid. Similarly, polar lipid was the dominant lipid class in both logarithmic and stationary phase harvested Phaeocystis pouchetii, a major southern ocean algal species (Nichols et al. 1991). Polar
lipids of the digestive gland decreased substantially during starvation in this study. By Day 12, polar lipid levels were equivalent to those found in the whole body of Euphausia superba which are approximately 40-50% of
the total lipid (Chapter 4, Virtue et al. 1993a).
Triacylglycerols in contrast, although decreasing marginally throughout starvation, increased in proportion to the decreasing weight of the digestive gland. Triacylglycerols have been reported as being a form of overwintering lipid in Euphausia superba (Hagen 1988), however, in this
study triacylglycerols in the digestive gland were not utilised in significant quantities compared to polar lipids during short-term starvation. The triacylglycerol/polar lipid ratio increased during
starvation from 0.2, indicative of a typical algal ratio, to 0.5 which is only half that of the ratio for whole Euphausia superba (approximately 1.0)
days (unpublished data) which would imply that both lipid classes are metabolised at similar rates.
Relative levels of free fatty acids in the digestive gland increased during starvation. A rise in unesterified fatty acids during starvation is usually a result of the lipolysis of triacylglycerol which is a major energy yielding process (Stryer 1988). In the digestive gland of Euphausia superba, however,
it would appear that polar lipids are being metabolised as a source of metabolic energy, contributing to the endogenous pool of free fatty acids, which increases with starvation.
During ~tarvation, shrinkage has been reported in Euphausia superba which
results from body tissue break down. Ikeda and Dixon (1982) reported shrinkage was the mechanism responsible for krill surviving up to 211 days without food in the laboratory. They determined, using C:N ratios, that body protein rather than lipid was being utilised as the major energy source during starvation. Breakdown of body tissue would presumably result in the release of a substantial amount of polar lipid from cell
membranes. As polyunsaturated fatty acids (PUFA) are major constituents of the polar lipid fraction in Euphausia superba (Chapter 4, Virtue et al.
1993a), catabolism of polar lipid during shrinkage would entail a concomitant release of PUFA. In this study polar lipid in the digestive gland remained the dominant lipid class, although absolute levels decreased with starvation. The polar lipids of body cells, essentially the phospholipid and glycolipid of the lipid bilayer of cell membranes, may be mobilised and transported to the digestive gland either for
redistribution or as a source of metabolic energy during starvation, however this is impossible to validate further without the use of labelled substrates. Alternately, changes in the levels of polar lipids may simply reflect stored dietary lipids being utilised during short-term starvation. Nicol et al. (1992) reported shrinkage of Euphausia superba occurred
Although the lipid class profile resembled that expected in dietary
phytoplanktonic species, the fatty acid profile in the digestive gland does not appear to be solely the result of absorption and storage of dietary fatty acids. The total ro3 fatty acids in the digestive gland were initially as high as 50% of the total fatty acids decreasing to 38% during starvation. Of this initial 50%, up to 45% was contributed by the essential fatty acids, EPA and DHA, which decreased to 35% during starvation. Dall et al. (1992) showed that a large part of the newly-assimilated fatty acids are
incorporated into the polar lipid fraction of the digestive gland of the tiger prawn, Penaeus esculentus, for transport to other tissues.
Levels of EPA and DHA in algal species on which krill are reported to graze are substantially lower than those found in the digestive gland in this study and hence newly-assimilated fatty acids cannot account for these high PUF As levels. Nichols et al. (1986) for example reported levels of both EPA and DHA to be around 10% in the Antarctic sea ice diatom
Nitzschia cylindrus and levels reach 20% in sea-ice diatom communities
(Nichols et al. 1993). The abundant Antarctic prymnesiophyte Phaeocystis pouchetii has quite low levels {3-4%) of EPA and DHA (Nichols et al. 1991,
Virtue et al. 1993a).
A possible carnivorous dietary input may be responsible for high PUF A levels in the digestive gland or this fatty acid profile may simply be indicative of the biochemical capabilities of Euphausia superba. Chain
elongation and desaturation of dietary fatty acids could be occurring in this organ, with the amount of conversion decreasing with increasing starvation. The conversion of exogenous shorter chain fatty acids to PUF A has been suggested in Euphausia superba fed a diet deficient in 20:5ro3
(Chapter 4, Virtue et al. 1993a). Dall et al. (1992) suggested that the
catabolism of cell membranes during starvation was a sufficient source of 20:5ro3 and 22:6co3 and that these fatty acids may not be essential in the tiger prawn Penaeus esculentus.
positive correlation was also found between EPA and other C20ro3 fatty acids. Although all fatty acids decreased in absolute levels over starvation, in relative terms the saturated fatty acids increased. Preferential utilisation of PUF As compared to saturated fatty acids throughout starvation was evident in the negative correlation found between EPA and 16:0 (p= -0.92) and between DHA and 16:0 (p= -0.92). Negative correlations were also found between PUFAs and both 14:0 and 16:0, however not to the same extent. Monounsaturated fatty acids had a similar profile to saturated fatty acids. Negative correlations were found between PUFAs and mono unsaturated fatty acids in particular 18:lro9c.
Cholesterol was the major sterol found in the digestive gland of Euphausia superba and no significant differences were detected in absolute levels of cholesterol and desmosterol throughout starvation. Cholesterol is
assumed to be an important constituent of cell membranes and subcellular structures in crustaceans (Teshima 1982). Crustaceans do not have the capacity for de novo sterol synthesis but are able to dealkylate dietary C2s
and C29 sterols to cholesterol. Using radioisotope labelled sterols, crustaceans have been reported to convert 24-methyl cholesterol and brassicasterol to cholesterol via a desmosterol intermediate (Teshima 1982).
The majority of sterols found in the digestive gland of Euphausia superba
probably reflect that of their diet with some in vivo sterol inter conversion. The digestive gland may be the site of sterol conversion, where dietary sterols are dealkylated to cholesterol and desmosterol. In this study
absolute levels of minor sterols of algal origin were substantially depleted by Day 6 of starvation. The rate of depletion of sterols of algal origin in the digestive gland may be indicative of the rate of sterol conversion in
Euphausia superba.
Just as algal pigments, such as xanthophyll, can be used to indicate phytoplankton composition in seawater samples, analysis of the sterol as well as photosynthetic pigment composition in the digestive gland has the potential to provide relevant information regarding recent feeding activity
of Euphausia superba. Chlorophyll degradation products have been used to