DEVELOPING A BLIND IMAGE QUALITY ASSESSMENT (BIQA)
MODEL BASED ON IMAGE LOCAL CONTRAST FEATURES
WAN ZAFIRAH BINTI M. ZAIN
DEVELOPING A BLIND IMAGE QUALITY ASSESSMENT
(BIQA) MODEL BASED ON IMAGE LOCAL CONTRAST
FEATURES
WAN ZAFIRAH BINTI M. ZAIN
This report is submitted in partial fulfilment of the requirements
for the degree of Bachelor of Electronic Engineering with Honours
Faculty of Electronic and Computer Engineering
Universiti Teknikal Malaysia Melaka
8
l!it!l
~I
!,.'tj., -:---:1-p
_
.:.b.
:
-F-
.r:r.) UNIVERSITl TEKNIKAL MALAYStA. MEL.AKA Tajuk ProjekSesi Pengajian
UNIVERSITI TEKNIKAL MALAYSIA MELAKA FAKULTI KEJUTERAA ELEKTRONIK DA KEJURUTERAA KOMPUTER
BORANG PENGESAHAN STATUS LAPORAN PROJEK SARJANA MUDA U
DEVELOPING A BLIND IMAGE QUALITY ASSESSMENT (BIQA) MODEL BASED ON IMAGE LOCAL CONTRAST FEATURES
2.0JS
a
QJ_9-Saya
WAN
.
ZAFLRAHJHN.Jl
_
M
_. __
Zt.\lli
_
mengaku membenarkan laporan Projek Sarjana Muda ini disimpan di Perpustakaan dengan syarat-syarat kegunaanseperti berikut:
I. Laporan adalah hakmilik Universiti Teknikal Malaysia Melaka.
2. Perpustakaan dibenarkan membuat salinan untuk tujuan pengajian sahaja.
3. Perpustakaan dibenarkan membuat salinan laporan ini sebagai bahan pertukaran antara institusi pengajian tinggi.
4. Sila tandakan ( "):
D
SULIT*D
TERHAD*[Z]
TIDAK TERHADAlamat Tetap:
1QI_
__ J_Q_Q
_i_L_ _ _KG_IE
.
R.SJ
J.
S.UN
WJJ:U~~AH~AIV.
..
~-~'--~-~J~_QIEMQH
,_
P.
_
ERAK
Tarikh : .l1!l.4/7.Q_I_~
(Mengandungi maklumat yang berdarjah
keselamatan atau kepentingan Malaysia
seperti yang termaktub di dalam AKTA RAHSIA RASMI 1972)
(Mengandungi maklumat terhad yang
telah ditentukan oleh organisasi/badan di mana penyelidikan dijalankan.
Disahkan oleh:
(COP DAN TANDATANGAN PENYELIA)
DR. REOZUAN llN AIOUL M~
Senior lKturN
F1a1lty Of Electronic l Cem,uter Enci~ Unlversi11 Ttknlbl M~ MNb (llfeMt
Han& Tuai! hiY'
76100 OuriAn TUflllll, MeliU
Tarikh : .l1!lP7-Q_I_~
DECLARATION
I declare that this report entitled "Developing a blind image quality assessment
(BIQA) model based on image local contrast operator" is the result of my own work
except for quotes as cited in the references .
Signature
..
.
..
~
.:
... .Author WAN :Z..l\flQA+l &INTI M·ZAIN
APPROVAL
I hereby declare that I have read this thesis and in my opinion this thesis is sufficient
in terms of scope and quality for the award of Bachelor of Electronic Engineering with
Honours.
Signature . ...
~
... · ... .Supervisor Name
Date
q
t
r
t
.
t
DEDICATION
I dedicate my dissertation work to my family and many friends. A special feeling of
gratitude to my beloved family especially to my loving parents, M. Zain bin Ag. Soh
and Zainah binti Shamsudin. Their encouragement and guidance has always be an
ABSTRACT
This project focuses on image quality assessment (/QA) especially when we
have problems on how to assess the quality of an image without presence any of
reference information. Blind !QA (BIQA) aims to appraise the perceptual quality of a
distorted image without information regarding its reference image. In the past, Bf QA
models usually predict the image quality by utilizing the transform-based quality
predictive features. This approach, however, can be computationally expensive due to
the need of image transformation process. This project attempts to alleviate this by
developing a transform-free Bf QA model that operates based on statistical
characteristics of two image local contrast operators namely Gradient Magnitude
(GM) and Laplacian of Gaussian (LOG). Relevant quality predictive features were
first extracted based on image local contrast operators' statistical characteristics. A
quality prediction model was then developed through support vector regressor (SVR)
utilising the extracted features. The model's performance was analysed through
comparison with several available Bf QA models in terms of prediction accuracy,
11
ABSTRAK
Fokus projek ini adalah berkaitan dengan penilaian kualiti sesuatu imej (!QA)
terutamanya bagi situasi dimana penilaian tersebut perlu dilakukan tanpa apa-apa
maklumat rujukan. Penilaian kualiti imej tanpa maklumat rujukan (Bf QA) bertujuan
untuk menilai persepsi kualiti tersebut ke alas kecacatan imej tersebut tanpa
maklumat yang berkaitan dengan imej asal. Model-model Bf QA terdahulu sering
meramal kualiti imej dengan menggunakan ciri ramalan kualiti yang memerlukan
proses transformasi. Pendekatan ini bagaimanapun boleh dikira mahal disebabkan
oleh keperluan proses transformasi. Projek ini cuba mengatasi masalah tersebut
dengan membangunkan sebuah model BIQA tanpa transformasi yang broperasi
berdasarkan statistic dua pengendali kontra tempatan sesuatu imej, iaitu 'Gradient
Magnitude' (GM) dan 'Laplacian of Gaussian' (LOG). Projek ini bermula dengan
mereka ciri ramalan kualiti berdasarkan statistik pengendali kontra tempatan
tersebut. Kemudian, satu model ramalan kualiti dibangunkan melalui 'Support Vector
Regression' (SVR) menggunakan ciri ramalan yang direka. Prestasi model dianalisis
melalui perbandingan dengan beberapa model Bf QA yang ada dalam bentuk
ACKNOWLEDGEMENTS
I would like to express my appreciation to my parents for their
willingness to send me to UTeM to pursue the course I wanted which is
Bachelor of Electronic Engineering. Other than financial support, they always
give me a lot of encouragement to handle the stress that I faced during my
university life.
In addition, I want to thank my supervisor, Dr. Redzuan bin Abdul Manap for his guidance during this final year project, from the beginning until
the end. Dr. Redzuan always willing to share his thoughts and teach me a lot of
extra knowledges which help on this project. Although he is full of schedules as
lecturer, and many other final year students' supervisor, Dr. Redzuan always make his time to follow up with my progress. I am very thankful to have Dr.
Redzuan as my supervisor.
Furthermore, I want to thank my lecturers for their help. The lecturers
have taught me a lot of programming basics. These basics have helped me during my final year project. Finally, thanks to all my friends who helped me a
lot in completing my final year project. Without them, it is difficult for me to
complete this report.
TABLE OF CONTENTS
Declaration Approval Dedication Abstract Abstrak AcknowledgementsTable of Contents
List of Figures
List of Tables
List of Symbols and Abbreviations
List of Appendices
CHAPTER 1 INTRODUCTION
1 . I Introduction
1.2 Objectives
1.3 Scope
1.4 Problem statement
VI
1.5 Thesis layout 6
CHAPTER2BACKGROUNDSTUDY
72.1 Distortion Specific No-reference IQA algorithm 8
2.2 Non Distortion Specific No-reference IQA 9
2.2.1 Leaming-based IQA 9
2.2.2 Natural Scene Statistic (NSS)-based IQA I 1
CHAPTER 3
METHODOLOGY
173.1 Process flow of Final Year Project (FYP) 17
3.2 Difference Mean Opinion Score (DMOS)
20
3.3 Database creation 21
3.4 Feature Extraction 21
3.4.1 Gradient of Magnitude (GM) and Laplacian of Gaussian (LOG) 22
3.4.2 Joint Adaptive Normalization 23
3.4.3 Statistical Feature Description 26
3.4.4 BIQA Prediction Model Learning 31
3.4.5 Download Libsvm and the compiler 32
3.4.6 Generate random number of image (rand perm) 32
3.4.7 Database creation in 6 columns for size of image, DMOS value, feature
extraction, ref image, type of distortion and group of distortion 33
3.4.8 Cross validation to find cost and gamma 33
3.5 Performance Evaluation
3.5.1 Spearman's rank order correlation coefficient (SROCC)
3.5.2 Pearson linear correlation coefficient (PLCC)
3.5.3 Root mean-squared error (RMSE)
CHAPTER 4 RES UL TS AND DISCUSSION
4.1 Experimental setup
4.1.1 Databases and Evaluation Protocols
4.2 Call image from the database using MATLAB
4.3 Feature extraction
4.4 Support Vector Regression
4.4.1 Generating training and test set
4.4.2 Cross Validation to find Cost and Gamma
4.4.3 SVM training and test
CHAPTER 5 CONCLUSION AND FUTURE WORKS
5.1 Project Summary
Vlll
[image:14.600.61.520.174.726.2]LIST OF FIGURES
Figure 3 .1 : General flowchart of Final Year Project 19
Figure 3.2 : Flowchart of the process
20
Figure 3 .3 : The templates used for computing GM and LOG responses 23
Figure 3.4 : The GM and LOG maps as well as their marginal distribution before
(middle column) and after (right column) joint adaptive normalization. (a) Houses ;
(b) Hats; and (c) Chessboard. 25
Figure 3.5 : The profile of GM and LOG signals along the three lines (highlighted in
red) A, Band C in (a). (b) and (d) show the GM and LOG profiles before JAN, while
(c) and (e) show the corresponding profiles after JAN. 26
Figure 3.6 : Marginal probabilities of PG and PL 28
Figure 3.7 : The independency distributions QC and QL 30
Figure 4.1 : New dataset for the proposed model 38
Figure 4.2 : MATLAB code to call an image from the developed database 39
IX
Figure 4.4 : MATLAB code to display the requested image 40
Figure 4.5 : The called image (image 10) 40
Figure 4.6 : Code for feature extraction 41
Figure 4.7 : Features value of all image 42
Figure 4.8 : Randperm data for 29 reference image from LIVE database. 44
Figure 4.9 : SROCC and PLCC comparison among competing models 45
Figure 4.10: Graph of RMSE performances 47
Figure 4.11 : Median SROCC values over l 000 runs for each distribution in the LNE
database 50
Figure 4.12 : Median PLCC values over 1000 runs for each distortion in the LIVE
database 52
Figure 4.13 : Median RMSE values over 1000 runs for different distortion in the LIVE
x
LIST
OF
TABLES
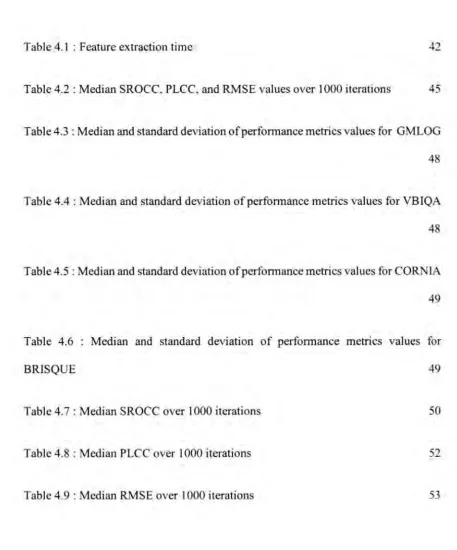
[image:16.603.60.518.193.744.2]Table 4.1 : Feature extraction time 42
Table 4.2 : Median SROCC, PLCC, and RMSE values over 1000 iterations 45 Table 4.3 : Median and standard deviation of performance metrics values for GM LOG 48
Table 4.4: Median and standard deviation of performance metrics values for VB I QA
48
Table 4.5: Median and standard deviation of performance metrics values for CORN IA 49
Table 4.6 : Median and standard deviation of performance metrics values for
BRISQUE 49
Table 4. 7 : Median SROCC over I 000 iterations 50
Table 4.8 : Median PLCC over 1000 iterations 52
Xl
LIST
OF
SYMBOLS AND ABBREVIATIONS
BIQA BIQI BLIINDS- II BRJSQUE CORNIA DMOS DS FR GM IQA JAN LOG NDS NR NSS PLCC RBF RMSE
Blind Image Quality Assessment
Blind Image Quality Indices
Blind Image Integrity Notator using OCT statistic
Blind Referenceless Image Spatial Quality Evaluator
Codebook Representation for No-Reference Image Assessment
Different Mean Opinion Score
Distortion-specific
Full-reference
Gradient Magnitude
Image Quality Assessment
Joint Adaptive Normalization
Laplacian of Gaussian
Non-distortion-specific
No-reference
Natural Scene Statistic
Pearson Linear Correlation Coefficient
Radial Basis Function
RR
SROCC
SVM
SVR
VB I QA
Reduce-reference
Spearman's Rank Order Correlation Coefficient
Support Vector Machine
Support Vector Regression
X11
Visual Saliency Guided model for Blind Image Quality
LIST
OF
APPENDICES
APPENDIX A: Codes for save 982 image in MATLAB
APPENDIX B: Codes for calling image
APPENDIX C: Feature Extraction
APPENDIX D: Randperm Data
APPENDIX E: Group for distortion image (6 column)
APPENDIX F: Cross validation (optimise value cost and gamma)
APPENDIX G: SVM Training and Test
APPENDIX H: Test predict score for 1 image
XllJ
62
63
64
65
66
67
70
CHAPTER I
INTRODUCTION
1.1 Introduction
As the technology in our country is fast developing, we can see there is an increase
amount of digital images. It is very important to have reliable methods to evaluate the
quality of these images. Image quality assessment (IQA) attempts to determine visual
quality or analogically, the total of distortion in a given image. There are factors which
determine image quality for examples, noise, dynamic range tone reproduction, colour
accuracy, distortion, contrast, exposure accuracy, lateral chromatic aberration,
sharpness, vignette, artifacts, etc. The distortions will occur in any digital image
processing and it cannot be avoided. (IQA) had become important aspect in various
computer vision and image processing application. Application that related with image
2 enhancement, image search and retrieval, image recognition like an image tagging in the facebook.
(IQA) is a basic but quite challenging problem in the field of image processing.
Since the Human Visual System (HVS) is a definitive recipient and mediator of the
visual substance, subjective assessment speaks to the most dependable quality
assessment technique. Since human observer are definitive users especially in most of the multimedia applications, the most precise and also credible way to assessing the quality of images is through subjective assessment. However, subjective assessment is based on human observation mechanism and it take a long time and quite expensive, making it difficult to design in practical applications. Moreover, subjective experiments are more complicated by many factors including viewing distance, display device, lighting condition, subjects' vision ability, and subjects' mood.
Therefore, it is important to design mathematical models that are capable of predicting
the quality evaluation of an average human observer. Particularly when ongoing
calculation is wanted. To beat these restrictions, numerous IQA methods have been proposed over the past years to evaluate the quality ofimages in agreement with human
quality perception automatically.
Numerous IQA model have these objective IQA algorithm are beneficial in condition of repeatability and scalability rather than subjective assessment. The goal of objective IQA is to design mathematical models that can predict the quality of still image accurately and automatically by producing computer program. An ideal
objective IQA method should be able to mimic the quality predictions of an average
3
Existing objective IQA models can be classified into three categories based on the
availability of the original (reference) image, which is considered to be distorted-free
or perfect-quality image. There are Full-reference (FR), Reduce-reference (RR), and No-reference (NR). Full-reference (FR) model need full information of the reference
image to predict the quality of the degraded or distorted images. For example Zhou
Wang [I] develop a Structural Similarity Index (SSIM) method to handle color
images, predict contrast change and mean shift. This algorithm is based on the concept that human visual system is highly adapted for extracting structural information from
an image. So from the available image information in the original and distorted image,
a quality measure is constructed.
The (RR) algorithm provides a practical solution for automatic image quality
evaluations in various applications where only need partial information of the
reference image. In [2], Abdul Rehman developed one of the RR-I QA method based
on SSIM that shown to be a good indicator of perceptual image quality. Specifically,
they extract statistical features from a multiscale multiorientation divisive
normalization transform and develop a distortion measure by following the philosophy
in the construction of SSIM.
The last classification of IQA is No Reference IQA or Blind IQA (BIQA) where
there is no need of any information of the reference image. In many practical applications, information that related with the reference is unavailable, and thus BIQA algorithm are highly desired. For example Peng Ye [3] have propose BlQA model
approach using visual codebooks. A visual codebook consisting of Gabor-filter-based
local features extracted from local image patches is used to capture complex statistics
4
However, when evaluating images with a particular type of distortion, it does require
examples with the same or similar distortion for training.
1.2 Objectives
The aim of this project is to develope a BIQA model that operates on the image
spatial domain in order to predict the quality of an image consistent with human
perceptual measures. The aim can be achieved by fulfilling the following objectives :
i. To extract relevant quality predictive features based on image local
contrast operators' statistical characteristics.
ii. To develop a quality prediction model through support vector regressor
(SVR) utilising the extracted features.
lll. To analyse the model's performance through comparison with several
available BIQA models in terms of prediction accuracy, generalisation
capability as well as computational requirements.
1.3 Scope
This project will focus on the BIQA. In general, BIQA algorithms can be classified
into two categories which are distortion-specific (DS) and non-distortion-specific
(NDS), depending on the previous knowledge of the distortion type. Distortion that
affects the image is assumed to be known in the OS BIQA, where it is quantified in
isolation of other factors. Opposite to DS NR-IQA, the previous knowledge of
distortion type is not considered by NOS BIQA algorithms. The quality score is given
through assumption that the image to be assessed has similar distortion type to those
in the training database. The project focus on NDS BIQA.
This project will use quality predictive features extracted in spatial domain derived
5
procedure to jointly normalize the GM and LOG features, and to show that the joint
statistics of normalized GM and LOG features have desired aspect for the BIQA task.
GM and LOG features are basic element that are commonly used to form image
semantic structure. They are also strong features to predict image local quality.
This project uses LIVE IQA Database [ 4] to train the model. The LIVE database
consists of 982 images and 779 of the images is distorted images, generated from 29
original images by processing them with 5 types of distortions at various levels. The
distortions involved in the LIVE database are JPEG2000 compression (JP2K), JPEG
compression (JPEG), additive white noise (WN), Gaussian blur (GB) and simulated
fast fading Rayleigh channel (FF).
Regression learning for this BIQA model is done by usmg Support Vector
Regression (SVR). SVR is used because it is the simplest SVR and also can get the
good performance. To assess the performance of a BIQA method, three scores that
measure the consistency between the results of a BIQA model and the subjective
DMOS/MOS scores are generally used which are Spearman rank order correlation
coefficient (SRC), which measures the prediction monotonicity while the Pearson
correlation coefficient (PCC) and the root mean squared error (RMSE), which measure
the prediction accuracy.
1.4 Problem statement
Previous BIQA models often utilize transform-based quality predictive features to
perform their quality prediction. This approach, however can be computationally
expensive due to the need of image transformation process. Transform-based quality
prediction is more complicated since it requires a lot of process. It also taking a lot of