Stereoscopic Image Quality Assessment Method based
on Binocular Combination Saliency Model
Yun Liua, Jiachen Yang*a, Qinggang Mengb, Zhihan Lvc, Zhanjie Songd, Zhiqun Gaoa
aSchool of Electronic Information Engineering, Tianjin University, Tianjin, China. bDepartment of Computer Science, School of Science at Loughborough University, UK cShenzhen Institute of Advanced Technology, Chinese Academy of Sciences, Shenzhen,
China.
dSchool of Science, Tianjin University, Tianjin, China
∗Corresponding Author, Email:[email protected], Tel: +8613821820218
Abstract
The objective quality assessment of stereoscopic images plays an important role in three-dimensional (3D) technologies. In this paper, we propose an effective method to evaluate the quality of stereoscopic images that are af-flicted by symmetric distortions. The major technical contribution of this paper is that the binocular combination behaviors and human 3D visual saliency characteristics are both considered. In particular, a new 3D saliency map is developed, which not only greatly reduces the computational com-plexity by avoiding calculate the depth information, but also assigns appro-priate weights to the image contents. Experimental results indicate that the proposed metric not only significantly outperforms conventional 2D quality metrics, but also achieves higher performance than the existing 3D quality assessment models.
Keywords: Binocular vision, visual attention, image quality, human visual system
1. Introduction
With the development of three-dimensional (3D) technologies, more and more 3D contents for 3DTV and 3D cinema are produced. However, it also brings us many new issues and challenges [1][2][3]. During the process of stereoscopic content creation, transmission, processing and display, various
distortions that affect the quality perception may be introduced [4]. Conse-quently, it is very necessary to build an effective tool to measure the quality of stereoscopic images. Over the past decades, numerous 2D image qual-ity assessment (IQA) methods have been proposed [5][6][7]. Gao et al. [8] proposed an image quality assessment model based on multiscale geometric analysis, which has strong links with the human visual system. Focus on the problem of color distortion, He et al. [9] proposed a color fractal structure model to evaluate the quality of image. Later, they [10] proposed an effec-tive universal blind image quality assessment method by using the sparse representation of the tertiary natural scene statistics, which achieved great results in image quality assessment area. However, most of existing methods fail to effectively evaluate the quality of 3D images. Compared with the two-dimensional (2D) images, 3D images provide the sense of depth perception, which makes the quality assessment for 3D images more difficult.
To solve the aforementioned problem, different stereoscopic image quality assessment (SIQA) algorithms have been designed, which can be categorized into the subjective and objective assessment models. Subjective assessment model represents the direct reflection of the human visual system (HVS), thus it is regarded as the most reasonable and precise assessment method. Lots of works have been progressing steadily [11] [12]. Zhou et al. [13] built a public 3D images database based on subjective quality assessment method. Lee et al. [14] proposed a paired comparison based on a subjective experi-ment to minimize the effect of subject’s limited 3D experience. However, the subjective model is time-consuming and impractical for online applications. Therefore, the objective model, which can be used to reliably predict the quality of stereo images, attracts more attentions [15][16].
Because of the depth information, it is not an easy matter to design an effective objective method to evaluate the quality of stereoscopic images. Recently, lots of studies have been proposed which can be mainly divided into three categories. The first category is to apply the 2D IQA metrics to evaluate the quality of stereoscopic images, such as VIF [17], PSNR, SSIM [18], MS-SSIM [19], GSM [20] and others [21][22]. Many researchers simply applied 2D IQA algorithms to the left and right images separately, and took the average of the left and right quality scores as the final score [23][24]. However, these methods are inefficient in predicting the quality of stereoscopic images. The second category of models takes the depth information into account. For example, Campisi et al., by considering the additional depth information in stereoscopic images, built a quality evaluation method [25]. Benoit et al. [26]
combined the image quality and depth quality together to calculate the final image quality. Hewage et al. [27] proposed an approach by comparing the contours of original and impaired depth maps. Similarly, Xing et al. [28] and Boev et al. [29] also developed the effective metrics to measure the quality of stereoscopic images based on depth information.
Although great efforts have been conducted to evaluate the quality of stereoscopic images, it is still difficult to build a precisely evaluation method by using the real 3D information, such as disparity map or cyclopean image. The third approach is then developed based on the perceptual characteris-tics of human binocular visual system (HVS) [30][31]. Ha et al. [32] built a perceptual quality assessment metric by considering the factors of tem-poral variation and disparity distribution. Maalouf et al. [33] integrated the left and right images into a cyclopean image to simulate human brain perception to derive a quality index. Shao et al. [34], based on binocular energy responses, proposed another effective quality assessment method of stereoscopic images. What’s more, Chen et al. [35] addressed binocular ri-valry issues by modeling the binocular suppression behavior and developed an effective model to measure the quality of stereoscopic images. Lin et al. [36] integrated the binocular combination behavior into the existing 2D ob-jective metrics and built the final quality evaluation metric. These models achieve better results than the above two types of approaches, which in-dicates that the human binocular characteristics paly an important role in stereoscopic image quality assessment. However, all the above SIQA mod-els neglect human visual selectively sensitivity characteristics. When human view the stereoscopic images, human eyes attempt to focus on the object that they are interested in, which is called visual saliency attention [37][38]. Xiu et al. [39] then proposed an objective saliency structure stereoscopic image quality assessment model based on the saliency map of each eye view and the texture sensitivity, and the experimental results indicated that the pro-posed metric achieves high consistent with human vision perception. It also indicates that human visual saliency map is helpful to predict the quality of stereoscopic images.
In this paper, inspired by previous works, we take advantage of the rela-tionship between binocular combination perception and visual stereoscopic saliency information to deal with the stereoscopic image quality assessment problem. In particular, the effect of binocular rivalry between left and right eyes is introduced to get a reasonable binocular combination model. A novel stereoscopic saliency detection framework is also derived and incorporated to
the binocular combination information by assigning various weights to differ-ent regions with differdiffer-ent levels of importance. Since binocular combination perception quality intrinsically reflects the quality of stereoscopic image, so the method of combining stereoscopic saliency sense with binocular combi-nation model attains much accurate quality assessment results. The main contributions of this work are as follows: (1) A developed 3D visual saliency map for stereoscopic images is built which greatly reduces the computational complexity. (2) By considering the binocular combination properties, we use the proposed 3D visual saliency map to assign higher weights to more per-ceptually important area, which plays an important role in precisely quality assessment of stereoscopic images.
The remainder of this paper is organized as follows. In Section 2, a review of related works and backgrounds on human visual combination behavior and visual saliency detected models is presented. The overall proposed 3D QA framework is described in Section 3. Section 4 is the experimental results and performance analysis. Finally, Section 5 concludes this paper with a discussion and the imagination of our future work.
2. Related works and background
In order to explain the proposed SIQA model in Section 3, here we give a brief review of relevant works and backgrounds.
2.1. Human binocular combination perception
Human binocular vision is a complex visual process and plays an impor-tant role in depth perception. How the visual system processes the signals perceived by two eyes to present the real world is a fundamental problem that has aroused psychophysical and physiological investigations. Important clues about this process may be derived from data about the perceived brightness of surface regions under binocular viewing conditions, the U-shaped data of Fechner’s paradox that violates binocular brightness summation, and the effects of different combinations of monocular and binocular contours and surface luminance differences on threshold sensitivity to monocular flashes of light [40]. A large number of works have been done on how two slightly different monocular images fuse to a combined image and generate depth perception. Here we briefly give a short description of the recent findings of binocular vision, which are related to this work, as follows.
1) Eye-Weighting (EW) Model: A linear model is proposed to explain the binocular combination perception [41], based on the monocular luminance or quadratic of luminance, which is described as:
C = [(wLIL)β + (wRIR)β] 1
β. (1)
where c is the stimulated combination image, wL and wR are the weighting
factors of left and right eyes respectively, β = 1; 2 means monocular lumi-nance or quadratic of lumilumi-nance respectively. ILandIRare the left and right
images, respectively.
2) Vector Summation (VS) model: This model indicates that the binoc-ular brightness perception is the sum of two orthogonal vectors with some normalization [42], which is given by:
C =
q E2
L+ER2 +ELER. (2)
where EL and ER are left eye and right eye inputs, respectively
3) Gain Control (GC) model: This model is contrast dependent for the binocular combination [43]:
C =gLIL+gRIR. (3)
where gL and gR are the energy responses of the left and right images,
re-spectively,
4) Neural Network (NN) model: Cogan et al. [44] proposed the two channels model based on the separate monocular and binocular channels.
C = EL
1 +ER
+ ER
1 +EL
+ 0.1ELER. (4)
The above discussions here provide basic theories used in the proposed SIQA framework, which are introduced in the next section.
2.2. 3D visual saliency map
When people watch objects in a scene, human eyes will receive a con-siderably large amount of information. Human visual system can reduce the complexity of scene analysis to deal with the large amount of informa-tion. Visual attention is one of the most important mechanisms to predict
locations that people are likely to look at and be interested in. Over the past years, many studies have proposed many computational models of vi-sual attention to extract the saliency map in 2D images, such as Itti-Koch model [45], Stentiford model [46], Spectral residual hypothesis model [47], Hu-Rajan-Chia [48] model and graph-based visual saliency (GBVS) model [49], which play an important role in various areas, including retargeting [50], visual coding [51] and quality assessment [52].
Compared to 2D images, stereoscopic images bring the depth informa-tion, which will affect human viewing behavior. The challenge is how to successfully combine the depth cues and the 2D features together. With the development of stereoscopic display, many computational models of visual attention for stereoscopic 3D images have been proposed which can be di-vided into three types: depth - weighted model, depth - saliency model and stereo - vision model. Due to page limit, here we just give a short description as follows:
1) Depth-weighted model: In general, these models take the depth infor-mation as the weighting factor of the 2D saliency. Zhang et al. [53] proposed a stereoscopic visual attention model for 3D video based on multiple per-ceptual stimuli. Chamaret et al. [54] designed a Region of Interest (ROI) extraction method for adaptive 3D rendering.
2) Depth-saliency model: These models are built by incorporating depth saliency map into the traditional 2D saliency detection methods. Ouerhani et al. [55] took the depth feature as additional information and finally com-bined with 2D saliency map to obtain the 3D saliency map. Ciptadi et al. [56] designed a 3D saliency detection model based on the feature of color and depth information. Wang et al. [57] proposed a computational model of 3D visual saliency by merging the depth saliency map with the results of 2D visual feature detection. Later, they proposed a new stereoscopic saliency de-tection framework based on the feature contrast of color, luminance, texture, and depth [58].
3) Stereo-vision model: Different from the above models, these models take the stereo vision characteristics into consideration, but not directly using the depth information. For example, Bruce et al. [59] built an attention framework for stereo vision by adding interpretive neuronal units into 2D model.
The first and second models are most popular in this area. For the first models, they are proposed based on existing 2D models and without addi-tional computaaddi-tional complexity for the absence of depth feature extraction.
(a) (b)
(c)
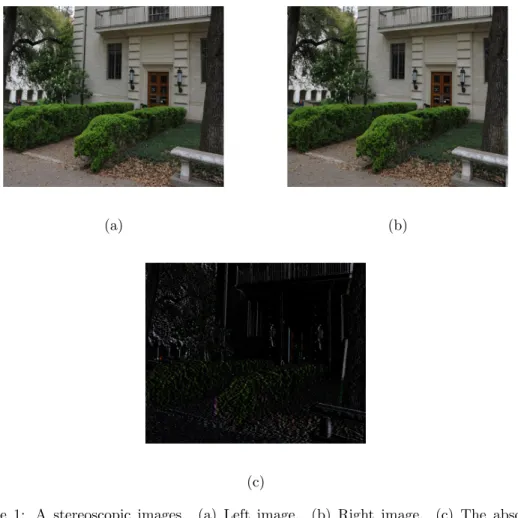
Figure 1: A stereoscopic images. (a) Left image. (b) Right image. (c) The absolute disparity image.
However, some saliency areas caused by depth feature might be failed to detect. The depth - saliency models, the second models, don’t have this problem. Because they use depth saliency maps to analyze the influence of depth information on visual saliency. However, depth saliency maps increase the computational complexity. Hence, it is necessary and reasonable to pro-pose a 3D visual saliency model in which the depth information is considered and the computational complexity is low.
Our previous work [60] found that the absolute disparity map of the view-point pair with human standard disparity is an approximate contour, which means that disparity performs most obviously on the edge of the objects.
Here, we present an example. Fig.1 (a) and (b) are the left and right view of 3D images, and we define them as L and R, respectively, then the absolute disparity image of the 3D images, define as D and shown in Fig. 1(c), can be obtained:
D=|L−R|. (5)
From Fig.1(c), we can see that if the absolute disparity image is an image with the value of 0 (all black), which means the two images are completely the same and no disparity exists, then we cannot get the stereo perception. In other words, the absolute disparity information could reflect the depth information of 3D images. Based on the simple mathematical model shown in Eq.5, the absolute disparity map greatly reduces the computational com-plexity of depth perception information extraction [61]. Based on the above discussion, we improve the model of 3D visual saliency map in the work [58] by using the absolute disparity map information to extract the depth feature to build the 3D saliency map, and then apply it to provide quality prediction for 3D images. It will not only effectively reflect the depth feature but also greatly reduce the computational complexity of the 3D saliency model.
3. The proposed work
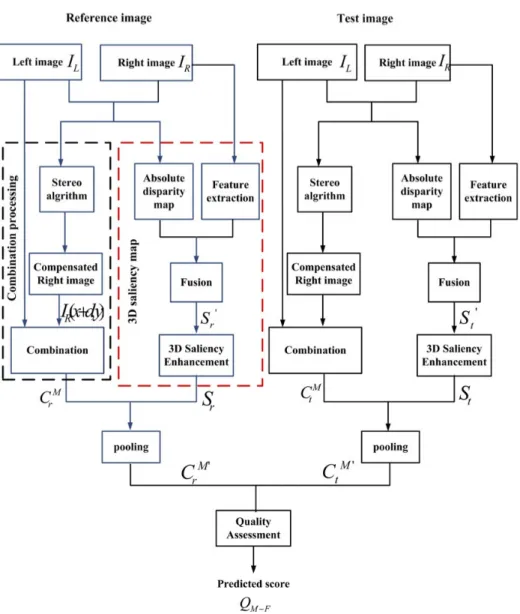
The most effective way of predicting the quality of stereoscopic images is to directly estimate the quality of the true combined image formed within human brain. However, it is difficult to obtain the true combined image that people really perceived in mind. Therefore, we propose a combination model that is close to the true combined image to reflect the stereoscopic image quality. Based on the above physiological discoveries, binocular combination and 3D visual saliency map are both taken into consideration. Binocular combination model enables us to simulate the processing procedure of visual perception, and 3D visual saliency map helps us to focus on the areas of 3D images that people are interested in. Therefore, combining them together is a plausible way to synthesize the combined image in human mind. Then the goal of a 3D stereoscopic image quality assessment is changed to estimate the quality of the combination image that we proposed, in which 2D IQA metrics can play an important role. With this inspiration, we propose an objective quality assessment model for stereoscopic images. The block diagram of our
Figure 2: The framework of the proposed quality assessment model.
model is shown in Fig.2. The details of the proposed framework are described in the following sub-sections.
3.1. Combination processing
As discussed in Section 2, many binocular combination models based on the left and right stimuli have been built. At the visual cortex level, the simple and complex cells are responsible for the binocular combination.
Once the two views match failure at the same retinal location, binocular rivalry will occur. Numerous works have been conducted to explain binocular rivalry [62][63]. In work [64], Levelt proposed a biologically plausible model to simulate the combined image whereby the weighting coefficients are positively correlated with the stimulus strength. A series of papers [65][66][67] indicated that binocular rivalry is composed of local processes. And Recent found also demonstrated that the retinal image fusion is not correlated to the binocular signal generated by simple cells, but is related to the associated binocular strengths of two views generated by complex cells [68]. Levelt’s model [64] then is a natural way to simulate the combined image. In this paper, as in the work [64], the left image and the compensated right image are synthesized to the combination image based on the existed models presented in Section 2. The computational model of each type in this paper is calculated as follows:
1) Eye-Weighted (EW) model: in this paper, we setβ=2, andw2
L=wR2=0.5.
The combined binocular image can be obtained:
C =p(wL·IL(x, y))2+ (wR·IR(x+d, y))2. (6)
where (x, y) is the position of a pixel and dis a disparity index that matches pixels from Lto those inR. IL and IR are the left and right images,
respec-tively.
2) Vector Summation (VS) model:
C =
q I2
L(x, y) +IR2(x+d, y) +IL(x, y)·IR(x+d, y). (7)
3) Gain Control (GC) model:
C =gL(x, y)·IL(x, y) +gR(x+d, y)·IL(x+d, y). (8)
4) Neural Network (NN) model:
C = IL(x, y) 1 +IR(x+d, y)
+IR(x+d, y) 1 +IL(x, y)
+o.1·IL(x, y)·IR(x+d, y). (9)
Following the works in [35][69], we extract the energy responses of orig-inal and reference images by using Gabor filter banks Gs,o (o denotes the
orientation index and s denotes the scale index), as follows:
Gs,o(ω, θ) = exp[− (log(ω/ωs))2 2σ2 s ]×exp[−(θ−θ0) 2 2σ2 o ]. (10)
where ω and ωs are the normalized radial frequency and the corresponding
center frequency of the filter, respectively. While σs and σo determine the
strengths of the filter, and θ is the orientation angle. Then the responses on different scale s along different orientation θ, denoted as [ηs,o, ζs,o], can be
computed.
Based on the above analysis, the local energy at locationX along orien-tation o can be obtained as follows:
Eo(X) =
p
Fo(X)2+Ho(X)2. (11)
where Fo(X) = Psηs,o(X) and Ho(X) =Psζs,o(X).
In this paper, as in Ding et al. [70], the local energies of the Gabor filter responses are obtained as the weights of the left and right eyes:
E(X) =sumEo(X). (12)
3.2. 3D saliency map
Following work [58], the 3D saliency map is built based on three steps: feature extraction, fusion and final saliency enhancement. Note that the absolute disparity map is adopted to extract the depth feature here. We first convert the right view of the input 3D images to Y CbCr color space to obtain the luminance information Y and two color components: Cb and Cr. Then we use theDC coefficients ofY,Cb,CrandDto reflect the luminance features (YDC), color features (CbDC) and depth features (DDC), respectively,
and the AC coefficients fromY components to represent the texture features
T for the image patch [58]. In this paper, the Gaussian model of spatial distance between image patches is used to weight the feature contrast for saliency calculation [58]. Then we can obtain the saliency value Fik of image patch ifrom feature k as:
Fik =X j6=i 1 σ√2πe l2 ij/(2σ2)Uk ij. (13)
where k ∈ (L, Cb, Cr, T, D), and lij is the spatial distance between image
patches i and j. Uk
ij denotes the feature difference between image patches i
and j from featurek. Here, σ is set as 5 [58].
Since the color, luminance and depth features are represented by DC coefficients, while texture feature is represented as AC coefficients, so when
k ∈ (L, Cb, Cr, D), Uijk = |B k i −Bjk| Bk i +Bjk . (14) while k ∈ (T), Uijk = P t(B k i −Bjk)2 P t(Bik+Bjk) . (15)
where Bk represents the feature.
We use a normalized value,Vkshown in Eq.16, to represent the
compact-ness property for feature maps:
Vk = P i,j p (i−Ei,k)2+ (j −Ej,k)2·Fk(i, j) P i,jFk(i, j) . (16)
where (i, j) is the spatial location in the feature map, k∈(L, Cb, Cr, T, D),
Ei,k = P (i,j)i·Fk(i, j) P (i,j)Fk(i, j) . (17) and Ej,k = P (i,j)j·Fk(i, j) P (i,j)Fk(i, j) . (18)
Then, we fuse the feature maps for the saliency map as follows:
Sf = X k βk·Fk+ X p6=q βp·βq·Fp ·Fq. (19) where βk = eVk1 .
As the work in [58], considering the center bias factor, the saliency map can be obtained as follows:
S0 = 0.7Sf + 0.3Sc. (20)
whereScis the Centre-Bias Map calculated based on center bias factor. Then
the final saliency map enhanced by the normalized visual sensitivity Cs(f, e)
[71] can be built as:
3.3. Saliency weighting and quality assessment
Given a 3D image (ILand IR), the energy responses of the left image and
the right image (ELandER) can be calculated by the Gabor filter responses.
Then based on the above four combination computational models in Section 3.1, four kinds of cyclopean image C can be obtained. The corresponding 3D saliency map S can be generated based on the algorithm in Section 3.2. Therefore, the combined image and 3D saliency map of the reference 3D images, denote as CrM and Sr respectively, can be obtained, and that of
the distorted 3D images, denote as CM
t and St respectively, also can be
calculated. Here, M indicates one of the binocular cyclopean models above (EW, VS, GC, or NN). After calculating the above combination image and 3D visual saliency map, the next step is to pool them together and evaluate the quality of 3D images. In order to highlight the areas that human eyes are interested in, the combined image and the 3D visual saliency map are combined together to build the quality index, as follows:
CrM0 =CrM ·(1 +a·Sr). (22)
CtM0 =CtM ·(1 +a·St). (23)
where a is a positive constant to highlight the visual saliency area, and CM0 r
and CtM0 denote as the weighted combination images of the reference 3D images and the distorted 3D images, respectively. Although more sophis-ticated models may be employed, we choose this linear model for its lower computational complexity.
Finally, the task of quality assessment is conducted by applying a full reference 2D IQA algorithm on the reference weighted combination image
CrM0 and on the distorted weighted combination image CtM0. The objective quality assessment value QM−F of a 3D image can be given by:
QM−F =F(CM
0
r , C M0
t ). (24)
whereF(·) represents one of the 2D IQA metrics (e.g. VIF [17], PSNR, SSIM [18], MS-SSIM [19] and GSM [20]). M−F denotes the proposed model, and M indicates one of the binocular cyclopean models (EW, VS, GC or NN shown in Section 3.1). For PSNR using the EW model, the proposed model is defined as EW-PSNR. Similarly, M-SSIM, M-MS-SSIM and M-GSM are defined likewise on the basis of Eq.24.
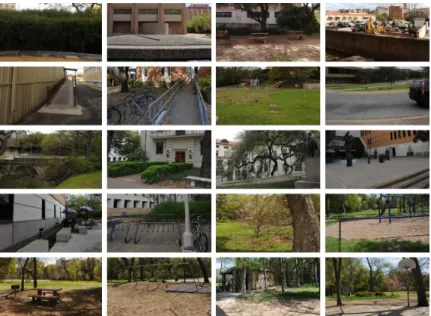
Figure 3: 20 left images of the original image pairs.
4. Experimental result and analysis
4.1. Stereoscopic image quality database
To verify the performance of the proposed metric, LIVE 3D Image Quality Database of the University of Texas at Austin is used in the experiment, which contains 365 distorted images generated from 20 reference images, shown in Fig. 3. Five types of distortions are applied to the reference images at various levels (80 for JP2K, JPEG, WN and FF respectively; 45 for Blur). All distortions are symmetric in nature, and each distorted image is assigned a quantitative subjective quality score [72].
To further verify the proposed method, more 3D IQA Databases need to be used. However, some 3D IQA Databases are either not publicly avail-able or absent of subjective assessment value. To solve this problem, the SVBL 3D IQA Database (Stereo Image Database of Stereo Vision and Bio-Optics Laboratory from School of Electronic and Information Engineering, Tianjin University [73]) is used to further verify the proposed method. The SVBL 3D IQA Database contains 360 distorted stereopairs and 30 original stereopairs. Each stereoscopic image in this database has been evaluated by human subjects, and assigned a quantitative subjective quality score [74].
4.2. Performance measures and weights determination
To verify the performance of the proposed metric, four performance indi-cators between the predicted objective scores and subjective scores are em-ployed: Pearson linear correlation coefficient (PLCC), Spearman rank order correlation coefficient (SROCC), Kendall rank-order correlation coefficient (KROCC) and root mean squared error (RMSE). Among them, PLCC and RMSE, given by Eq.25 and Eq.26, are used to measure prediction accu-racy. SROCC and KROCC are used to evaluate the prediction monotonic-ity. For a perfect match of objective and subjective scores, RMSE=0 and PLCC=SROCC=KROCC=1. P LCC(X, Y) = Pn i=1(Xi−Xi)(Yi−Yi) q Pn i=1(Xi−Xi)2 Pn i=1(Yi−Yi)2 . (25) RM SE(X, Y) = v u u t 1 n n X i=1 (Xi−Yi)2. (26)
And the five-parameter logistic function [75], shown as follows, is applied in our experiment to conduct the nonlinear mapping:
DM OS =β1×[ 1 2 − 1 1 +exp(β2(x−β3)) ] +β4x+β5. (27)
whereβ1,β2,β3,β4andβ5 are determined by using the subjective scores and
the objective scores. We select a small set of the LIVE 3D Image Quality Assessment database to train the parameters and determine the parameter
a in Eq.22 and Eq.23 by optimizing the values of PLCC and RMSE between the objective and subjective scores. For simplicity, the parameter is chosen by linear regression optimization. We find that the parameter determination result is a= 7.236 for NN-MS-SSIM model which yield the best overall per-formance than other proposed combination models. In the following sections, we seta = 7.236 to make the performance comparison. The same parameter is adopted in the SVBL 3D IQA Database.
In order to evaluate the performance of the proposed scheme, we compare the proposed metric not only with four existed 2D IQA schemes, i.e., PSNR, SSIM [18], MS-SSIM [19] and GSM [20], but also with four SIQA models, i.e. Benoit’s Scheme [26], Shao’s scheme [34], Chen’s scheme [35] and Lin’s
scheme [36]. To verify the effectiveness of the improved 3D saliency map, we also compare the proposed model using improved 3D saliency map with that using original 3D saliency map in work [58], denotes as M-OR. For the NN-OR metric, we combine the NN combination model and 3D saliency map in work [58] together to calculate the quality of the stereoscopic images. For the quality metrics based on 2D IQA method, the averaged 2D quality metrics (averaging the quality of the left and right image) are used to assess the stereoscopic image quality. For Benoit’s scheme, we adopt Qf2 as the final
quality which is obtained by integrating the disparity similarity measures and the image quality measures together using SSIM. Shao’s model is computed based on the similarity between binocular energy response of the original and distorted stereoscopic images. The model of Chen is calculated by using MS-SSIM on the reference combination image and test combination image. For Lin’s model, we apply FI-PSNR to obtain the quality of the stereoscopic image.
4.3. Overall Performance on LIVE 3D IQA Database
4.3.1. Performance comparison with existing 2D IQA metrics
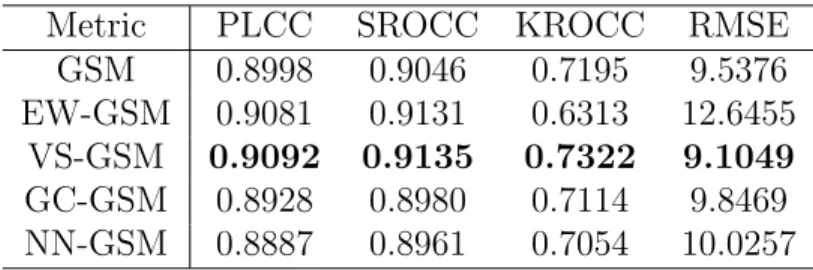
For the comparison, the experimental results of models that using 2D IQA metrics, PSNR, SSIM, MS-SSIM and GSM, are the average value of the left and right images. M-PSNR, M-SSIM, M-MS-SSIM and M-GSM are the combination of binocular models and 2D IQA metrics respectively, i.e. NN -PSNR, NN-SSIM, NN-MS-SSIM and NN-GSM are the combination of neu-ral network model (NN) (present in Eq.24) and four 2D IQA metrics (PSNR, SSIM, MS-SSIM and GSM). Tables 1-4 present the values of 2D IQA metrics and that of the proposed model based on 2D IQA metrics. It can be seen that the proposed framework boosts the performance of corresponding 2D IQA metric, and among all the combination models, NN-MS-SSIM weighted com-bination model performs better than any other comcom-bination models and all 2D IQA metrics. For the proposed NN-GSM, GSM is used for many known distributions as special cases, such as the symmetrized Gamma distribution and the generalized Gaussian distribution. For NN-PSNR, PSNR is an easy and fast metric to calculate the image quality by estimating absolute errors, but the range of its validity is limited by the codec and image content. While SSIM is designed to improve the traditional PSNR method by considering image degradation as perceived change in structural information, also incor-porating luminance and contrast information, which let the scheme NN-SSIM obtain a better performance than NN-PSNR. MS-SSIM is layered on SSIM
Table 1: Performance of the proposed framework and 2D IQA matric PSNR
Metric PLCC SROCC KROCC RMSE
PSNR 0.8345 0.8341 0.6297 12.0480
EW-PSNR 0.8158 0.8219 0.6313 12.6455
VS-PSNR 0.8149 0.8204 0.6294 12.6714
GC-PSNR 0.8178 0.8251 0.6324 12.5826
NN-PSNR 0.8650 0.8656 0.6716 11.1395
Table 2: Performance of the proposed framework and 2D IQA matric SSIM
Metric PLCC SROCC KROCC RMSE
SSIM 0.8725 0.8767 0.6792 10.6841
EW-SSIM 0.8695 0.8762 0.6807 10.7986 VS-SSIM 0.8702 0.8769 0.6814 10.7732
GC-SSIM 0.9053 0.9073 0.7235 9.2850
NN-SSIM 0.8820 0.8867 0.6939 10.3042
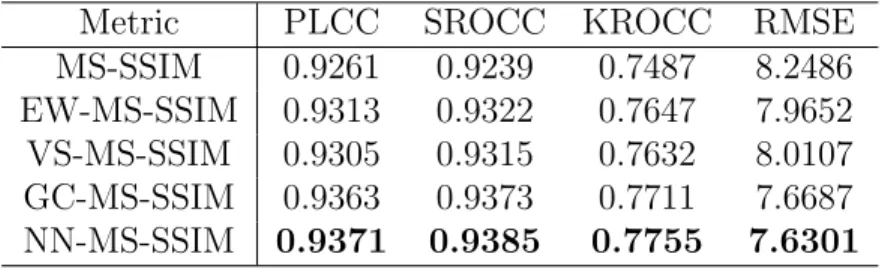
Table 3: Performance of the proposed framework and 2D IQA matric MS-SSIM
Metric PLCC SROCC KROCC RMSE
MS-SSIM 0.9261 0.9239 0.7487 8.2486
EW-MS-SSIM 0.9313 0.9322 0.7647 7.9652
VS-MS-SSIM 0.9305 0.9315 0.7632 8.0107
GC-MS-SSIM 0.9363 0.9373 0.7711 7.6687
NN-MS-SSIM 0.9371 0.9385 0.7755 7.6301
and has a higher performance on qualifying image quality than SSIM, so the NN-MS-SSIM gains the best overall performance among all the proposed schemes. Based on the above conclusion, NN-MS-SSIM model is adopted to make a discussion and comparison in the follow sections.
4.3.2. Performance comparison with existing SIQA models
We compare the proposed NN-MS-SSIM weighted combination model with four existing stated-of-art 3D IQA models: Benoit’s scheme [26], Shao’s scheme [34], Chen’s scheme [35] and Lin’s scheme [36]. To save space, here only the values of PLCC and SROCC of each distortion type with the LIVE 3D Image Quality Database are listed in Table 5 and Table 6, where the in-dicator highlighted in bold shows the best performance is. Table 5 and Table
Table 4: Performance of the proposed framework and 2D IQA matric GSM
Metric PLCC SROCC KROCC RMSE
GSM 0.8998 0.9046 0.7195 9.5376
EW-GSM 0.9081 0.9131 0.6313 12.6455
VS-GSM 0.9092 0.9135 0.7322 9.1049
GC-GSM 0.8928 0.8980 0.7114 9.8469
NN-GSM 0.8887 0.8961 0.7054 10.0257
Table 5: PLCC performance comparison of the four SIQA schemes (the cases in bold: the best performance).
Distortion JPEG JP2K WN Blur FF
Benoit 0.5597 08897 0.9360 0.9256 0.7514
Shao 0.6033 0.9166 0.9400 09553 0.8284
Chen 0.6344 0.9163 0.9432 0.9416 0.7573
Lin 0.2167 0.8381 0.9280 0.8249 0.7086
NN-MS-SSIM 0.7525 0.9445 0.9329 0.9594 0.8382
Table 6: SROCC performance comparison of the four SIQA schemes.
Distortion JPEG JP2K WN Blur FF
Benoit 0.5189 08701 0.9347 0.8967 0.6142
Shao 0.5887 0.8941 0.9392 0.9258 0.7973
Chen 0.5582 0.8956 0.9481 0.9261 0.6879
Lin 0.1960 0.8388 0.9284 0.7910 0.6581
NN-MS-SSIM 0.7377 0.9303 0.9393 0.9435 0.7744
6 show that the proposed NN-MS-SSIM yields the highest value of PLCC on the distortions of JPEG, JP2K, Blur and FF, and obtains the highest value of SROCC on the distortions of JPEG, JP2K and Blur. Although the proposed model lags behind Chen’s model for the PLCC and SROCC values on WN distortion, and Shao’s model for the SROCC value on FF distortion, the performance values of the proposed model on WN and FF distortions are very close to the best one. This demonstrates that the proposed scheme is more stable across different distortion types, and achives good consistency with human perception.
The overall performance comparison among these SIQA schemes and NN-OR metric is presented in Table 7. From the results of overall performance
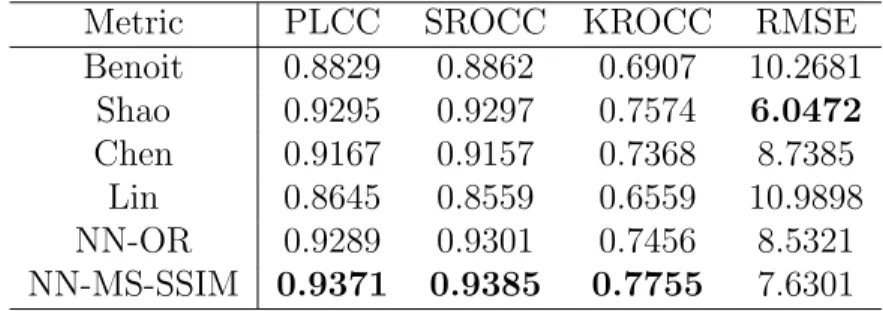
Table 7: Overall Performance of the proposed framework NN-MS-SSIM against existing 3D quality assessment metrics.
Metric PLCC SROCC KROCC RMSE
Benoit 0.8829 0.8862 0.6907 10.2681 Shao 0.9295 0.9297 0.7574 6.0472 Chen 0.9167 0.9157 0.7368 8.7385 Lin 0.8645 0.8559 0.6559 10.9898 NN-OR 0.9289 0.9301 0.7456 8.5321 NN-MS-SSIM 0.9371 0.9385 0.7755 7.6301
shown in Table 7, we can see that the proposed model yields the best over-all performance than Benoit’s, Chen’s, Lin’s and NN-OR model, and obtains the higher value of PLCC, SROCC and KROCC than that of Shao’s Scheme, only the RMSE value lags behind. To be more specific, for Benoit’s scheme, although the depth information and image quality factor are both considered, the overall performance would be affected by the accuracy of the disparity calculation. And also they ignore the importance of binocular visual charac-teristics. Though Lin’s scheme considers binocular integration behaviors, its performance is mediocre. The reason is that the algorithm of Lin’s scheme is specifically designed to predict the quality of 3D compression image, and could not be available to other types of distortions. For Chen’s and Shao’s models, the values of PLCC and SROCC are higher than 0.9, the value of KROCC are higher than 0.7, while RMSE is less than 9. Both of them per-form well in predicting the quality of 3D images. However, the proposed NN-MS-SSIM yields a higher consistency with subjective scores. For Shao’s scheme, the parameters, which reflect the importance of binocular energy response and BJND features, need to be adjusted as long as the stereo image database is changed. For Chen’s scheme, although it takes binocular combi-nation into consideration, like what we do in this paper, but it doesn’t take the visual attention into consideration. For NN-OR model, it has better per-formance in stereoscopic image quality assessment than Benoit’s, Chen’s and Lin’s model, and the performance values are close to the propose NN-MS-SSIM model, which proves the effectiveness of the 3D saliency map in stereo-scopic images quality assessment. However, NN-OR model needs to calculate the depth map to obtain the final 3D saliency map, it will affect the overall performance and computational complexity. By using the absolute disparity map instead of depth map, the proposed model NN-MS-SSIM improves the
Table 8: Time complexity comparison of each SIQA model: the calculating time of each 3D images.
Model Benoit Chen Lin NN-OR NN-MS-SSIM
Time (seconds) 442.39 345.94 3.04 217.356 27.4510
overall performance and also greatly reduces the computational time. Based on the above analysis, the higher performance of our proposed model also confirms our former conclusion that the combining 3D visual saliency map and binocular combination model can effectively and accurately predict the image quality. In general, we can conclude that the proposed model is an effective tool and a robust measure in predicting the quality of stereoscopic images.
Table 8 shows the time complexity comparison among the existed SIQA models. These SIQA models are implemented by MATLAB and the platform of Intel Core i5-2320 2.99 GHz with 4GB memory. Due to the need of dis-parity information, the models of Benoit, Chen and NN-OR take more time than the other two models. Although the model of Lin takes the shortest time among these SIQA models, it has worse overall performance than our proposed model, as shown in Table 7. In general, the proposed model is the most effective one to predict the quality of the stereoscopic images.
4.3.3. Impact of each component in the proposed scheme
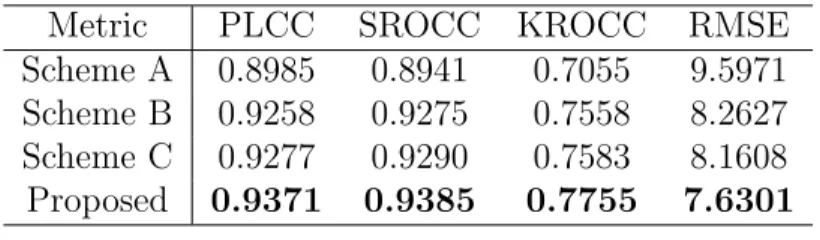
To demonstrate the impact of each component in the proposed scheme, we design three different schemes for comparison, denote as Scheme A, Scheme B and Scheme C, respectively. The only difference between the above three models and the proposed NN-MS-SSIM is the final index. For the proposed NN-MS-SSIM, the indexes of the reference image and distorted images are built based on the Equations show in Eq.22 and Eq.23. But for Scheme A, only the binocular combination modulation, Cr-A shown in Eq.28, is used to evaluate the quality. For Scheme B, we simply combine the binocular combination model and 3D visual saliency map together, Cr-B shown in Eq.29, to build the model, while for Scheme C, a simple linear model, Cr-C shown in Eq.30, is applied to evaluate the quality. All the above models are based on the MS-SSIM 2D IQA model to get the final quality score, and the overall performance comparison of the above schemes are listed in Table 9.
Table 9: Overall performance comparison of each component of the proposed scheme
Metric PLCC SROCC KROCC RMSE
Scheme A 0.8985 0.8941 0.7055 9.5971 Scheme B 0.9258 0.9275 0.7558 8.2627 Scheme C 0.9277 0.9290 0.7583 8.1608 Proposed 0.9371 0.9385 0.7755 7.6301 Cr−B =Cr·Sr. (29) Cr−C =Cr·(1 +Sr). (30)
From the results shown in Table 9, we can see that the proposed 3D vi-sual saliency map plays an important role in image quality assessment by comparing the results of Scheme A (binocular combination image only) and Scheme B (combined with the proposed 3D visual saliency map). Besides, Scheme C performed better evaluation performance than both of Scheme A and Scheme B, which means the overall performance can be further improved by increasing the weights of the visual saliency area. Our proposed model here yield a best performance than the above three Schemes, which indi-cates that the visual saliency characteristics plays an important role in the performance improvement by properly weighting the visual saliency area.
4.4. Overall Performance on SVBL 3D IQA Database
4.4.1. Overall performance comparison with existing 2D IQA Metric and SIQA Models
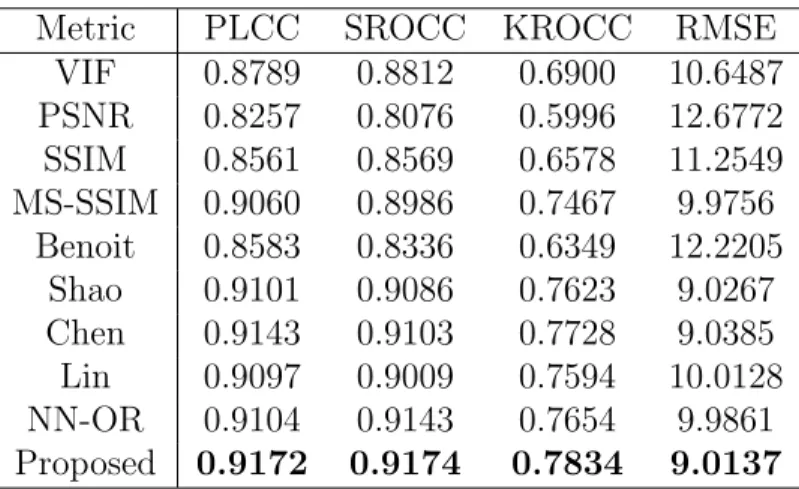
To save space, only the overall performances on SVBL 3D IQA Database are list in Table 10. The best results are highlighted in boldface. From the table, we can see that the overall performances of 2D metrics are worse than the proposed 3D model on SVBL 3D Database, and the proposed 3D model performs best than the existing 3D IQA models. Besides, the proposed 3D model has better overall performance than NN-OR model, which further indicates that the improved 3D saliency map has greater effect on stereoscopic image quality assessment than the original 3D saliency map in work [58]. Table 11 shows the time complexity comparison among the existed SIQA
Table 10: Performance of the Proposed Framework LAD-MS-SSIM against Existing 3D Quality Assessment Metrics
Metric PLCC SROCC KROCC RMSE
VIF 0.8789 0.8812 0.6900 10.6487 PSNR 0.8257 0.8076 0.5996 12.6772 SSIM 0.8561 0.8569 0.6578 11.2549 MS-SSIM 0.9060 0.8986 0.7467 9.9756 Benoit 0.8583 0.8336 0.6349 12.2205 Shao 0.9101 0.9086 0.7623 9.0267 Chen 0.9143 0.9103 0.7728 9.0385 Lin 0.9097 0.9009 0.7594 10.0128 NN-OR 0.9104 0.9143 0.7654 9.9861 Proposed 0.9172 0.9174 0.7834 9.0137
Table 11: Time complexity comparison of each SIQA model: the calculating time of each 3D images.
Model Benoit Chen Lin NN-OR NN-MS-SSIM
Time (seconds) 476.872 382.734 4.154 223.56 30.341
models on SVBL 3D IQA Database based on the same platform above. It further indicates that the proposed model has the best overall performance than other models.
4.4.2. Impact of Each Component
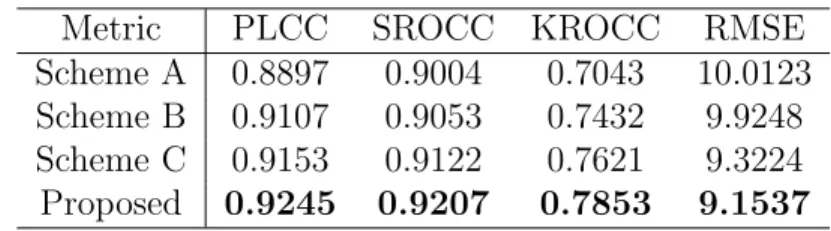
Table 12 presents the overall performance of each component of the pro-posed model, and the best results are highlighted in boldface. The results indicate that the combination of combined model and saliency map both paly an important role in image quality assessment, and the proposed model yields the best performance than other schemes, which further presents the effectiveness of the proposed model.
5. Conclusions
This paper proposes an effective quality assessment method of stereo-scopic images based on human 3D visual saliency map and binocular visual characteristics, which can precisely predict the quality of 3D images that are
Table 12: Overall Performance Comparison of Each Component of the Proposed Scheme
Metric PLCC SROCC KROCC RMSE
Scheme A 0.8897 0.9004 0.7043 10.0123 Scheme B 0.9107 0.9053 0.7432 9.9248 Scheme C 0.9153 0.9122 0.7621 9.3224 Proposed 0.9245 0.9207 0.7853 9.1537
contaminated by different types of symmetric distortions. A great contri-bution of this work is that it provides a novel quality assessment method where the binocular combination behavior and visual saliency characteris-tics are both considered. What’s more, our model has two clear advantages as follows: (1) We develop a novel 3D saliency map based on the absolute disparity map which can greatly reduces the computational complexity by avoiding calculate the depth information. It guides us to assign appropri-ate weights to the visual information content of the 3D images. (2) The proposed model highlights the important areas that human eyes tend to be interested in based on effectively combined the binocular combination char-acteristics and visual saliency together. We demonstrate the effectiveness of our framework on the LIVE 3D Image Quality Database distorted by sym-metric distortions and SVBL 3D IQA Database. Experimental results show that the proposed method can achieve high consistency with the subjective assessments. In the future work, we will also focus on predicting the qual-ity of stereo images and 3D videos that distorted by asymmetric distortions.
ACKNOWLEDGMENT
The authors would like to thank Prof. Alan C. Bovik for providing the LIVE 3D IQA Database. This research is partially supported by the Na-tional Natural Science Foundation of China (Nos. 61471260 and 61271324), and Program for New Century Excellent Talents in University (NCET-12-0400).
[1] X.L. Li, Q.Q. Ruan, Y. Jin, et al.., Fully Automatic 3D Facial Expression Recognition using Polytypic Multi-block Local Binary Patterns, Signal Processing, vol.. 108, pp. 297-308, 2015.
[2] A. Vosoughi, V. Testoni, P.C. Cosman, L.B. Milstein, Multiview Coding and Error Correction Coding for 3D Video over Noisy Channels, Signal Processing: Image communication, vol. 30, pp. 107-120, 2015.
[3] J.C. Yang, Y. Liu, Q.G. Meng, R.R. Chu, Objective Evaluation Criteria for Stereo Camera Shooting Quality under Different Shooting Parame-ters and Shooting Distances, IEEE Sensors Journal, vol.15, no.8, 2015. [4] D. Choi, M. Cho, Three-Dimensional Image Transmission and
Recon-struction for Multisensor Imaging System using Interleaver Division Multiple Access, vol. 54, no. 1, pp. A45-A50, 2015.
[5] F. Gao, D. Tao, X. Gao, X. Li, Learning to Rank for Blind Image Quality Assessment. IEEE transactions on neural networks and learning systems, 2015.
[6] W.L. Hou, X.B. Gao, D.C. Tao, Blind Image Quality Assessment via Deep Learning, IEEE Transactions on Neural Networks and Learning Systems, vol. 26, no. 6, pp. 1275-1286, 2015.
[7] L. Zhang, Y. Shen, H.Li, VSI: A Visual Saliency-Induced Index for Per-ceptual Image Quality Assessment, IEEE Transactions on Image pro-cessing, vol. 23, no. 10, pp. 4270-4281, 2014.
[8] X.B. Gao, W. Lu, D.C. Tao, X.L. Li, Image Quality Assessment Based on Multiscale Geometric Analysis, IEEE Transactions on Image Pro-cessing, vol. 18, no.7, pp. 1409-1423, 2009.
[9] L. He, D. Wang, X. Li, D. Tao, X. Gao, F. Gao, Color Fractal Structure Model for Reduced-Reference Colorful Image Quality Assessment, In Neural Information Processing, Springer Berlin Heidelberg, pp. 401-408, 2012.
[10] L. He, D. Tao, X. Li, X. Gao, Sparse Representation for Blind Im-age Quality Assessment. In Computer Vision and Pattern Recognition (CVPR), 2012 IEEE Conference on IEEE, pp. 1146-1153, 2012.
[11] M. W¨opking, Viewing Comfort with Stereoscopic Pictures: An Exper-imental Study on the Subjective Effects of Disparity Magnitude and Depth of Focus. Journal of the Society for information Display, vol. 3, no. 3, pp. 101-103, 1995.
[12] W.A. IJsselsteijn, H.D. Ridder, J. Vliegen, Subjective Evaluation of Stereoscopic Images: Effects of Camera Parameters and Display Dura-tion. IEEE Transactions on Circuits and System for Video Technology, vol. 10, no. 2, pp. 225-233, 2000.
[13] J. Zhou, G, Jiang, X. Mao, Subjective Quality Analyses of Stereoscopic Images in 3DTV System. Visual Communications and Image Processing, 2011 IEEE, IEEE, pp.1-4 , 2011.
[14] J.S. Lee, L. Goldmann, T. Ebrahimi, Paired Comparison-Based Sub-jective Quality Assessment of Sereoscopic Image. Multimedia Tools and Applications. pp. 1-18 , 2012.
[15] F. Battisti, E. Bosc, M. Carli, et al., Objective Image Quality Assess-ment of 3D Synthesized Views, Signal Processing: Imaghe Communica-tion, vol.30, pp. 78-88, 2015.
[16] X. Wang, Q. Liu, R. Wang, et al., Natural Image Statistics based 3D Reduced Reference Image Quality Assessment in Contourlet Domain, Neurocomputing, vol. 151, pp. 683-691, 2015.
[17] H.R. Sheikh, A.C. Bovik, Image Information and Visual Quality. IEEE Transactions on Image Processing, vol. 15, no. 2, pp. 430-444, 2006. [18] Z. Wang, A.C. Bovik, H.R. Sheikh, and E.P. Simoncelli, Image
Qual-ity Assessment: From Error VisibilQual-ity to Structural SimilarQual-ity. IEEE Transactions on Image Processing, vol. 13, no. 4, pp. 600-612, 2004. [19] Z. Wang, E.P. Simoncelli, A.C. Bovik, Multi-Scale Structural Similarity
for Image Quality Assessment. IEEE Asilomar Conference on Signals, Systems and Computers. Pacific Grove, CA, pp. 398-1402, 2003.
[20] A. Liu, W. Lin, M. Narwaria, Image Quality Assessment Based on Gra-dient Similarity, IEEE Transactions on Image Processing, vol. 21, no. 4, pp. 1500-1512, 2012.
[21] X.B. Gao, F. Gao, D.C. Tao, X.L. Li, Universal Blind Image Quality Assessment Metrics Via Natural Scene Statistics and Multiple Kernel Learning. IEEE Transactions on Neural Networks and Learning Sys-tems, vol. 24, no. 12, pp. 2013-2026, 2013.
[22] X.L. Li, D.C. Tao, X.B. Gao, W. Lu, A Natural Image Quality Evalua-tion Metric. Signal Processing, vol. 89, no. 4, pp. 548-555, 2009.
[23] P. Gorley, and N. Holliman, Stereoscopic Image Quality Metrics and Compression. Proceedings of SPIE 6803, 2008.
[24] J. You, L. Xing, A. Perkis, X. Wang, Assessment for Stereoscopic Images based on 2D Image Quality Metrics and Disparity Analysis. Interna-tional Workshop on Video Processing and Quality Metrics. Scottsdale, Arizona, USA, 2010.
[25] P. Campisi, P. LeCallet, E. Marini, Stereoscopic Images Quality Assess-ment. European Signal Processing Conference. Poznan, Poland, 2007. [26] A. Benoit, P. Le Callet, P. Campisi , et al., Using Disparity for
Qual-ity Assessment of Stereoscopic Images. Proceedings of the 15th IEEE International Conference on Image Processing. 2008.
[27] C. Hewage, M.G. Martini, Reduced-Reference Quality Metric for 3D Depth Map Transmission. IEEE 3DTV Conference. Tampere, Finland, pp. 1-4, 2010.
[28] L. Xing, J. You, T. Ebrahimi, A. Perkis, A Perceptual Quality Metric for Stereoscopic Crosstalk Perception. IEEE International Conference on Image Processing, Hong Kong, China, pp. 4033-4036, 2010.
[29] A. Boev, A. Gotchev, K.O. Egiazarian, A. Aksay, G.B. Akar, Towards Compound Stereo-Video Quality Metric: A Specific Encoder-Based Framework. IEEE SSIAI. Denver, Colorado, USA, pp. 218-222, 2010. [30] F. Shao, W. Lin, S. Fu, et al., Perceptual Full Reference Quality
As-sessment of Stereoscopic Images by Considering Binocular Visual Char-acteristics. IEEE Transactions on Image Processing, vol. 22, no. 5, pp. 1940-1953, 2013
[31] J.C. Yang, Y. Liu, Z.Q. Gao, R.R. Chu, Z.J. Song, A Perceptual Stereo-scopic Image Quality Assessment Model Accounting for Binocular Com-bination Behavior, Journal of Visual Communication and Image Repre-sentation, vol.31, pp. 138-145, 2015.
[32] K. Ha, M. Kim, A Perceptual Quality Assessment Metric using Tempo-ral Complexity and Disparity Information for Stereoscopic Video. Image Processing (ICIP), 2011 18th IEEE International Conference on. IEEE, pp. 2525-2528, 2011.
[33] A. Maalouf, M.C. Larabi, CYCLOP: A Stereo Color Image Quality As-sessment Metric. Acoustics, Speech and Signal Processing (ICASSP), 2011 IEEE International Conference on. IEEE, pp.1161-1164, 2011. [34] F. Shao, G. Jiang, M. Yu, et al., Binocular Energy Response based
Quality Assessment of Stereoscopic Images. Digital Signal Processing, vol. 29, pp. 45-53, 2014.
[35] M.J. Chen, C.C. Su, D.K. Kwon, L.K. Cormack, A.C. Bovik, Full-Reference Quality Assessment of Stereopairs Accounting for Rivalry. Signal Processing: Image Communication, vol. 28, no. 9, pp. 1143-1155, 2013
[36] Y.H. Lin, J.L. Wu, Quality Assessment of Stereoscopic 3D Image Com-pression by Binocular Integration Behavior. IEEE Transactions on Im-age Processing, vol. 23, no. 4, pp. 1527-1542, 2014.
[37] M. Von Grunan, M. Iordanova, Visual Selection: Facilitation due to Stimulus Saliency // Cybernetic Vision, 1996, Proceedings, Second Workshop on, IEEE, pp.15-20, 1996.
[38] E. Niebur, C. Koch, Computational Architectures for Attention. The Attentive Brian, pp. 163-168, 1998.
[39] X.Q. Chu, Y.Y. Wu, Q. Li, Saliency Structure Stereoscopic Image Qual-ity Assessment Method. Optik, vol. 125, no. 2, pp. 704-709, 2014. [40] S. Grossberg, F. Kelly, Neural Dynamics of Binocular Brightness
Per-ception. Vision Research, vol. 39, no. 22, pp. 3796-3816, 1999.
[41] G.R. Engel, The Visual Processes Underlying Binocular Brightness Sum-mation. Vision Research, vol. 7, no. 9, pp. 753-767, 1967.
[42] D.W. Curtis, S.J. Rule. Binocular Processing of Brightness Information: A Vector-Sum Model. Journal of Experimental Psychology: Human Per-ception and Performance, vol. 4, pp. 132-143, 1978.
[43] J. Ding, G. Sperling, Srinivasan R. Attentional Modulation of SSVEP Power Depends on the Network Tagged by the Flicker Frequency. Cere-bral Cortex, vol. 16, no. 7, pp. 1016-1029, 2006.
[44] A.I. Cogan, Human Binocular Interaction: Towards a Neural Model. Vision Research, vol. 27, no.12, pp. 2125-2139, 1987.
[45] H.R. Sheikh, A.C. Bovik, A Statistical Evaluation of Recent Full Ref-erence Image Quality Assessment Algorithms. IEEE Transactions on Image Processing, vol. 15, no. 11, pp. 3440-3451, 2006.
[46] I. Laurent, K. Christof, N. Ernst, A Model of Saliency-Based Visual At-tention for Rapid Scene Analysis. IEEE Transactions on Pattern Anal-ysis and Machine Intelligence, vol. 20, no.11, pp. 1254-1259, 1998. [47] F.W.M. Stentiford, An Attention based Similarity Measure with
Appli-cation to Content based Information Retrieval. Proceedings of Storage and Retrieval for Media Databases Conference. Bellingham, USA, 2003. [48] X. Hou, L. Zhang, Saliency Detection: A Spectral Residual Approach, Proceedings of IEEE Conference on Computer Vision and Pattern Recognition. Minneapolis. USA: IEEE Computer Society, 2007.
[49] J. Harel, C. Koch, P. Perona, Graph-Based Visual Saliency. Adv. Neural Inf. Process. Syst., 2007.
[50] Y.M. Fang, Z.Z. Chen, W.S. Lin, et al., Saliency Detection in the Com-pressed Domain for Adaptive Image Retargeting. IEEE Transactions on Image Processing, vol. 21, no. 9, pp. 3888-3901, 2012.
[51] M.W. Spratling, Predictive Coding as a Model of the V1 Saliency Map Hypothesis. Neural Networks, vol. 26, pp. 7-28 , 2012.
[52] L. Cui, SWVFS: A Saliency Weighted Visual Feature Similarity Metric for Image Quality Assessment. Frontiers of Computer Science, vol. 8, no. 1, pp. 145-155, 2014.
[53] Y. Zhang, G. Jiang, M. Yu, and K. Chen, Stereoscopic Visual Attention Model for 3D Video. inProc. 16th Int. Conf. Adv. Multimedia Model., pp. 314-324, 2010.
[54] C. Chamaret, S. Godeffroy, P. Lopez, and O. Le Meur, Adaptive 3D Rendering based on Region-of-Interest. Proc. SPIE, vol. 7524, Stereo-scopic Displays and Applications XXI, 75240V, Feb. 2010.
[55] N. Ouerhani and H. Hugli, Computing Visual Attention from Scene Depth. in Proc. IEEE 15th Int. Conf. Pattern Recognit., pp. 375-378, 2000.
[56] A. Ciptadi, T. Hermans, and J.M. Rehg, An in Depth View of Saliency. in Proc. BMVC, pp. 112.1-112.11, 2013.
[57] J. Wang, M.P.D. Silva, P.L. Callet, Computational Model of Stereo-scopic 3D Visual Saliency. IEEE Transactions on Image Processing, vol. 22, no. 6, 2013.
[58] Y. Fang, J. Wang, M. Narwaria, P.L. Callet, Saliency Detection for Stereoscopic Images. IEEE Transactions on Image Processing, vol. 23, no. 6, 2014.
[59] N. Bruce, J. Tsotsos, An Attentional Framework for Stereo Vision. in Proc. IEEE 2nd Canadian Conf. Comput. Robot Vis., May 2005, pp. 88-95
[60] J.C. Yang, C.P. Hou, J.J. Lei Objective Quality Evaluation Method of Stereo Image based on Human Visual Characteristics. J. Tianjin Univ. Sci. Technol., vol. 42, pp. 622-627, 2009.
[61] N. Yun, Z.Y. Feng, J.C. Yang, J.J. Lei, The Objective Quality Assess-ment of Stereo Image. Neurocomputing, vol. 120, no. 23, pp. 121-129, 2013
[62] R. Blake, D.H. Westendorf, R. Overton, What is Suppressed during Binocular Rivalry? Perception, vol.9, no. 2, pp. 223-231, 1980.
[63] M. Fahle, Binocular Rivalry: Suppression depends on Orientation and Spatial Frequency. Vision Research, vol. 22, no. 7, pp. 787-800, 1982. [64] W.J.M. Levelt, On Binocular Rivalry. Mouton, The Hague, Paris, 1968. [65] D.J. Field, A. Hayes, R.F. Hess, Contour Integration by the Human Vi-sual System: Evidence for a Local ”Association Field”. Vision Research, vol. 33, no. 2, pp. 173-193, 1993.
[66] M.K. Kapadia, M. Ito, C.D. Gilbert, G. Westheimer, Improvement in Visual Sensitivity by Changes in Local Context: Parallel Studies in Human Observers and in V1 of Alert Monkeys. Neuron, vol. 15, no. 4, pp. 843-856, 1995.
[67] D. Alais, R. Blake, Grouping Visual Features during Binocular Rivalry? Vision Research. vol. 39, no. 26, pp. 4341-4353, 1999.
[68] R. Bensalma, M.C. Larabi, A Perceptual Metric for Stereoscopic Image Quality Assessment based on the Binocular Energy. Multidim Syst Sign Process, vol. 24, pp. 281-316, 2013.
[69] L. Zhang, L. Zhang, X. Mou, and D. Zhang, FSIM: A Feature Similar-ity Index for Image QualSimilar-ity Assessment. IEEE Transactionss on Image Processing, vol. 20, no. 8, pp. 2378-2386, 2011
[70] J. Ding, and G. Sperling, A Gain-Control Theory of Binocular Com-bination. Proceedings of the National Academy of Sciences, USA, vol. 103, no. 4, pp. 1141-1146, 2006
[71] W.S. Geisler, J.S. Perry, A Real-Time Foveated Multisolution System for Low-Band Width Video Communication. Proc. SPIE, vol. 3299, Human Vision and Electronic Imaging III, 294, Jul. 1998
[72] A.K. Moorthy, C.C. Su, A. Mittal, and A.C. Bovik, Subjective Evalu-ation of Stereoscopic Image Quality. Signal Processing: Image Commu-nication, vol. 28, no. 8, pp. 870-883, 2013.
[73] N.Yun,Z.Y.Feng,J.C.Yang,J.J.Lei, The Objective Quality Assessment of Stereo Image, Neurocomputing, vol. 120, pp. 121129, 2013.
[74] J.C. Yang, Y. Liu, Q.G. Meng, R.R. Chu, Objective Evaluation Criteria for Stereo Camera Shooting Quality under Different Shooting Param-eters and Shooting Distances, IEEE Sensor Journal, published online, DOI: 10.1109/ JSEN. 2015. 2421518.
[75] P.G. Gottschalk, and J.R. Dunn, The Five-Parameter Logistic: A Char-acterization and Comparison with the Four-Parameter Logistic. Analyt-ical Biochemistry, vol. 343, no. 1, pp. 54-65, 2005.