Lei Shi
[email protected]International Digital Laboratory, WMG, University of Warwick Coventry, United Kingdom
James MacKrill
[email protected]International Digital Laboratory, WMG, University of Warwick Coventry, United Kingdom
Elisavet Dimitrokali
[email protected]International Digital Laboratory, WMG, University of Warwick Coventry, United Kingdom
Rebecca Cain
[email protected]International Digital Laboratory, WMG, University of Warwick Coventry, United Kingdom
Abstract
Improving user experiences of healthcare environments via their participation has become a central theme in healthcare studies and strategic agendas. The co-design approach is often utilized to take into account opinions from different stakeholders including hospital staff. However, there are a number of competing stimuli and demands on staff at any point in time potentially making it difficult for them to participate in the co-design processes. Digital crowdsourcing may engage staff in participating in the design and appraisal of hospital environments when they have a spare moment by collecting small amounts of relevant data. In order to explore this, we have implemented a digital crowdsourcing co-design prototype. As users’ perceived acceptance of technologies is among the determining factors for a successful digital approach, in this paper, we report on participants’ acceptance of the prototype, aiming to reflect if and to what extend they accept this prototype to aid further development.
Keywords: Healthcare environment, co-design, crowdsourcing, evaluation, acceptance.
1.
Introduction
The application of co-design [19] has been adopted by a diverse range of sectors ranging from traditional product development through to healthcare applications. Central to its applications is to understand the user perspective. Improving patient and staff members experiences of healthcare environments and services via their participation has become a central theme in health research [2] and strategic agendas [38]. This has involved different stakeholder groups in discussions about personal experiences of healthcare and how environments and services might be improved, often utilizing the co-design approach. For example, The Kings Fund [39] carried out the Patient Centered Care Project to improve the experience of breast and lung cancer treatment within a UK hospital. The investigation used “Experience-Based Co-Design” and included interviews, ethnographic observations, and group work.
Crowdsourcing [16] is the process of obtaining needed ideas, solutions or content by soliciting contributions from a large group of people. It takes the crowd’s contribution as a whole, which can potentially eliminate bias and omit missing data thus reducing risks. The emergence of crowdsourcing may fundamentally change the co-design approach as designers can now play with these “new materials” and the way of obtaining them. This introduces a new context for crowdsourcing where researchers and designers may tackle the co-design challenges in the healthcare sector.
The work presented in this paper investigates the application and use of the co-design approach and crowdsourcing technology, in order to promote situated engagement of hospital staff in the appraisal and improvement of healthcare environments. This work follows a research through design approach [36] where speculative prototypes are developed using methods from Human-Computer Interaction (HCI) and from environment and service design, as a way of learning how to best deploy such digital co-design tools [28, 29].
This paper presents a preliminary study on the implementation and evaluation of a digital crowdsourcing co-design prototype. Given the fact that participants’ acceptance of taking part in the co-design process using digital co-design tools can potentially influence the quality and quantity of their participation and contribution, their acceptance of the method is among the determining factors for the success [33]. Therefore, it is crucial to investigate if and to what extend they accept the proposed method. The results may in turn reveal the influence of the acceptance, thus suggesting further development and improvement of the method. This study was designed to understand the use of the method in a controlled environment. Therefore, this paper focuses exclusively on examining participants’ perceived acceptance of the implemented prototype, in the context of hospital ward simulated within a controlled environment. Acceptance was then assessed using a questionnaire survey designed based on a previous study [21] that applied the Technology Acceptance Model (TAM) [6].
2.
Related Work
2.1. Co-Design
Co-design is an iterative, interactive and inclusive progress where all stakeholders including researchers, designers and people formerly known as the “users” are engaged in the development of new solutions [19]. It encourages the blurring of the role between different stakeholders, focusing on the process by which design objectives are achieved. It believes that the final results will be more appropriate and acceptable to end-users by encouraging this co-creation of solutions, as the quality of design increases if the stakeholders’ interests are considered in the design process [1]. Over the past decades co-design has been widely accepted in the areas of product design, system design, service design, and human-computer interaction (HCI) [17]. A more recent study [20] theorized that this creativity-based approach requires scaffolding of the physical design space a team works in, the space constituted by participant activities, and the future solutions being developed. This normally involves methods such as workshop-based design sessions that need participants’ time commitment.
However, in the context of healthcare environment improvement where staff members have multiple demands at any point in time, there are many challenges to bring them in the co-design process using traditional workshop-based methods. Thus, the study presented in this paper aims to explore an innovative method drawing from the recent attempts to adapt the co-design approach through situated participation [35] and using social computing techniques to engage users who may be dispersed due to work activities (e.g., [9, 34]).
2.2. Crowdsourcing
conscious or aware of scrutiny towards their contribution [8]. It can be seen as a form of “open innovation”, which depends heavily on the involvement and engagement of participants [18]; it can also been seen as information probes [5] capturing small insights into the everyday concerns of participants. The offerings of crowdsourcing, its desires and aims are in a way overlapped with those of co-design, by eliciting insights from users. Therefore, linking the two approaches may provide robust, decentralized and human-scale resources to the co-design process. Thus crowdsourcing models can potentially bring in benefits to co-co-design, especially in the context of improving healthcare environments. However, it is difficult to prototype crowdsourcing platforms, as researchers and engineers are not able to precisely predict if and to what extent users will contribute the information required to make a platform valuable to them [37].
Whilst little research has been done on how to design and improve prototyping of crowdsourcing platforms, a great amount of studies have been conducted to investigate theories and practices capable of engaging and motivating participants’ contribution. Take the field of social computing for example, extensive work has been done to explore specific approaches to increase interaction, collaboration, and cooperation among individuals, as well as contribution to a community. These approaches include tightening social connection [27], visualizing social interaction [23], exposing individual performance and contribution [24], adopting gamification strategies [26], and applying motivational theories [25] such as social connectivism [31] and self-determination theory (SDT) [3]. These overarching studies can potentially contribute to the development of co-design crowdsourcing platforms. Therefore, the study presented in this paper takes into consideration these theories and practices when implementing and evaluating the prototype.
2.3. Situated Engagement
Situated engagement is the process of engaging an individual at a moment of time within a specific environment. In essence this is encouraging participation in ‘real time’ and links to the notion of developing effective co-design platforms to achieve this. Situated engagement technologies (e.g., customer feedback kiosks) offer significant potential, as developments in the co-design research process are inherently tied to technological, organizational and societal developments [13]. Within healthcare, these not only complement the existing use co-design approaches but may shed new light on complex issues, e.g., service delivery and the physical environment by drawing upon users in the ‘here and now’ of the space.
We propose that ‘situated’ crowdsourcing[15] – outsourcing a function normally carried out by particular employees to an undefined group of people via an open call [16] – may be used as a tool for this. Thus, the use of situated devices may help user-centered participation for healthcare environment design. The co-design process provides a context in which participants can articulate their values in relation to experiences, in order to generate design ideas, particularly in contexts where design possibilities or problems are poorly understood [12] such as healthcare environments. For this reason, the co-design process places emphasis on the generation of insights based on tacit knowledge through dialogues between participants, designers and researchers. By mediating this dialogue through situated engagement, a new method or tool for the design process may be developed.
3.
Implementation
3.1. Simulated Hospital Ward
The simulated hospital ward was implemented using the 3D sound room laboratory (Fig. 1, on the left), at the University of Warwick, in order to provide a crowdsourcing co-design context that could potentially promote situated engagement. The laboratory consists of a 16-speaker system plus a subwoofer together and 3 projector displays. The simulation was produced using previously obtained sound recordings and images (Fig. 1, on the right) from a cardiothoracic (CT) hospital environment. This setting was chosen in order to control (remove) variables such as time pressures, job duties and other context elements that may conflict with the formal appraisal of the digital crowdsourcing co-design prototype.
The 3D sound room
Hospital area 1: patient bay Hospital area 2: entrance
[image:4.595.106.490.204.379.2]Hospital area 3: corridor Hospital area 4: view outside
Fig. 1. The 3D sound room (on the left) and the 4 hospital areas to be improved (on the right).
3.2. Appraisal-Collecting Kiosk
The appraisal-collecting kiosk, referred to as the kiosk (Fig. 2), was implemented underpinning the following 4 key components: 1) distributed co-design [35] – participants are separated geographically or by time in the co-design process; 2) information probes [5] – small insights into the everyday concerns of participants are captured; 3) open innovation [18] – an open call for ideas about an area is presented with the sample demographic particular to an area of healthcare; and 4) situated crowdsourcing [15] – participants contribute to co-design while situated within the environment.
Paper prototyping kiosk content
[image:4.595.96.376.536.712.2]3D cardboard prototype Final Kiosk Interface layout
The kiosk was implemented using initial sketch and paper prototyping (Fig. 2, on the top left) within the research team to explore and define what information the kiosk would be required to show. Different screen layouts (Fig. 2, in the bottom left) were tried to accommodate the wish for images and text to play roles in producing and mediating tasks for users to complete. 3D cardboard prototypes (Fig. 2, center) were created to ensure that the physical design of the kiosk was able to cater for a variety of user demographics. This allowed modifications to be made and the final dimensions were decided on. The final kiosk (Fig. 2, on the right) consisted of a touchscreen attached to a stand. The touchscreen was fixed at a height suitable for use while sitting. A monitor was positioned above the touchscreen and displayed questions, text and images.
4.
Evaluation
4.1. Settings
The evaluation was conducted at the University of Warwick. 30 participants took part in the experiment. 19 (63.3%) were male and 11 (36.7%) were female. 15 (50%) were computer science PhD students, reporting being familiar with technologies; the remaining 14 (46.7%) were engineering staff and students with 1 (3.3%) math PhD student. Their ages ranged from 24 to 41 (mean 29.9, s.d. 4.17). 9 (30%) were Chinese, 5 (16.7%) were British, with the remaining 16 (53.3%) from 9 other countries.
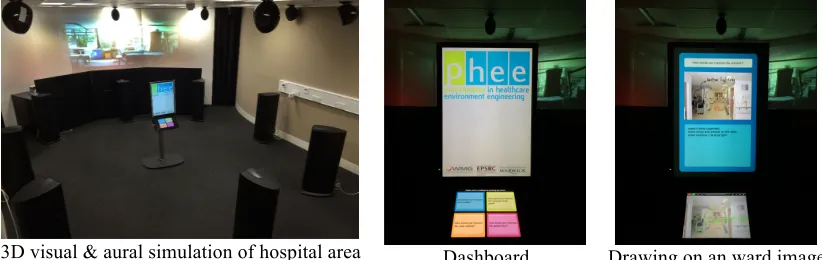
The participants were asked to sit in the 3D sound room and use the kiosk (Fig. 3, on the left) to improve four simulated cardiothoracic (CT) hospital ward areas, including the patient bay area, the ward corridor, the view outside the ward and the entrance to the ward (Fig. 1, on the right). The first screen that a participant could see was the dashboard (Fig. 3, center image), where the participant could choose which area of the CT hospital ward to improve. Then, the participant could choose to either comment on or draw on the image of the area (Fig. 3, on the right). Thereafter, the participant could go back to the previous screen(s) to choose another task (i.e., commenting on or drawing on the area image) or another area to improve. Note that there was no way to identify which suggestions were submitted by which participants.
[image:5.595.92.503.482.612.2]3D visual & aural simulation of hospital area Dashboard Drawing on an ward image
Fig. 3. The experimental environment and the kiosk.
4.2. Questionnaire Survey Design
After submitting suggestions using the kiosk, the participants were asked to fill in a questionnaire survey. The remainder of this sub-section articulates how the questionnaire was designed.
technologies can be explained mainly by 3 factors including perceived usefulness, perceived ease of use and attitude toward using [7]. Attitude toward using is a major determinant of users’ decision about whether they will use or reject the technology. Attitude toward using can be influenced by the other 2 factors, i.e., perceived usefulness and perceived ease of use, whilst perceived ease of use has a direct influence on perceived usefulness.
Fig. 4. The Technology Acceptance Model [6].
The TAM has been continuously adapted and expanded such as its adaptation to the healthcare settings [14], e-commerce settings [32] and e-learning settings [30]. One of most important expedition is TAM 2, in which additional variables are added as antecedents to the perceived usefulness variable, as the original TAM has some limitations in explaining the reasons for which a person would perceive a given system useful [32]. However, the original TAM is parsimonious and includes perceived usefulness that has consistently explained more variance in technology acceptance than other variables [22]. It also contributes to explaining the association between perceived usefulness and the important technology design variable of perceived ease of use. Therefore, the study presented in this paper adopted the original TAM, whilst adapting it to assess the evaluation of the digital crowdsourcing co-design prototype.
The TAM proposes 3 factors to examine including perceived usefulness (PU), perceived ease of use (PE) and attitude toward using. Eight statements were developed to examine the perceived usefulness and perceived ease of use, as listed below:
Perceived Usefulness (PU)
PU.1. The tool helped me to understand how to co-design the hospital ward.
PU.2. The tool engaged me to participate in co-designing the hospital ward.
PU.3. The tool inspired me to design the hospital ward.
PU.4. The tool assisted me to express and record my ideas. Perceived Ease of Use (PE)
PE.1. The tool was user-friendly.
PE.2. The tool required the fewest steps possible to accomplish what I wanted to do.
PE.3. It was easy to learn how to use the tool.
PE.4. It was easy to remember how to use the tool.
Attitude toward using the tool was measured through statements divided into two categories: satisfaction of use (SU) and confidence of use (CU), as listed below:
Satisfaction of Use (SU)
SU.1. The tool was attractive to use.
SU.2. The tool was fun to use.
SU.3. The tool was pleasant to use. Confidence of Use (CU)
CU.1. I felt confident to interact with the tool.
CU.2. I felt confident to contribute to the design.
CU.3. I felt confident that my contributions were recorded.
External Variables
Perceived Usefulness
Perceived Ease of Use
Attitude Toward Using
Behavioral Intention to
Use
Three statements were designed to test the behavioral intention (BI), as listed bellow: Behavioral Intention (BI)
BI.1. I would use the tool again for the design.
BI.2. I would use the tool frequently for the design.
BI.3. I would tell other people about the tool.
All the 17 statements were included in the questionnaire. Participants were asked to assign a rating of -2 to 2 on a 5-point Likert scale for each statement, with a rating of -2 meaning that the participant strongly disagreed with the statement, and a rating of 2 meaning that the participant strongly agreed with the statement. Ratings between these two extremes, -2 and -2, represented varying degrees of agreement. Additionally, there was an open question asking for comments on how to improve the implemented digital crowdsourcing co-design prototype.
5.
Results
5.1. Co-Design Results
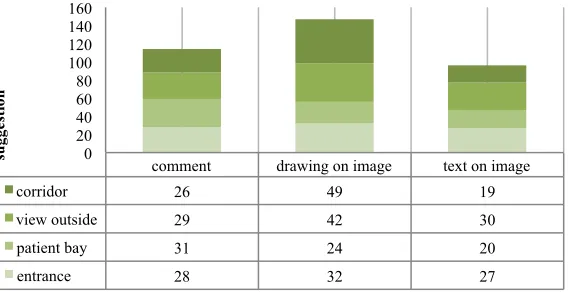
[image:7.595.161.445.478.624.2]In total, the 30 participants submitted 380 suggestions across the 4 hospital ward areas (mean 12.67, s.d. 5.35, min 25, max 30 per ward area). These suggestions include 102 for the ward corridor, 104 for the view outside the ward, 70 for the patient bay and 104 for the entrance to the ward. In total, they submitted 128 suggestions in the form of comments (mean 28.5, s.d. 2.1, min 26, max 31 per ward area), including 26 comments for corridor improvement, 29 for view outside, 31 for patient bay, and 28 for entrance. In total, they suggested 147 improvements in the form of drawing on the hospital area images (mean 36.8, s.d. 11.0, min 24, max 49 per ward area), including 49 for corridor, 42 for view outside, 24 for patient bay and 32 for entrance. In total they suggested 96 improvements in the form of written text on the hospital area images (mean 24.0, s.d. 5.35, min 19, max 30 per ward area), including 19 for corridor, 30 for view outside, 20 for patient bay and 27 for entrance.
Fig. 5. Suggestions submitted by participants
5.2. Questionnaire Results
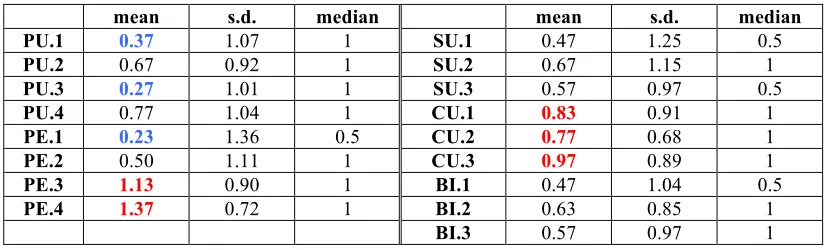
Fig. 6 presents the distribution of responses of the questionnaire survey statements, including both mean and median values of perceived usefulness (PU), perceived ease of use (PE), attitude toward using the method (including satisfaction of use (SU) and confidence of use (CU)) and behavioral intention (BI). Table 1 shows more details of the statistical results including mean values, standard deviations (s.d.) and median values.
comment drawing on image text on image
corridor 26 49 19
view outside 29 42 30
patient bay 31 24 20
entrance 28 32 27
0 20 40 60 80 100 120 140 160
su
gge
sti
Fig. 6. The questionnaire results
Table 1. The statistical results (n=30))
mean s.d. median mean s.d. median
PU.1 0.37 1.07 1 SU.1 0.47 1.25 0.5
PU.2 0.67 0.92 1 SU.2 0.67 1.15 1
PU.3 0.27 1.01 1 SU.3 0.57 0.97 0.5
PU.4 0.77 1.04 1 CU.1 0.83 0.91 1
PE.1 0.23 1.36 0.5 CU.2 0.77 0.68 1
PE.2 0.50 1.11 1 CU.3 0.97 0.89 1
PE.3 1.13 0.90 1 BI.1 0.47 1.04 0.5
PE.4 1.37 0.72 1 BI.2 0.63 0.85 1
BI.3 0.57 0.97 1
For perceived usefulness (PU), the mean values of the summative results rank between 0.27 and 0.77; their standard deviations (s.d.) are between 0.92 and 1.07; and median are all 1. 53.3% (16 out of 30) of the participants agreed or strongly agreed statement PU.1 “the method helps me to understand how to co-design the healthcare center”. 73.3% (22 out of 30) of the participants agreed or strongly agreed statement PU.2 “the method engages me to participate in the healthcare center co-design”. 53.3% (16 out of 30) of the participants agreed or strongly agreed statement PU.3 “the method inspires me to design the healthcare center”. 66.7% (20 out of 30) of the participants agreed or strongly agreed statement PU.4 “the method assists me to express and record my ideas”.
For perceived ease of use (PE), the means of the overall results rank between 0.23 and 1.37; their standard deviations (s.d.) are between 0.72 and 1.36; the medians range between 0.5 and 1. 50.0% (15 out of 30) of the participants agreed or strongly agreed statement PE.1
“the method is user-friendly”. 63.3% (19 out of 30) of the participants agreed or strongly agreed statement PE.2 “the method requires the fewest steps possible to accomplish what I want to do”. 80% (24 out of 30) of the participants agreed or strongly agreed statement PE.3
“it is easy to learn how to use the method”. 93.3% (28 out of 30) of the participants agreed or strongly agreed statement PE.4 “it is easy to remember how to use the method”.
For attitude toward using the method including satisfaction of use (SU) and confidence of use (CU), the means of the overall results rank between 0.47 and 0.97; their standard deviations (s.d.) are between 0.68 and 1.25; and the medians range between 0.5 and 1. 50% (15 out of 30) of the participants agreed or strongly agreed statement SU.1 “the method is attractive to use”. 56.7% (17 out of 30) of the participants agreed or strongly agreed statement
SU.2 “the method is fun to use”. 50.0% (15 out of 30) of the participants agreed or strongly agreed statement SU.3 “the method is pleasant to use”. 70% (21 out of 30) of the participants agreed or strongly agreed statement CU.1 “I feel confident to interact with the method”. 70% (21 out of 30) of the participants agreed or strongly agreed statement CU.2 “t I feel confident to contribute to the design”. 80% (24 out of 30) of the participants agreed or strongly agreed statement CU.3 “I feel confident that my contributions are recorded”.
For behavioral intention (BI), the means range between 0.47 and 0.57; their standard deviations (s.d.) are between 0.85 and 1.04; and the medians range between 0.5 and 1. 50.0% (15 out of 30) of the participants agreed or strongly agreed statement BI.1 “I would use the
0.00 0.50 1.00 1.50
PU.1 PU.2 PU.3 PU.4 PE.1 PE.2 PE.3 PE.4 SU.1 SU.2 SU.3 CU.1 CU.2 CU.3 BI.1 BI.2 BI.3
mean
[image:8.595.91.505.233.358.2]method again for the design”. 56.7% (17 out of 30) of the participants agreed or strongly agreed statement BI.2 “I would use the method frequently for the design”. 56.7% (17 out of 30) of the participants agreed or strongly agreed statement BI.3 “I would tell other people about the method”.
[image:9.595.88.525.189.243.2]A Cronbach’s Alphas between 0.7 and 0.9 are considered as highly reliable [4]. As shown in Table 2, all the values for each category of the statements are larger than 0.7 (‘good’ according to [11]), suggesting a high level of reliability of the results.
Table 2. Cronbach's Alpha (Reliability Statistics)
Perceived usefulness
Perceived ease of use
Attitude toward using the method
Behavioral intention
Cronbach’s Alpha 0.771 0.721 0.835 0.866
Number of items 4 4 6 3
Additionally, 18 out of 30 participants (60%) answered the open question asking for comments on how to improve the implemented digital crowdsourcing co-design prototype. These qualitative responses are generally consistent with the quantitative results from the questionnaire survey, i.e., positive perception of the acceptance of using the prototype. A number of participants expressed interest in using the prototype in the future for the healthcare co-design. They also provided some specific suggestions on further improvement of the method and the prototype. For example, one participant commented: “add zoom functionality, make the app responsive to finger touch”. Due to the space limitation, in this paper, we focus on analyzing the above-reported results from the 17 questionnaire statements using descriptive statistics. However, these qualitative responses, along with participants’ direct oral feedback after using the prototype, will be discussed (in section 6) in order to contextualize these descriptive statistics where appropriate.
6.
Discussion
This section discusses the questionnaire results reported in section 5.2. In general, Table 1 shows that all the mean and median values are greater than 0 (the neutral response), suggesting participants’ perceived acceptance of using the prototype to be positive. In this section, we focus on those highest and lowest rated statements.
6.1. Improvement of the Prototype
As shown in Table 1, PE.3 “it was easy to learn how to use the tool” and PE.4 “it was easy to remember how to use the tool” are the top 2 rated statements, whilst statement PE.1 “the tool was user-friendly” received the lowest (still positive, i.e., >0) score, among all the 17 statement. These 3 statements are all related to perceived ease of use (PE) yet reflect different perspectives. On the one hand, the prototype was perceived easy to learn and remember how to use. On the other hand, the prototype was perceived not user-friendly enough. This indicates the importance of the usability aspect of implementing a digital co-design tool. Participants verbalized these issues as the touchscreen was seen as slow and hospital images should be bigger and clearer. Therefore, in the future, we will improve these features, as well as conduct a usability study to further identify other potential issues to solve.
Table 1 also shows that the category of Confidence of Use (consists of CU.1 “I felt confident to interact with the tool”, CU.2 “I felt confident to contribute to the design” and
‘Behavioural Intention’ goes some way to support this. Although mean values are close to the neutral point, the trend indicates an intention to continue to interact with kiosk, again suggesting this (and similar technology) as an asset to co-design. Future work may look to understand how to optimize this aspect of the technology.
Additionally, from Table 1, PU.1 “the method helped me to understand how to co-design the healthcare center” and PU.2 “the method inspired me to design the healthcare center” were rated among the lowest. Qualitative feedback also contained similar concerns such as “a scenario may have aided the questions have more contextual meaning - why do we need to change or improve the design of the ward, for who, and with what considerations?” This concern may have been due to the simulated hospital environment, as the simulation may not have created a full sense of immersion and so additional context was needed. However, this does raise an interesting point of how to create an immersive simulated healthcare environment as a way not only to improve design, but also aid the development of co-design methods. This will be further discussed in section 6.2.
6.2. Limitation and Future Study
The study presented in this paper was conducted in a simulated context, i.e., the visual and aural simulation of a CT hospital ward. In the future we will explore the use of the digital crowdsourcing co-design prototype in-situ. Insights and suggestions from this study will allow modification to be made and further in-situ studies to refine its development be carried out. Moreover, this study focused on exploring only hospital staff acceptance of using the method. In the future we will explore the acceptance from healthcare stakeholders’ perspective such as patients and patients’ family; we will also further divide the hospital staff stakeholder category into finer-grained roles such as doctors, nurses, cleaners and administrators. We suspect that different roles may perceive the digital method differently; they may have difference expectations from the method and difference ways of using the method. The further study will contribute to the personalization of the digital crowdsourcing co-design tool, thus improving the effectiveness and efficiency of the crowdsourcing co-design process. Although a low number of participants took part in the study, reliability of the responses Cronbach’s Alpha suggested a high level of reliability. However, we will conduct future experiments in the context of real-world healthcare environment, expecting to engage more participants to take part in the study, which will also increase the number of participants.
7.
Conclusion
In this paper, we have reported a preliminary exploration of the co-design approach and crowdsourcing techniques for improving healthcare environments. In particular, we have presented a digital crowdsourcing co-design prototype, including its implementation and evaluation, in order to learn how to best deploy such digital tools that can potentially engage and motivate hospital staff to take part in the improvement of their own working space. The implementation focused on the experiment setting-ups including the visual and aural simulation to a cardiothoracic (CT) hospital ward environment, as well as the hardware and software of an appraisal-collecting kiosk. The evaluation focused on investigating if and to what extent participants accepted using the implemented prototype.
Acknowledgements
The study has been financially supported by the EPSRC-funded project “Participation in Healthcare Environment Engineering” under the grant agreement number EP/H022031/1.
References
1. Albinsson, L., Lind, M., Forsgren, O.: Co-design: an approach to border crossing, network innovation. Expand. Knowl. Econ. Issues Appl. Case Stud. 4 (Part 2), 977–983 (2007)
2. Bate, P., Robert, G.: Experience-based design: from redesigning the system around the patient to co-designing services with the patient. Qual. Saf. Health Care. 15 (5), 307–310 (2006)
3. Beachboard, M., Beachboard, J., Li, W., Adkison, S.: Cohorts and relatedness: Self-determination theory as an explanation of how learning communities affect educational outcomes. Res. High. Educ. 52 (8), 853–874 (2011)
4. Carmines, E.G., Zeller, R.A.: Reliability and validity assessment. Sage (1979)
5. Church, K., Cherubini, M., Oliver, N.: A Large-scale Study of Daily Information Needs Captured in Situ. ACM Trans Comput-Hum Interact. 21 (2), 10:1–10:46 (2014)
6. Davis, F.D.: Perceived usefulness, perceived ease of use, and user acceptance of information technology. MIS Q. 13 (3), 319–340 (1989)
7. Davis, P.R.: A technology acceptance model for empirically testing new end-user information systems: Theory and results. Massachusetts Institute of Technology (1986) 8. DeVun, L.: Looking at how crowds produce and present art. Wired News Web. 19 (2009) 9. Dittrich, Y., Eriksén, S., Wessels, B.: Learning through Situated Innovation: Why the
specific is crucial for Participatory Design Research. Scand. J. Inf. Syst. 26 (1), 29–56 (2014)
10. Donetto, S., Tsianakas, V., Robert, G.: Using Experience-Based Co-Design (EBCD) to improve the quality of health care: Mapping where we are now and establishing future directions. Lond. Natl. Nurs. Res. Unit King’s Coll. (2014)
11. Field, A.: Discovering statistics using IBM SPSS statistics. Sage (2013)
12. Halloran, J., Hornecker, E., Stringer, M., Harris, E., Fitzpatrick, G.: The value of values: Resourcing co-design of ubiquitous computing. CoDesign. 5 (4), 245–273 (2009)
13. Halskov, K., Hansen, N.B.: The diversity of participatory design research practice at PDC 2002–2012. Int. J. Hum.-Comput. Stud. 74 81–92 (2015)
14. Holden, R.J., Karsh, B.-T.: The Technology Acceptance Model: Its past and its future in health care. J. Biomed. Inform. 43 (1), 159 – 172 (2010)
15. Hosio, S., Goncalves, J., Lehdonvirta, V., Ferreira, D., Kostakos, V.: Situated Crowdsourcing Using a Market Model. In: Proceedings of the 27th Annual ACM Symposium on User Interface Software and Technology. pp. 55–64. ACM, New York, NY, USA (2014)
16. Howe, J.: The rise of crowdsourcing. Wired Mag. 14 (6), 1–4 (2006)
17. Muller, M.J.: Participatory design: The third space in HCI. Hum.-Comput. Interact. Dev. Process. 165–185 (2003)
18. Rouse, A.C.: A preliminary taxonomy of crowdsourcing. ACIS 2010 Proc. (76), (2010) 19. Sanders, E.B.-N., Stappers, P.J.: Co-creation and the new landscapes of design. Co-Des. 4
(1), 5–18 (2008)
20. Sanders, E.B.-N., Westerlund, B.: Experiencing, exploring and experimenting in and with co-design spaces. Nordes. (4), (2011)
21. Shi, L.: Defining and Evaluating Learner Experience for Social Adaptive E-Learning. In: Neykova, R. and Ng, N. (eds.) 2014 Imperial College Computing Student Workshop. pp. 74–82. Schloss Dagstuhl–Leibniz-Zentrum fuer Informatik, Dagstuhl, Germany (2014) 22. Shi, L., Awan, M.S., Cristea, A.I.: Evaluation of social personalized adaptive e-learning
23. Shi, L., Cristea, A.: Designing visualisation and interaction for social e-learning: A case study in Topolor 2. In: Rensing, C., de Freitas, S., Ley, T., and Muñoz-Merino, P. (eds.) Open Learning and Teaching in Educational Communities. pp. 526–529. Springer International Publishing (2014)
24. Shi, L., Cristea, A., Hadzidedic, S.: Multifaceted open social learner modelling. In: Popescu, E., Lau, R.H., Pata, K., Leung, H., and Laanpere, M. (eds.) Advances in Web-Based Learning – ICWL 2014. pp. 32–42. Springer International Publishing (2014) 25. Shi, L., Cristea, A., Hadzidedic, S., Dervishalidovic, N.: Contextual gamification of
social interaction – towards increasing motivation in social e-learning. In: Popescu, E., Lau, R.H., Pata, K., Leung, H., and Laanpere, M. (eds.) Advances in Web-Based Learning – ICWL 2014. pp. 116–122. Springer International Publishing (2014)
26. Shi, L., Cristea, A.I.: Making it game-like: Topolor 2 and gamified social e-learning. In: The 22nd Conference on User Modeling, Adaptation and Personalization (UMAP 2014). pp. 61–64. , Aalborg, Denmark (2014)
27. Shi, L., Cristea, A.I., Hadzidedic, S.: The critical role of profiles in social E-learning design. In: Proceedings of the 15th Annual Conference on Information Technology Education. pp. 71–76. ACM, New York, NY, USA (2014)
28. Shi, L., Dawson, C., MacKrill, J., Dimitrokali, E., Cain, R.: Digital Co-design: A Future Method? In: Proceedings of the 2015 British HCI Conference. pp. 295–296. ACM, New York, NY, USA (2015)
29. Shi, L., MacKrill, J., Dimitrokali, E., Dawson, C., Cain, R.: Digital Co-Design Applied to Healthcare Environments: A Comparative Study. In: Proceedings of he 15th IFIP TC.13 International Conference on Human-Computer Interaction. Springer International Publishing (2015)
30. Shi, L., Stepanyan, K., Al Qudah, D., Cristea, A.I.: Evaluation of social interaction features in topolor - a social personalized adaptive e-learning system. In: Proceedings of the 13th IEEE International Conference on Advanced Learning Technologies. pp. 15–18. (2013)
31. Siemens, G.: Connectivism: A learning theory for the digital age. Int. J. Instr. Technol. Distance Learn. 2 (1), 3–10 (2005)
32. Venkatesh, V., Bala, H.: Technology Acceptance Model 3 and a Research Agenda on Interventions. Decis. Sci. 39 (2), 273–315 (2008)
33. Venkatesh, V., Thong, J.Y., Xu, X.: Consumer acceptance and use of information technology: extending the unified theory of acceptance and use of technology. MIS Q. 36 (1), 157–178 (2012)
34. Walsh, G.: Distributed participatory design. In: CHI’11 Extended Abstracts on Human Factors in Computing Systems. pp. 1061–1064. ACM (2011)
35. Walsh, G., Druin, A., Guha, M.L., Bonsignore, E., Foss, E., Yip, J.C., Golub, E., Clegg, T., Brown, Q., Brewer, R., Joshi, A., Brown, R.: DisCo: A Co-design Online Tool for Asynchronous Distributed Child and Adult Design Partners. In: Proceedings of the 11th International Conference on Interaction Design and Children. pp. 11–19. ACM, New York, NY, USA (2012)
36. Zimmerman, J., Forlizzi, J., Evenson, S.: Research through design as a method for interaction design research in HCI. In: Proceedings of the SIGCHI conference on Human factors in computing systems. pp. 493–502. ACM (2007)
37. Zimmerman, J., Tomasic, A., Garrod, C., Yoo, D., Hiruncharoenvate, C., Aziz, R., Thiruvengadam, N.R., Huang, Y., Steinfeld, A.: Field trial of tiramisu: crowd-sourcing bus arrival times to spur co-design. In: Proceedings of the SIGCHI Conference on Human Factors in Computing Systems. pp. 1677–1686. ACM (2011)
38. The ebd approach (experience based design) - NHS Institute for Innovation and Improvement, http://ow.ly/KR0PG, Accessed: March 25, 2015
39. The patient-centred care project: Evaluation Report August 2011,

![Fig. 4. The Technology Acceptance Model [6].](https://thumb-us.123doks.com/thumbv2/123dok_us/8046461.222393/6.595.92.503.146.258/fig-the-technology-acceptance-model.webp)