COMMISSION OF THE EUROPEAN COMMUNITIES
A STUDY OF THE EVOLUTION
OF CONCENTRATION
IN THE DANISH
FOOD PROCESSING INDUSTRY
Through an empirical study of concentration the Commission can base its competition policy on detailed knowledge of industrial structures.
The following report will help to establish the basic features of the concentration process in the Danish food processing industry.
The Commission has already published several reports concerning the evolution of concentration and of competition in the food processing industry in France (2 volumes). in the United Kingdom (3 volumes), in Germany, in Italy, in the Netherlands, in Ireland and in Belgium.
COMMISSION OF THE EUROPEAN COMMUNITIES
A STUDY OF THE EVOLUTION
OF CONCENTRATION
IN THE DANISH
FOOD PROCESSING INDUSTRY
©
Copyright ECSC/EEC/EAEC, Brussels and Luxembourg, 1976 Printed in BelgiumPREFACE
The present volume is part of a series of sectoral studies on the evolution of concentration in the member states of the European Community.
These reports were compiled by the different national Institutes and experts, engaged by the Commission to effect the study programme in question.
Regarding the specific and general interest of these reports and the responsibility taken by the Commission with regard to the European Parliament, they are published wholly in the original version.
The Commission refrains from commenting, only stating that the responsibility for the data and opinions appearing in the reports, rests solely with the Institute or the expert who is the author.
Other reports on the sectoral programme will be published by the Commission as soon as they are received.
Concentration in the Danish Food Processing Industry
Part I: Industry Structure and Concentration
1969-74
A Report prepared for the
Directorate Generale for Competition of the Commission of the European Communities
by
Institute for Futures Studies
lnstituttet for Fremtidsforskning -
Institute for Futures Studies
POSTAL ADDRESS
Vl·Stt:' Far111lil']5!Jade 3
OK 1606 Kobenhavn V
Den :nark
TELEPHONE
01 I 11 71 76
POSTAL ACCOUNT
8187673
BANK ACCOUNT_
DEN DANSKE BANK af 1871 Afdelrng Frrhed5stotten
This report commissioned by the Directorate Generale for
Competition of the Commission of the European Communities
has been carried out by Institute for Futures Studies,
under the direction of Professor Th. Kristensen and
Professor Th. Herborg Nielsen. The present report is
prepared by cand.oecon Jens Vestergaard, who have full
responsibility for the content of the report.
The report is translated by stud. ling.merc. B • . Andersen.
Contents
I
I,l
I,2
I,3
T!:.e
Da~1ish Food Industr,y • • • •
.
.
The Size of the Food Industry in 1974 • • • • • • • • • • • • •
The Development of the Food Industry 1954-74 • • • • • • • • • •
The Size and Development of the Food Industry in Rel2..tion to the
Rest of the Danish Industry • • • • • • • • • • • • • • • • • •
I,4 Main Features of the Development in Agricultural Production
page n /
9
a ./l ,
_Ll.
1965-74 • • • • • • • • • • • • • • • • • • • • • • • • • • • •
13
I,5 Main Features of the Character and Development of the Danish
Food Industry During tie Period 1965-74 • • • • • • •
• •
25
I,6
I,7
Distribution of the Food Industry on Trades
• •
Denmark's Imports and
~cportsof Food, 1964-74 •
• • • •
.
.
• •
35
28
I,8 Ownership and Structural Development of the Food Industry • • •
41
I,9 The Development in
Dom~sticConsumption of Food and
Stimulants Products
• • • • • • • • • • • • • • •
• •
I,lO The Dairy Sector •
•
• • • • • •
•• • • •
• •
I I
Description of the Largest Enterprises within the Danish
. .
.
• • •
Food Industry • • • • • • • • • • • • • • • • • • • • • • • • •
II,l The Fields of Activity, etc. of the 10 Largest
Enterprises • • • • • • • • • • • • • • • • • • • • • • • •
45
50
69
II,2 Description of the 10 Largest Food Enterprises • • • • • • • • •
71
III List of Multinational Enterprises Posessing Interests in the
Danish Food and Stimulants Industry • • • • • • • • • • • • • • 127
IV
Character, Importance and Development of the Cooperative
Ent erpri.s es
• • • • • • • • • • • • • • • • • • • • • • • • • • 133
v
VI
The Concentration
I~easurings• • • • • • • • • • • • • • • • • •
Delimitation of the Food Industry • • • • • • • • • • • • • • •
Enterprises and Data • • • • • • • • • • • • • • • • • • • • • •
The size of the Test Srunple in Relation to the Total Food
Industry 1973
• • • • • • • • • • • • • • • • • • • • • • • • •
Interpretation of the Concentration Measurings •
• •
. .
.
•
• •
VI,l Changes in the Nine Variables Describing the Development in
the Largest Food Processing Companies 1969-74 • • • • • • •
• •
VI,2 The 1969 and 1974 Level of Concentration
• • • • • • • •
• •
VI,3 Concentration Indices
•
•
•
• • • • • •
••
• •
•
• • • • • • •
VI,4 The Development in Concentration Measured by CR
4
and CR
8
1969-74 • • • • • • • • • • • • • • • • • • • • • • • •
• • • •
VI,5 The Development in Concentration 1969-74 Measured
137
137
138
142
143
143
146
149
150
by V, G,H, E and L
s• • • • • • • • • • • • • • • • • • • • • • 153
VI,6 Characterising the Concentration Process for the Danish Food
Industry 1969-74 • • • • • • • • • • • • • • • • • • • • • • • • 165
VII Summary and Main Conclusions • •
. .
.
•• •
•
•
••
••
•
171
General Introduction to Appendices
A
andB • • •
•
• •
••
• •
• •
17)
Appcnd.i:::: A Concentrc..tlor:. indices for the Dauish Foocl
Industr;y 1r:i t:l Beverage • • • • • • • • • • • • • • •
187
Appendix
B
Concentratio~ indices for the Danish FoodIndustr:I vri t:::wut 3everage • • • • • • • • • • • • • • 2].3
Appenclix C Inequality ~atrixeo for the indiviJual years for
D~·wish Pood Inoustry id t t and ~Ji thout Bevcrac;c •
8
I. The Danish Food Ia,gustq.
I , l The Size of the Food Industry In 1974
The food industry and the industries providing the food industry with raw materials is an important element in the Danish society. In
1974 the primary industries, agriculture, horticulture, and the
fishing industrt~ accounted for 8 per cent of the gross factor income and the food industry for 4.2 per cent.
In 1974 the value added of the food industry accounted for approx. 20 per cent of total value added of the Danish industry.
I,2 The Development of the Food Industry 1254-74
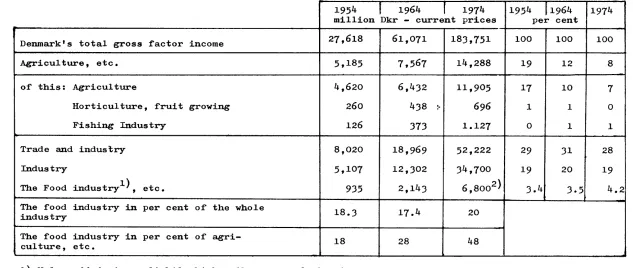
During the period 1954 to 1974 the total gross factor income in
Denmark has increased from 27,000 million Dkr. to 184,000 million Dkr., i.e. a sevenfold increase. During the same period the gross
factor income in the primary industries has almost trebled, while the value added of the food industry has experienced a sevenfold increase. Thus, the relative importance of the food industry for the Danish society has remained fairly unchanged during the period, while the agricultural value added has been relatively falling.
The trends of the development are illustrated in Table I,2.
In 1954 the sum of the value added of the primary industries and the food industry amounted to some 22 per cent of total value
ad-ded of the Danish society. In 1974 the corresponding figure was
some 12 per cent.
The development may also be illustrated by looking at the relative
distribution of the value added o~ the primary industries and the food industry. It appears from Table I,2 that in 1954 the value added of the food industry was 18 per cent of that of agriculture.
In 1964 and 1974 this share had risen to 28 per cent and 48 per cent, respectively. Thus, to an ever increasing extent the value added of the Danish food production falls within the food industry
rather' than within the primary industries.
Table I,2. The Size and Development of the Food Industty 1954-74.
1954
I
1964r
1974 1954 J1964 1974million Dkr - current prices per cent
Denmark's total gross :factor income 27,618 61,071 183,751 100 100 100
Agriculture, etc. 5,185 7,567 14,288 19 12 8
of' this: Agriculture 4,620 6,432 11,905 17 10 7
Horticulture, :fruit growing 260 438 :- 696 1 1 0
Fishing Industry 126 373 1.127 0 1 1
Trade and industry 8,020 18,969 52,222 29 31 28
Industry 5,107 12,302 34,700 19 20 19
The Food industry1 ), etc. 935 2,143 6 8oo2>
'
J.4 3-5 4.2The food industry in per cent of the whole
18.3 17.4 20
industry
The :food industry in per cent of' agri- 18 28 48
culture, etc.
[image:12.770.90.723.82.350.2]1,3 The Size and Development o~ the Food Industry In Relation To the Rest of' the Danish Industry
Table
I,3
gives a survey of' the total industrial value added and that of' the ~ood industry.During the period
1965-74
the value added of' the food industry has more than doubled. The development of the whole industry hasf'ollowed the same pattern.
During the whole period the food industry has had a stable share
of 20 per cent o~ the value added o~ the Danish industry.
-
t..:lTable 1,3. ~alue Added of the Food Indust~n Relation To Industrial Value Added 1965-!21±·
1965 1966 1967 1968 1969 1970 1971 1972 1973
Value added of the food industry 3,08
3,31 3,58 3,84 4,24 4,63 5,25 5,89 6,11 ) 1000 million Dkr
Total industrial value added 15,4 16,3 17,4 19,1 22,2 23,8 25,4 28,9 30,9 1000 million Dkr
Relative share of the food 20 20 21 20
19 19 21 20 20 industry per cent
1) estimated figures
1974
6,8 1 )
34,7
I,4 Main Feat~ of th~~pment ln_!gricultural Production
1965-74
---A large proportion of the Danish food industry is based on repro-cessing of marketing products from Danish agriculture. There are reasons, therefore, for estimating the recent and future
develop-ment of the Danish food industry in the light of recent and future developments in the production of marketing products of Danish
agriculture.
In order to elucidate the recent development in Danish agriculture,
the following tables illustrate the development during the period
1963/64
to1973/74.
The main features of the recent development may be characterised
in the following way.
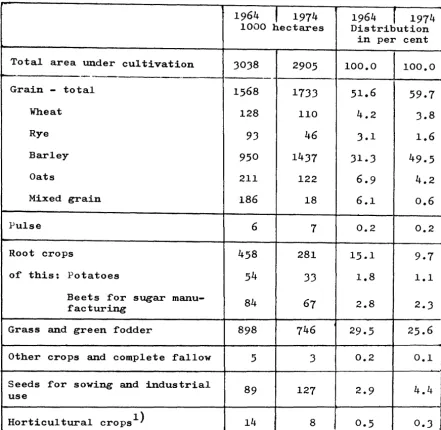
The total area under cultivation has been fairly unchanged during
the period
1964-74.
A slight reduction of3
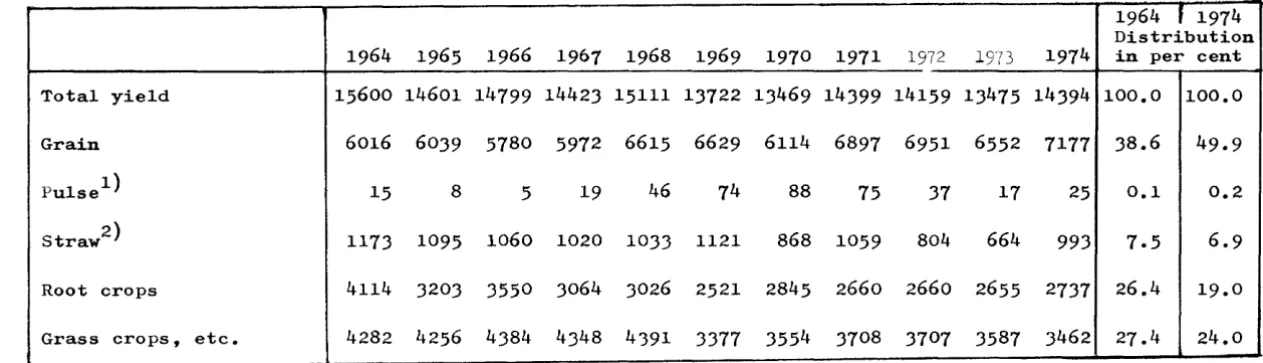
per cent should be noticed, however. Area under grain has increased from 52 per cent of the total area to approx. 60 per cent. The increase has taken place at the expense of root crops and grazing areas.The total yield of the areas under cultivation measured in crop
units has fallen by
8
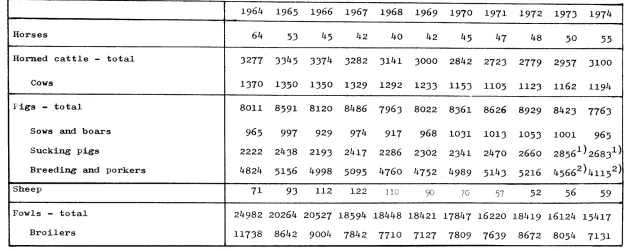
per cent.During the period dairy stock has fallen by
13
per cent,while the pig population has been fairly stable.During the period the number of whole-year workers has decreased
by 90,000, i.e. a reduction of 40 per cent.
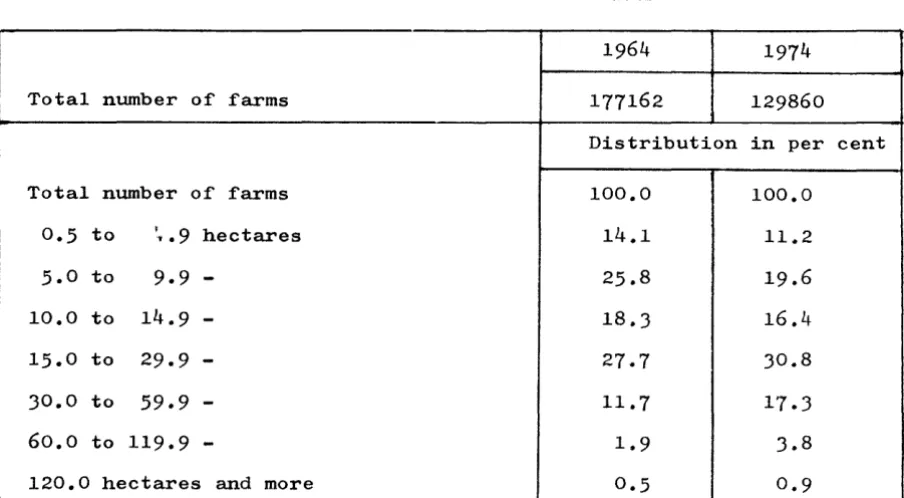
The number of farms has fallen by 40,000 and the average size of
farms has increased from approx.
17
hectares to 22 hectares.Real gross investments in agriculture have increased from 1,600 million Dkr per annum to 4,000 million Dkr in current prices, i.e.
an increase of 150 per cent. In real terms the increase has been
21 per cent.
As far as the animal production and its use is concerned, the fol-lowing main features should be noticed:
Milk production has fallen by
8
per cent. Butter production has fallen by 8 per cent. Cheese production has risen by 10 per cent.The production of beef and veal has fallen by 10 per cent. The production of pork has been slightly increasing.
The production of poultry meat has been increasing, while duction has decreased.
egg
pro-The quantity indices for agricultural marketing products reveal
an increase of
5
per cent during the ten-year period. The major part of this increase is ascribable to vegetable marketing productswhich has increased especially since
1971/72.
The price indices for agricultural marketing products have increased
by a total of
87
per cent, somewhat less than the increase inagri-cultural raw and subsidiary materials.
The prlce increases, especially for vegetable products, have
occur-red after the accession to the Common Market in
72/73.
The development in prices, when related to the general development
of prices or to the development in prices of agricultural raw and
subsidiary materials, has resulted in a deterioration of the terms
of trade between agricultural products and other products.
This deterioration of the terms of trade is mitigated by an increase in efficiency in agricultural production. It is difficult to provide
exact measurements of the increase in efficiency, but the
develop-ment is illustrated by the fact that, in spite of a reduction in
employment of
40
per cent and an increase in real gross investmentsof only 20 per.,cent over a ten-year period (measured in real terms},
the industry has been able to expand total production of marketing
products by
5
per cent.The present estimate of the development is documented in Tables
I,4,1
to10.
Table I,4,1 Total Agricultural_Area and Use of This Area
1964 _I 1974 1964 _r 1974
1000 hectares Distribution
in per cent
Total area under cultivation 3038 2905 100.0 100.0
Grain - total 1568 1733 51.6
59.7
Wheat 128 110 4.2 3.8
Rye 93 46 3.1 1.6
Barley 950 1437 31.3 49.5
Oats 211 122 6.9 4.2
Mixed grain 186 18 6.1 0.6
Pulse 6 7 0.2 0.2
Root crops 458 281 15.1 9.7
of this: Potatoes 54 33 1.8 1.1
Beets for sugar manu- 84
67 2.8 2.3
facturing
Grass and green fodder 898 746 29.5 25.6
Other crops and complete fallow 5 3 0.2 0.1
Seeds for sowing and industrial
89 127 2.9 4.4
use
Horticultural crops1) 14 8
0.5
0.3 I1) ~eluding vegetables, fruit growing and nursery areas on farms
larger than
o.5
hectares. [image:17.531.30.471.100.530.2]Table
I,4,2
Total Yield of Danish Agriculture (Millions of feed units, 1 feed unit being equal to the fodder value of 1 kg barley).1964
f
1974
Distribution
1964 1965 1966 1967 1968 1969 1970 1971
1972 19731974
in per centTotal yield
15600 14601 14799 14423 15111 13722 13469 14399 14159 13475 14394 100.0 100.0
Grain
6016 6039 5780 5972 6615 6629 6114 6897 6951 6552 7177 38.6
49.9
Pulse
1 )
15
8
5
19
46
74
88
75
37
17
25
0.1
0.2
Straw
2)
1173 1095 1060 1020 1033 1121
868 1059
804
664
993
7.5
6.9
Root crops
4114
3203 3550 3064 3026 2521 2845
2660 2660 2655
2737
26.4
19.0
Grass crops, etc.
4282 4256 4384 4348 4391 3377 3554 3708 3707 3587 3462 27.4
24.0
[image:18.773.85.717.122.303.2]Table I,4,3 Livestock of Danish Agriculture {in thousands)
1964 1965 1966 1967 1968 1969 1970 1971 1972 1973 1974
Horses 64 53 45 42 40 42 45 47 48
50 55
Horned cattle - total 3277 3345 3374 3282 3141 3000 2842 2723 2779 2957 3100
Cows 1370 1350 1350 1329 1292 1233 1153 1105 1123 1162 1194
Pigs - total 8011 8591 8120 8486 7963 8022 8361 8626 8929 8423 7763
Sows and boars 965 997 929 974 917 968 1031 1013 1053 1001
965
Sucking pigs 2222 2438 2193 2417 2286 2302 2341 2470 2660 28561 )26831 )
Breeding and porkers 4824 5156 4998 5095 4760 4752 4989 5143 5216 4566 2 )4115 2 )
Sheep 71 93 112 122 110
90 70 57 52 56 59
Fowls - total 24982 20264 20527 18594 18448 18421 17847 16220 18419 16124 15417
Broilers 11738 8642 9004 7842 7710 7127 7809 7639 8672 8054 7131
[image:19.770.90.721.65.316.2]Table
I,4,4
Labour In Danish Agric~~(1000
whole-year workers).Working year
1963/64 64/65 65/66 66/67 67/68 68/69 69/70 70/71 71/72 72/73 1973/74
Whole-year workers
229,8 214,5 1>7,7 193,6 188,0 177,7 174,3 173,0 163,4 161,3 140,8
Table I,4,5 ~ber o~ Farms and Thei£_§~1964~.
1964 1974
Total number o~ farms 177162 129860
Distribution in per cent
Total number of farms 100.0 100.0
0.5
to ,'11'. 9 hectares 14.1 11.25.0
to 9.9 - 25.8 19.610.0 to 14.9 - 18.3 16.4
15.0 to 29.9 - 27.7 30.8
30.0 to 59.9 - 11.7 17.3
6o.o to 119.9 - 1.9 3.8
120.0 hectares and more
0.5
0.9 [image:21.526.34.486.71.320.2]Table I,4,6 Investments In Danish Agriculture.
Million Dkr - current prices
1963 1964 1965 1966 1967 1968 1969 1970 1971 1972 1973
Total gross investments 1338 1986 2033 1879 1858 1712 1947 1828 2284 3222 4115
Inventory and stock changes -267 122 92 -67 -116 -114 -9 -386 -118 295 140
Real gross investments 1605 1864 1941 1946 1974 1826- 1956 2214 2402 2927 3975
Million Dkr - 1955 prices
Total gross investments 913 1430 1347 1147 1025 1128 1048 810 1072 1280 1385
Inventory and stock changes -269 118 77 -57 -111 135 33 -241 20 84 -45
Table
1,4,7
Assets and Liabilities of Danish Agriculture.Million Dkr at the end of the year
1964
1965
1966
1967
1968
1969
1970
1971
1972
1973
1974
Assets
36860 42616 46082 48799 47034 48548 56029 60292 69927 86411
-I
Table I,4,8 Animal-Production of Danish Agriculture and Its Use (million kg per business year (1st July-30th June)
1963/64 64/65 65/66 66/67 67/68 68/69 69/70 70/71 11112 72/73 73/74
Production of milk 5157 5322 5339 5282 5153 5038 4646 4396 4541 4723 4777
of this used for:
Production of butter 2980 3185 3236 3092 3105 3006 2680 2471 2573 2812 2824
Production of: cheese 810 737 764 838 692 671 660 717 766 773 8)0 Production of liquid milk, cream 6)6
629 6)1 6)5 64) 655 690 689 684 6.38 584 and ice cream
Consumption and l)
fodder at the producers 400 400 400 400 375 )50 275 200 200 200 200 Tinned milk, exports, etc. 331 371 )08 317 338 356 341 319 )18 300 339
Production of: butter 151,0 162,3 16),7 155,5 159,1 153,0 1)5,1 125,1 1)2,5 144,1~ 139,7 Of this: exports 96,6 109,8 117,4 105,5 106,8 106,7 95,5 82,7 81.8 96,2 109,4 domestic consumption2) 49,2 49,0 47,5 47,2 45,5 45,2 44,9 4),9 42,8 40,8 4),6
Production of: cheese 126,5 114,7 119,7 129,3 109,5 106,9 108,2 115,1 125,9 129,0 137,7
or this: exports)) 77,9 79,2 72,6 8),) 68,) 59.1 62,6 67,7 72,6 76,0 89,4 domestic consumption 4),4 42,2 42,3 42,9 4),3 47,3 45,1 46,8 50,) 52,5 48,2
Production of: beef and vea14J 259,7 235,5 255,5 268,4 265,1 257,7 249,8 234,2 206,0 194,7 2)0,)
Of: this: exports of: live animals 87,5 68,7 74,9 )6,0 )8,4 4),4 41,5 21,5 11,4 9,3 4,5 exports of: beef: and veal5) 79,0 77,9 85,7 114,3 129,1 100,7 90,7 97,6 92,1 98,0 131,)
exports of )
edible by-products5 3,6 3,5 .3,4 4,8 5,.3 4,6 4,1 ),1 2,5 2,5 4,2 domestic consumption4) 88,8 84,4 90,1 105,8 97,3 108,2 112,) 111,1 99,2 84,0 82,7
I
Production of' pork6) 71B,8 779,1 807,6 781,3 793,3 741,2 76),7 797,2 81),4 826,5 824,0or this: exports of' live animals 22,7 19,2 )),1 25,5 22,6 26,8 25,9 19,1 17,1 24,5 20,6 exports of' pork5) 502,8 555,4 598,8 564,5 571,6 550,0 551,4 582,5 58),4 584,8 598,6 exports of )
10,6 11,4 9,6
edible by-products5 9 .• 9 10,5 9,3 9,2 9,0 9,6 11,0 12,8 domestic consumption') 170,) 17),4 175,7 172,8 172,1 16J,7 166,6 170,2 184,5 195,2 182,4
~roduction of poultry meat7 ) 70,1 73,0 65,4 69,2 6),2 65,4 74,7 80,4 8),0 89,0 95,2 Of this: exports 54,6 51,9 49,4 46,9 45,8 46,7 51,5 54,2 56,) 57,1 54,4 domestic consumption 17,1 18,4 18,5 19,9 18,1 19,5 21,9 24,6 25,9 Jl,J .34,4
Production of eggs 104,0 93,6 89,1 89,3 86,3 87,7 89,8 79,3 72,9 74,9 71,3 Of this: exports 35,1 28,1 26,2 26,4 25,4 26,6 28,3 19,6 12,9 16,7 11,6
domestic consumption 58,8 59,0 59,1 58,7 57,4 56,4 55,1 54,4 53,8 52,7 55,0
1) Notice that total consumption at producers has been reduced several times during the period. Of the total rated consumption, the consumption f'or fodder constituted 200 million kg until 1969 and from
1970 125 million kg. The rest is accounted f'or by producers' consumption.
2) ~1rom 1973 small amounts of butter have been imported. They have been used mainly in bakeries.
J) Exports of processed cheese have been converted into hard cheese.
4) Including edible by-products, which refer to liver, heart, kidneys, tongue, midriff, head meat, tail, reticulum, and sweetbread. From 1st January 1974 the kidneys are included in the carcase.
5) Including the quantities of bee~ and veal and the quantities of pork, respectively, used in the prow duction of exported tinned meat and cooked meat products.
6) Including edible by-products wldch refer to liver, heart, kidneys, tongue and midri~f. 7) The :figures ror poultry meat state ready-to-cook weight.
Table I,4,9 Quantity and Price Index ex Farmer For Sales o£ Agricultural Products and For ConsumE1!2B
o£ Purchased Raw and Subsidiary Materials.
1963/64
=
100Quantity Ind2 1963/64 64/65 65/66 66/67 67/68 68/69 69/70 70/71 71/72 72/73 73/74
Total Agricultural marketing products 100 106 105 105 105 103 102 99 102 103
Vegetable marketing products 98 126 104 101 107 119 112 95 122 121
Animal marketing products 100 103 106 106 105 101 101 100 99 101
Milk. Net sales index1) 100 102 103 103 101 99 92 89 94 98
Eggs 100 89 85 85 82 83 85 75 68 70
Meat 100 104 108 108 108 103 105 106 103 103
Consumption o£ purchased raw and 100 101 101 104
99 92 98 102 100 103
subsidiary materials
}'rice Index
Total agricultural marketing products 100 101 103 104 104 107 122 12) 134 161
Vegetable marketing products 102 98 110 107 102 99 128 119 117 150
Animal marketing products 100 101 102 104 104 108 122 124 136 162
Milk 100 100 106 106 112 112 129 139 160 175
Eggs 100 106 116 112 115 115 105 108 118 117
Meat 100 101 100 103 99 105 119 118 125 159
Consumption o£ purchased raw and
100 102 107 108 109 112 117 123 126 157
subsidiary materials
1) Net sales index is de£ined as total sales corrected £or the quantity o£ skim-milk, buttermilk, and
whey repurchased and used for fodder.
105
123
103
99 67
107
104
187
191
187
211
151
178
Table I,4,10 l·roduction
~e
and Gross Factor Income For Agricultural~ro~
1)(Million
Dkr per busi-ness year (1st July- 30th June) -current prices).1963/64 64/65 65/66 66/67 67/68 68/69 69/70 70/71 71/72 72/73 73/74
Total value of agricultural 8048 8505 8736 8833 8816 8881 10046 9893 10818 13211 15823 marketing products
Vegetable marketing products 869 1072 998 933 946 1023 1187 979 1220 1517 1956 Animal marketing products 7179 7433 7738 7900 7870 7858 8859 8914 9598 11694 13867 Milk. Net sales value2) 1930 1972 2121 2128 2208 2177 2364 2460 3007 3483 4174
Eggs 336 317 328 320 315 321 301 272 272 277 338
Meat 4913 5144 5289 5452 5347 5360 6194 6182 6319 7934 9355
Gross factor income 5282 5725 5715 5684 5696 6035 6662 6056 7282 8395 10103
Gross factor income plus general
5551 6002 5834 5853 5880 6248 6871 6322 7561 8687 10160 direct distributions3)
1) Until Jlst January including all national product subsidies, and from 1st February 1973 including the share received by agriculture of product subsidies granted by EC's agricultural fund (FEOGA).
2) The net sales value for milk is equal to the total value of milk sales minus expenditure on repurchases of milk for fodder.
1,5 Main Features of the Character and Developm~2!_!~~~
Food Industry
During
the PeriodJ965-74
The present investigation illustrates the development ~ the total
Danish food industry, i.e. i t includes the food industry in the
narrow sense together with the beverages and tobacco industries.
The main data concerning the development in the food industry are
given in Table 1,5.
The Danish food industry consists of approx.
800
establishmentswith more than
6
employees. In1974
these establishments had atotal production value of
27,300
million Dkr. Of the totalproduc-tion value
70
was accounted for by consumption of materials and the remaining30
per cent by the value added of the800
establishments. Half of the value added was spent on remuneration of workers and staff of the industry.In
1974
the food industry employed72000
employees, representing a total of95
million working hours.The development during the period
1965
to1974
is characterisedby the facts that the production value has increased by
139
per cent, that the consumption of materials has risen by somewhat less,viz.
127
per cent, and the value added by164
per cent. Thus, the value added represents a growing share of the production value ofthe food industry. The fastest increasing part of the value added
has been the wage bill which has increased by
192
per cent. During the period investments in plants have grown pari passu with the value added. The remaining income, i.e. value added - wage bill- investments, has increased by
107
per cent during the period1965-73
and has thus been relatively falling.The employment in the food industry measured by number of employees
has been constant at about
70 - 72000
employees. In contrast, thetotal number of work~ hours has fallen by 15 per cent during the
period. This reduction in employment has not implied any
quantita-tive reduction in production, however. On the contrary, production
has increased quantitatively by
49
per cent.In short, the development may be characterised in the following way:
The production value has increased by
139
per cent, approx.50
per cent of this increase being a quantitative increase, and 60 percent resulting from price increases during the period.
Producti-vity per working hour has grown by
77
per cent, while the wagebill per working hour has increased by 243 per cent.
Table I,5 Main Data Concerning the Total Food Industry {Including the Beverages and Tobacco Industries).
!965 "972
(1973)
l
other wise1965 1966 1967 1968 1969 1970 19711) 1972 1973 1974 per cent cent o:f 1965 1974 in per I
Production value
I
11,4 12,3 12,7 12,9 14,0 15,9 17,7 19,5 23,92) 27 ,32
) 100 100 239 1000 million Dkr
Consumption o:f materials 16,72) 19,1 2 )
1000 million Dkr
I
8,4 8,9 9,1 9,0 9,7 11,2 12,4 13,6 73 70 227 Value added3,1 3,3 3,6 3,8 4,2 4,6 5,3 5,9 7,22 ) 8,22 ) 27 30 264 1000 million Dkr
Wage bill
1,4 1,6 1,7 1,8 2,0 2,3 2,7 3,0 3,62 ) 4,1 2 ) 12 15 292 1000 million Dkr
Value added - wage bill
1,7 1,7 1,9 2,0 2,2 2,3 2,5 2,9 3,6 2 ) 4,1 2 ) 15 15 241 1000 million Dkr
!
Investments in establish-ments with more than 20 employees (net invest-menta in plants)
280 374 459 366 452 514 643 736 731 2.5 3.8 (261)
million Dkr
Number o:f sta:f:f
14,5 14,8 14,4 14,5 14,6 14,9 15,7 16,1 15,8 15,9 110 1000 persons
Number o:f employees
55,8 56,1 5J,J 52,4 53,0 54,8 56,1 56,6 51,9 55,9 100 1000 persons
Number o:f working hours
performed 112 112 105 101 100 101 103 101 100 95 85 millions
Employment index
1968 = 100 110 110 104 100 98 99 100
1971 = 100 100 97 96 92 84
Number o:f establishments 87J 870 814 840 8J2 824 821 8JJ 798 (92)
Total turnover
11,8 12,6 lJ,O lJ.J 14,7 16,5 17,4 19,1 23,9 27,3 104 98 211 1000 million Dkr
r--I
Production index ~
1968 = 100 81 81 93 100 109 106 110 approx.
-100 109 122 110 149 i
1971 = 100 J
1) Chaqge o:f trade speci:f:l..cation :from 1971 2) estimated :figures
I,6 Distribution of the Food Indu~ On Trades
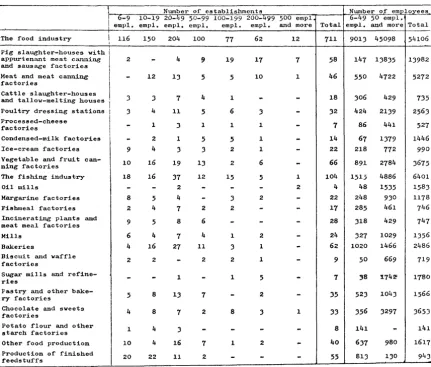
Table I,6,1 gives a survey of the distribution of the food industry on trades in 1973.
Employment within each trade is used as an approximate illustration of the relative importance of the individual trades. It appears
that pig slaughter-houses and meat and canning factories are the most important single group within the industry with a total of 25 per cent of total employment.
The fishing industry has 12 per cent of total employment and poultry dressing stations
5
per cent.The average size of establishments is largest within the following trades (in falling order): oil mills, sugar mills, and pig
slaugh-ter-houses.
A more detailed specification of the size of establishments within the individual trades is given in Table I,6,2. It appears that most major establishments are found among pig slaughter-houses.
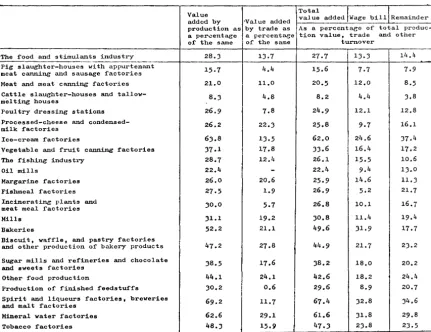
Table I,6,3 provides a specification of production, consumption, and value added in 1973 of the individual trades. Meat processing,
sugar production, and the beverages industry are the predominant trades as far as value added and remainder, i.e. value added - wage
bill, is concerned.
A further illustration of the processing level, estimated through
value added in per cent of total production value, is found in
Table I,6,4.
It appears that ice-cream factories, bakeris, pastry manufacturing, and the beverages trade are the trades with the highest processing
level.
Table I,6,5 provides a survey of turnover within the individual trades and the share of trade volume going directly abroad. The fishing industry, the milk and tinned-meat trades are the trades
with the largest foreign turnover.
It should be noticed that the table does not provide in£ormation
on the share o~ trade volume which is exported, £or instance through
independent sales companies.
Table I,6,1 Establishments And EmJ21~.!!:!·
The :food industry
Pig slaughter-houses with appur-tenant meat canning and sausage :factories
Meat and meat canning :factories Cattle slaughter-houses and tallow-melting houses
Poultry dressing stations Processed-cheese factories Condensed-milk :factories
Ice-cream :factories
Vegetable and :fruit canning :factories
The :fishing industry
Oil ~rills
Margarine :factories Fishmeal :factories
Incinerating plants and meat meal :factories
Mills Bakeries
Biscuit and wa:f:fle :factories Pastry and other bakery :factories Sugar mills and re:fineries
Chocolate and sweets :fac~ories Potato :flour and other
starch :factories
Other :food production
Production o:f :finished :feedstu:f:fs
30
per cent o:f number o:f establislunents
100 = 711
8
6
3
5
1 23
9
15 1 33
4
3
9 1 5 1 5 1 6 8average per cent of size employees
241 114 40
80
74
103 4555
61395
53
44
27
57
40 80 45 254 110 1844
7
100 = 54106
Table I,6,2 Number of Establishments and Total Number of' Employees In the Food Indust!J:...!!z_~ Of Employees 1n Industrial Establishments, 19lJ..
Number or establishments Number of' employees
'
! 6-9 10-19 20-119 50-99 100-199 200-499 500 empl 6-49 50 empl. \ empl. empl. empl, empl, empl. empl. and more Total empl. and more Total
The food industry I
I 116 150 204 100 77 62 12 711 9013 45098 sino6
Pig slaughter-houses with
appurtenant meat canning 2
-
4 9 19 17 7 58 147 13835 1.3982and sausage factories
Meat and meat canning
-
12 1.3 5 5 10 1 46 550 4722 5272i'actorles
Cattle slaughter-houses
J J 7 4 1
-
-
18 J06 429 7.35and tallow-melting houses
Poultry dressing stations 3 4 11 5 6 J
-
.32 424 21.39 256.3Processed-cheese
-
1J 1 1 1 7 86 441 527
factories
-Condensed-milk factories
-
2 1 5 5 1-
14 67 1379 1446Ice-cream factories 9 4 3 J 2 1
-
22 218 772 990Vegetable and i'ruit can- 10 16 19 13 2 6
-
66 891 2784 3675ning factories
The i'ishing industry 18 16 37 12 15 5 1 104 1513 4886 6401
Oil mills
-
-
2-
-
-
2 4 48 1535 158.3Margarine factories 8 5 4
-
J 2-
22 248 9.30 1178Fishmeal factories 2 4 7 2 2
-
-
17 285 461 746Incinerating plants and
9 5 8 6
-
-
-
28 Jl8 429 747meat meal factories
Mills 6 4 7 4 1 2
-
24 .327 1029 1.356Bakeries 4 16 27 11 J 1
-
62 1020 1466 2486Biscuit and wa:ffle
2 2
-
2 2 1-
9so
669 719i'actorics
Sugar mills and
refine--
-
1-
1 5-
7 )8 '1742' 1780ries
Pastry and other
bake-5 8 13 7
-
2-
.35 523 104.3 1566ry factories Chocolate and sweets
4 8 7 2 8 3 1 .33 J56 3297 3653
factories
Potato flour and other 1 4
3
-
-
-
-
8 141-
141starch :factories
Other food production 10 4 16 7 1 2
-
40 6J7 980 1617;
Production of finished
i'eedstuf:fs 20 22 11 2
-
-
-
55 813 1JO 943 t [image:33.528.40.471.97.463.2]Table I,6,3 Value o£ Industrial Production1 Consumption of Materials, and Value Added, 197}1 of
Establishments With At Least 20 E::1~lol:ees 1 Drokc-n Do"'ll D:r Kind of Act:l.v,i!i:. ( 1000 Dkr)
Number of
l
I·roduction 1
Con-!Remainder
mits by kind Value Wage
of' activity etc. i sumption Added Bill
The food industry 435 24461.907
I
17687798 6774109 3263557 3510552Pig slaughter-houses with appurtenant
29 8513524 7188273 1325251 658149 667102
meat canning and sausage factories
Meat and meat canning factories 28 2445408 1945265 500143 292478 207665
Cattle slaughter-houses and tallow- 11
732372 671975 60397 32300 28097
melting houses
Poultry dressing stations 19 703712 528274 175438 84858 90580
Processed-cheese and condensed- 16
978059 725272 252787 94660 158127 milk factories
Ice-cream factories 10 231253 87936 143317 56990~ 86327
Vegetable a:nd fruit canning factories 36 947373 629137 318236 1556661 162570
The fishing industry 64 1357699 1003240 354459 211119 143340
Oil mills 4 900314 698326 201988 84)88 117600
Margarine factories 12 401260 297233 104027 58722 45305
Fishmea1 factories 10 759292 554761 204531 39257 165274
:Incinerating plants and meat meal 10
factories 366724 268472 98252 37151 61101
Mills 15 519853 359749 160104 59228 100876
Bakeries 39 328159 165238 162921 104616 58305
Biscuit, waffle, and pastry factories
303453 167241 136212 65882 70330
and other production of bakery products 23
Sugar mills and refineries and choco- 22 1438822 888857 51•9965 259442 290523
late and sweets factories
Other food production 32 407570 233799 173771 74242 99529
Production of finished feedstuffs 15 269783 189830 79953 23960 55993
SFirit and liqueur• ~actories, 21 2018114 658309 1"9805 661912 697893
breweries and malt factories
Mineral water factories 9 112112 43098 69014 35619 33395
Tobacco factories 10 727051 383513 343538 172918 170620
Table I,6,4 Value Added, Wne;o Bill and Remainder As a Porccnta&e Of' 1273 In Establi,;;;l'unents With At Least 20 Employees, Droken Down By Kind of Activity.
Total Value
added by production as a per~entage of' the same
•Value added value added Wage bill Remainder by trade as As a percentage of total produc-a percent~e tion value, trade and other
of' the same turnover
14.4
The f'ood and stimulants industry 28.3 13.7 27.7 13,3
---·-··-:----+---+---+---+----+--~-1
Pig slaughter-houses with appurtenant 15•7 4 4 6
meat canning and sausage factories • l5. 7.7
Meat and meat canning f'actories 21.0 11,0 20,5
Cattle slaughter-houses and tallow- 4
melting houses 8.3 .8 8,2
Poultry dressing stations 26.9 7.8
=~~~e~:~~~~~::se and condensed- 26,2 22.3 Ice-cream factories
Vegetable and f'ruit canning factories The f'ishing industry
Oil mills
Margarine f'actories Fishmeal f'actories Incinerating plants and meat meal f'actories Mills
Bakeries
Biscuit, waffle, and pastry factories and other production of bakery products Sugar mills and ref'ineries and chocolate and sweets f'actories
Other food production
Production of' finished f'eedstuffs Spirit and liqueurs factories, breweries and malt f'actories
Mineral water factories Tobacco f'actories
6),8 1).5
J7.1 17.8
28.7 12,4
[image:35.532.39.471.102.434.2]Table I,6,5 Total Turno~~.2....!2.!£.~.£:t .. !'.2!'eign Sal~!2U·
The Food industry
Pig slaughter-houses with appurtenant meat canning and sausage factories
Meat and meat canning factories
Cattle slaughter-houses and tallow-melting houses
Poultry dressing stations
Processed-cheese and condensed-milk factories
Ice-cream factories
Vegetable and fruit canning factories The fishing industry
Oil mills
Margarine factories
Fishmeal factories
Incinerating plants and meat meal factories Mills
Bakeries
Biscuit, waffle, and pastry factories and other production of bakery products
Sugar mills and ref~eries and chocolate and sweets factories
Other food production
Production of finished feedstuffs
Spirit and liqueurs factories, breweries and malt factories
Mineral water factories
Tobacco factories
During the whole period 1964-74 Denmark has been an important net
exporter of food products. During the whole period imports of food
products have consituted a little less than 30 per cent of ex-ports.
In
1964 net exports amounted to 4,900 million Dkr and in 1972 to 7,100 million Dkr.The most important Danish food exports are agricultural animal
products, such as meat, meat products, and dairy products.
In
1964 these products accounted for 80 per cent of total exports
and in 1972 71 per cent. Fish and fishery products are also
im-portant export articles. During the period the relative
importan-ce of fishery pnoducts has increased from 9 to 14 per importan-cent.
The predominant imported food products are feedstuffs, grain,
fruit and vegetables, coffee and tea, etc. The importance of fruit
and vegetables has been relatively increasing during the period.
Imports of feedstuffs and grain are partly dependent on the size
of the Danish harvest of competing products.
A more detailed illustration of exports and imports in 1972 and
1964 is found in Tables I,7,1 and I,7,2.
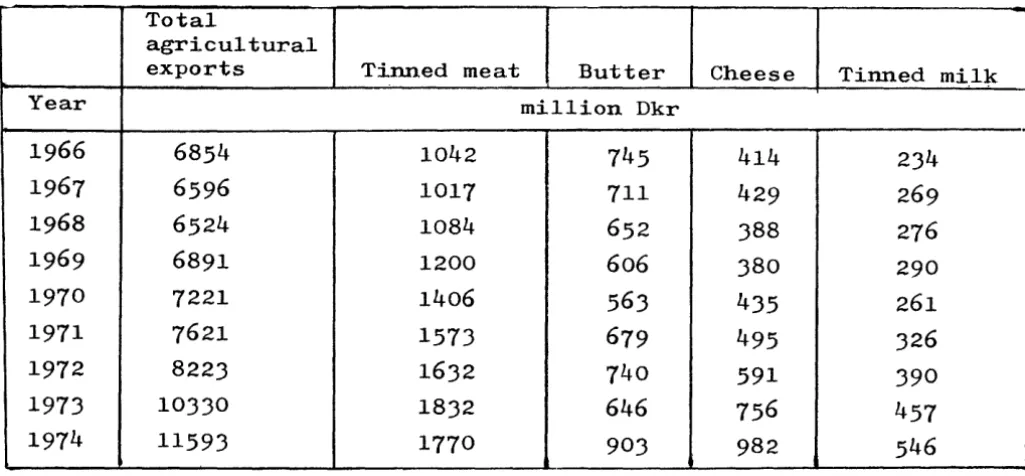
Table I,7,3 provides a survey of the composition of agricultural
exports, especially with a view to illustrating the importance
of the most processed products in relation to total agricultural
exports.
During the period, t~ed meat, butter, cheese, and tinned milk
have accounted for about 36 per cent of total agricultural exports.
If i t is safe to assume that these products represent the most
processed agricultural products, the processing level of Danish
agricultural exports have been fairly stable during the period.
The relative share of butter of processed agricultural goods has
been falling.
It appears from Table I,7,4 that the quantity of animal agricultural
products exported during the period has been stable or slightly falling. On the other hand, the prices of animal agricultural
ex-ports have increased by 66 per cent since 1965. The price increase has occurred especially in the 70's.
Exports of vegetable agricultural products have been relatively
vigorously increasing, especially since 1972. The prices of these products have also been rising during the same period.
Exports of meat and tinned milk have been steadily increasing
du-ring the period, both as to quantities as well as to prices.
Imports of food products have risen quantatively by 20 per cent
during the period, while prices have increased by 76 per cent
du-ring the same period. The price increases of imports have been
most vigorous in 1973 and 1974.
Table I, 7,1 Denmark's Exp.2I..i2~-l.!!!Eorts of Food l-roduct.2..a.~·
SITC- section
o.
Net exports
SITC 1964
Section Cha{-·ter Product group million Dkr
0 Food products, live animals
00 Live animals 544
01 Meat and meat products 3,504
02 Dairy products and eggs 1,470
Of' this: milk 244
butter 742
cheese 381
eggs 103
03 Fish and fishery products 426
04 Grain and grain products -267
05 Fruit and vegetables 179
06 Sugar, sugar products, honey 137
07 Cof'fee, tea, cocoa, chocolate, and
-367 spices
08 Feedstuf'f's, excluding unground grain -412
09 Miscellaneaous f'ood products 29
Section 0 - total 4,885
Imports as Percentage Percentage
a percentage distribution distribution
of exports of imports of exports
0 8
0 50
3 22
2 4
0 11
0 6
0 2
8 9
21 3
15 2
2 3
19 0
30 3
1 1
Table 1,7,2 Denmark'§ Ex~rts and I~rts of Food Products~~~
SITC - section 0.
Net Imports Exports exports
Chapter Product group million Dki
00 Live animals 10 223 213
01 Meat and meat products 35 5000 4965
02 Dairy products and eggs 101 1801 1700
Of this: milk 74 428 354
butter
-
740 740cheese 25 591 566
eggs 2 42 40
OJ Fish 302 1405 1103
04 Grain and grain products 367 359 -8
05 Fruit and vegetables 533 133 -400
o6 Sugar, sugar products, etc. 69 176 107
07 Coffee, tea, cocoa, spices 629 39 -590
08 Feedstuffs, excluding grain 693 628 -55
09 Miscellaneous 79 136 57
Food products - total 2819 9902 7083
Imports as Percentage Percentage
a percentage distribution distribution
of exports of imports of exports
0 2
1 51
4 18
3 4
-
81 6
0 0
11 14
13 4
19 1
2 2
22 0
25 6
3 1
Table I,7,3
~1 Agricu~~~2£tsand Exports of Some Product_Qroups.
Total
agricultural
exports
Tinned meat
Butter
Cheese
Tinned
mi.l~Year
million Dkr
1966
6854
1042
745
414
234
1967
6596
1017
711
429
269
1968
6524
1084
652
388
276
1969
6891
1200
606
380
290
1970
7221
1406
563
435
261
1971
7621
1573
679
495
326
1972
8223
1632
740
591
390
1973
10330
1832
646
756
457
1974
11593
1770
903
982
546
[image:41.774.131.644.99.337.2]Table I,7,4 The Development In Denmark's Exports and Imports of Food l'roducts, Illustrated By Quantity
and Value Index. 1~62
=
100.1964 65 66 67 68 69 70 71 72 73 74
Quantity index for imports of:
Food products 103 100 109 103 95 93 105 111 114 120 119
Beverages and tobacco 107 100 91 100 102 96 110 104 115 177 128
Unit value index for imvorts of:
Food products 97 100 101 98 102 107 119 120 120 157 176
Beverages and tobacco 80 100 96 92 103 110 111 116 123 112 113
Quantity index for exports of:
Animal agricultural products 96 100 95 94 95 89 84 88 85 90 94
Vegetable agricultural products 77 100 86 89 92 116 113 105 123 131 157
T:tnned meat and milk 90 100 112 110 116 123 129 146 150 147 139
Fish 95 100 95 101 112 105 104 114 135 130 124
Unit value index for exports of:
Animal agricultural products 103 100 109 104 100 109 118 117 130 157 166
Vegetable agricultural products 100 100 107 97 96 96 107 117 117 150 185
Tinned meat and milk 97 100 102 104 105 108 115 116 121 139 148
[image:42.769.70.721.89.385.2]In 1973 the total number of establishments within the food industry was 798, the number of firms was 617.
The average size of firms was 116 employees while the average
size of establishments was 90 employees. A total of 16
establish-ments and 28 firms had more than 500 employees. The typical
esta-blishment or firm had between 20 and 49 employees.
Firms with more than 500 employees had an average of 1244 employees, while establishments with more than Soo employees had an average
of 1220 employees.
In
short, the trade is characterized by havingmany small establishments and firms. According to international
standards, even the largest group of the establishments are small
establishments. The circumstances are further illustrated in Tables
I,8,1 and 3.
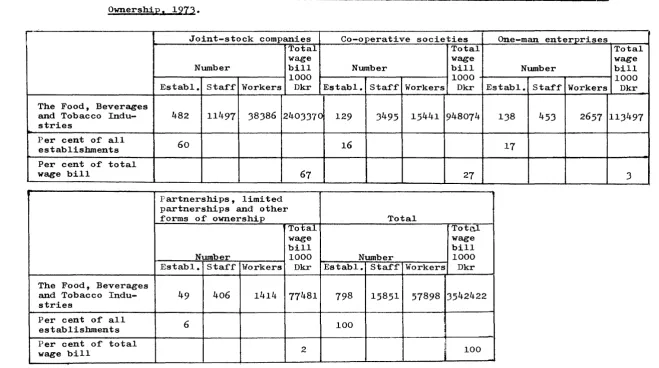
60 per cent of the establishments of the trade are joint-stock
companies. Measured by wage bill, these establishments are
some-what larger than the average. 16 per cent of the establishments
are co-operative societies which are considerably larger than the
average.
The remaining establishments are one-man enterprises or partnerships
and relatively small. These cirsumstances are further illustrated
in Table I,8,2.
The development in the size of establishments within the food
in-dustry alone, i.e. excluding the beverages and tobacco industries,
is illustrated in detail ~ Table I,8,3. It appears that the
num-ber of establishments has been slightly falling during the period
1965-73. The average size of establishments for all establishments
as well as establishments with more than 50 employees has been
in-creasing by 4 to 10 and 18 employees, respectively, during the
period.
Table L,8,1 Firms and Establishments Within the Food, Beverages, and Tobacco Industries,_l211,
6-9 10-19 20-49 50-99 100-199 200-499 500 empl.
empl, empl, empl, empl. empl. empl, and more Total
Number of' f'irms by number of
79 134 177 93 62 44 28 617
employees in industrial f'irms
Number of establishments by
number of' employees in indi- 129 159 219 113 88 74 16 798
Table
I,8,2
Ipdystrial EstablisQmgnts. Employees. and Wages and Salaries, Distribution By Forms of Ownership.191J..
Joint-stock companies Co-operative societies One-man enterprises
Total Total
wage wage
Number bill Number bill Number
1000
1000
Establ. Staff 1vorkers Dkr Establ. Staff Workers Dkr Establ. Staff Workers
The Food, Beverages
and Tobacco Indu-
482
11497 38386 2403370 129
3495 15441 948074
138
453
2657
stries
Per cent of all
60
16
17
establishments Per cent of total
wage bill
67
27
Partnerships, limited partnerships and other
forms of ownership Total
Total Totc.l
wage wage
bill bill
Number
1000
Number1000
Establ. Staff' 1forkers Dkr Establ. Staff Workers Dkr
The Food, Beverages
and Tobacco Indu-
49
406
1414 77481
798
15851 57898 3542422
stries
Per cent of all
6
100
establishments Per cent of' total
2
:I100
wage bill
i
Total wage bill
1000
Dkr
113497
[image:45.772.65.725.46.414.2]Table
I,8,3
Number of Est5Elishments Within the Food Industry1968-74
By Number of Employees In the Individual Establishments.Total
person-nel in Average size
Numb•~r of employees establ. Average of establ.
10- 20-
·so-
100- 200-
Total larger size larger thanYear
6-9 19 49
99
199 4'99
500-
Total personnel than50
of establ.50
empl.1965
90 162 166 103 80
57
6
664
47699
39726
72
161
1966
1967
1968
86 142 183 98 72
55
5
641
46241
37919
72
165
1969
98 132 179 97 80
47
7
640
46634
38382
73
162
19701 )
103 122 174 89 83
54
6
631
48595
77
171
128 155 196 94 85
54
6
718
50487
41121
70
1971
1972
130 149 198 112 75
57
11
734
53749
44637
73
175
1973
116 150 204 100 77
62
12
711
54106
45098
76
179
1974
[image:46.770.84.722.99.355.2]I,9 The Development In Domestic Consumption of Food ~_§timul~ts Products.
The period 1964 to 1974 has been characterised by a substantial in-crease in the Danish gross national product. Measured in current
prices, the increase has amounted to 201 per cent, and in real terms
to 47 per cent. An ever-increasing share of the GNP has been used
on collective consumption and as gross investments have remained
unchanged, a falling share of the GNP has been used on private
con-sumption.
Measured in current prices and real terms, private consumption has
risen by 163 and 36 per cent, respectively, during the period
196~--74.
The percentage distribution of private consumption on its fields of
application reveals that food vroducts have consitituted a stable
share of total consumption, viz. 21 to 22 per cent, and beverages
and tobacco a constant share of 10 to 11 per cent. Measured in real
terms, food consumption has grown relatively slowly, viz. by 22 per
cent, while consumption of beverages and tobacco has grown by 36
per cent. Table I,9,1 provides further details on the development.
Table 1,9,2 gives a survey of the relative share of expenditures
and savings of the households accounted for by food and beverages.
The relative share of food and beverages has fallen from 21.6 per
cent in 1964/65 to 15.7 per cent in 1971/72. It appears from the
product specification that shifts in the relative composition of
food consumption have not been very large during the period. The
increase in the relative share of the total food budget accounted
for by beverages seems to be most marked.
Table I,9,3 gives a survey of the Danish consumption of a number of
important food and stimulants products expressed in quantities.
Important trends include a decrease in the consumption of a large
number of dairy products. Cheese, junket, and yoghurt are
notice-able exceptions from this trend. Consumption of margarine, lard,
and eggs has not changed very much. Consumption of pork has been
steadily increasing, while consumption of beef has been fluctuating.
Consumption of fish has been increasing. Consumption of wheat flour
has been constant, while consumption of rye flour has fallen.
Con-sumption of sugar has grown. The feature of the trend, which is most
pronounced, is a substantial quantitative increase in all groups
of beverages. Consumption of vegetables, fruit, and berries has
grown, while consumption of potatoes has fallen.
Table I,9,1 Development In ~rivate Consumption, 1964, In Current Prices and Real Terms.
1964 1965 1966 1967 1968 1969 1970 1971 1972 1973 1974 million Dkr - current prices
Total private consumption 39870 43747 48609 53401 58209 66139 70756 75976 83085 94649 105035 Food products 8826 9370 10096 10654 11565 13092 14522 15905 17356 19895 23240 Beverages and tobacco 4059 4503 5188 5661 6264 6842 7128 7750 8498 9540 10334
percentage distribution
Total private consumption 100 100 100 100 100 100 100 100 100 100 100
Food products 22 22 21 20 20 20 21 21 21 21 22
Beverages and tobacco 10 10 11 11 11 10 10 10 10 10 10
million Dkr - 1955 prices
[image:49.771.60.715.59.278.2]Table
I,9,2
Expenditures On Food ~~~~~e-earni~ ~~holds.
1964-65 1967-68 1971-72
Total number o:f wage-earners
Number o:f households
962
1835
952
Number o:f persons per household
3.2
3.1
2.9
Average expenditure on :food and beverages, Dkr
5925
7376
10202
Share o:f expenditure (percentage distribution)
Bread
6.0
s.8
5.7
Pastry
4.3
3.9
3.s
Flour, meal, and groats
1.8
1.6
1.5
Fresh bacon and pork
8.9
8.4
6.4
Fresh beef', veal, etc.
s.J
6.0
5.2
Poultry and game
1.7
1.7
1.8
Cooked beef' and pork products
} 11.9
11.4
12.8
Tinned meat
o.s
o.6
Fish
3·5
).5
).4
Butter
4.8
4.1
2.8
Margarine, etc.
2.9
2.6
2.5
Milk
5.5
5.8
5.7
Cream, ice-cream, etc.
2.1
1.9
2.1
Cheese
2.8
2.8
3.8
Eggs
2.9
J.O
2.1
Potatoes
1.7
2.1
2.0
Vegetables
4.0
5-3
s.8
Fruit
7.0
6.2
5.9
Sugar
1.7
2.0
1.5
Co:ffee
7.9
7.0
6.s
Tea and cocoa
0.6
o.s
o.s
Spices
1.2
1.1
1.1
Chocolate
1.7
1.9
2.5
Spirits
1.7
1.9
2.8
Wine
1.5
1.7
2.7
Strong beer
4.1
4.6
5.7
Light beer, mineral water
2.5
2.9
2.9
Miscellaneous
-
0.1
-Total
100.0
100.0
100.0
Food and beverages as a percentage of' total