EVALUATION OF DYNAMIC CHARACTERISTICS ON PRT AND THERMOCOUPLE SENSORS IN AN AUTOMATED TEMPERATURE
CALIBRATION SYSTEM
ILHAM HADI BIN SYAHRIL
EVALUATION OF DYNAMIC CHARACTERISTICS ON PRT AND THERMOCOUPLE SENSORS IN AN AUTOMATED TEMPERATURE
CALIBRATION SYSTEM
ILHAM HADI BIN SYAHRIL
Laporan ini dikemukakan sebagai
memenuhi sebahagian daripada syarat penganugerahan
Ijazah Sarjana Muda Kejuruteraan Mekanikal (Rekabentuk & Inovasi)
Fakulti Kejuruteraan Mekanikal Universiti Teknikal Malaysia Melaka
i
SUPERVISOR DECLARATION
“I hereby declare that I have read this thesis and in my opinion this report is sufficient in term of scope and quality for the award of degree of Bachelor of
Mechanical Engineering (Design & Innovation)”.
DECLARATION
“I hereby declare that the work in this report is my own except for summaries and quotations which have been duly acknowledged.”
Signature: ……….. Author: Ilham Hadi bin Syahril
iii
ACKNOWLEDGEMENT
v
ABSTRACT
ABTRAK
vii
TABLE OF CONTENT
CHAPTER CONTENT PAGE
SUPERVISOR DECLARATION i
DECLARATION ii
DEDICATION iii
ACKNOWLEDGEMENT iv
ABSTRACT v
ABTRAK vi
TABLE OF CONTENT vii
LIST OF FIGURE ix
LIST OF TABLE xii
LIST OF ABBREVIATIONS xiv
LIST OF SYMBOLS xv
LIST OF APPENDIX xvi
CHAPTER 1 INTRODUCTION
1.1 Objective 1
1.2 Problem statement 1
1.3 Scope of study 2
CHAPTER 2 LITERATURE REVIEW 3
2.1 Previous studies on temperature calibration
3
2.2 Static and dynamic characteristic of temperature transducer
4
2.2.1 Static characteristic of temperature transducer
2.2.1.1 Accuracy 4
2.2.1.2 Resolution 5
2.2.1.3 Sensitivity 6
2.2.2 Dynamic characteristic of temperature transducer
8
2.2.2.1 Time constant 8
2.3 Platinum resistive thermometer (PRT) 9 2.3.1 PRT construction 9
2.4 Thermocouple 12
2.4.1 Choice of thermocouple materials 12 2.4.2 Summary of the law of thermoelectric
circuits
14
2.4.2.1 Law of homogenous materials 14 2.4.2.2 Law of intermediate materials 15 2.4.2.3 Law of successive of
intermediate temperature
16
2.5 Automated temperature calibration system 17 2.6 Development of computer interface 18
CHAPTER 3 METHODOLOGY 20
3.1 Introduction 20
3.2 Experiment preparation 20 3.1.2 Fabrication of insert 20 3.2.2 Fabrication of temperature probe 21 3.3 Experiment apparatus 22
3.3.1 Heat source 23
3.3.2 Thermometer readout and data logger 23 3.3.2.1 2562 PRT Scanner Module 24 3.3.2.2 2566 Thermocouple Scanner
Module
26
3.3.3 PC interface 27
ix
3.4.2 Soaking time 29
3.4.3 Time constant 33
CHAPTER 4 RESULT AND DISCUSSION 35
4.1 Soaking time 35
4.1.1 Aluminium insert 36
4.1.2 Brass insert 41
4.2 Time constant 46
4.2.1 Effect of probe diameter 46
CHAPTER 5 ANALYSIS OF CALIBRATION DATA 50
5.1 Thermocouple 50
5.2 Estimation of population mean 53 5.3 Estimation of population variance 60
CHAPTER 6 CONCLUSION 63
REFERENCES 64
LIST OF FIGURE
FIGURE TITLE PAGES
Figure 2.1 Accuracy as a percentage of full scale 5 Figure 2.2 Resolution of a measuring system 6 Figure 2.3 Thermocouple sensitivity 7 Figure 2.4 Zero drift and sensitivity drift 7 Figure 2.5 Response of a measurement system to a step change in input 8 Figure 2.6 (a) platinum wire; (b) thin film 10 Figure 2.7 Connections configuration and termination colour codes
according to British Standard 11 Figure 2.8 Resistance vs. temperature for common type of RTD 11 Figure 2.9 Output for some common thermocouples 12 Figure 2.10 E.m.f, E is not affected by T3 and T4 14 Figure 2.11 E.m.f (E) unaffected by third material, C 15 Figure 2.12 E.m.fs are additive for materials. 16 Figure 2.13 E.m.fs are addictive for temperature intervals 16 Figure 3.1 Insert dimension and holes configuration 21
Figure 3.2 Temperature probe 21
xi
Figure 3.5 Fluke 1560 Black Stack Thermometer Readout 24 Figure 3.6 PRT Scanner Module Sensor Wiring Detail 25 Figure 3.7 Thermocouple Scanner Module Sensor Connection Detail 27 Figure 3.8 Diagram for automated temperature calibration system 28 Figure 3.9 LabVIEW user interface for heat source setup 30 Figure 3.10 LabVIEW user interface for temperature probe configuration 31 Figure 3.11 LabVIEW user interface for set point configuration 32 Figure 3.12 LabVIEW program front panel for time constant
measurement 33
Figure 4.1 Graph of set point vs. error for PRT (1st reading) 36 Figure 4.2 Graph of set point vs. error for PRT (average reading) 36 Figure 4.3 Graph of set point vs. error for thermocouple 3.2 mm (1st
reading) 37
Figure 4.4 Graph of set point vs. error for thermocouple 3.2 mm
(average reading) 37
Figure 4.5 Graph of set point vs. error for thermocouple 6.0 mm (1st
reading) 38
Figure 4.6 Graph of set point vs. error for thermocouple 6.0 mm
(average reading) 38
Figure 4.7 Graph of Set Point vs. Error for Thermocouple 8.0 mm (1st
Reading) 39
Figure 4.8 Graph of Set Point vs. Error for Thermocouple 8.0 mm
[image:13.595.110.523.51.760.2](Average Reading) 39
Figure 4.9 Graph of set point vs. error for PRT (1st reading) 41 Figure 4.10 Graph of set point vs. error for PRT (average reading) 41 Figure 4.11 Graph of set point vs. error for thermocouple 3.2 mm (1st
reading) 42
Figure 4.12 Graph of set point vs. error for thermocouple 3.2 mm
Figure 4.13 Graph of set point vs. error for thermocouple 6.0 mm (1st
reading) 43
Figure 4.14 Graph of set point vs. error for thermocouple 6.0 mm
(average reading) 43
Figure 4.15 Graph of Set Point vs. Error for Thermocouple 8.0 mm (1st
Reading) 44
Figure 4.16 Graph of Set Point vs. Error for Thermocouple 8.0 mm
(Average Reading) 44
[image:14.595.120.521.73.485.2]xiii
LIST OF TABLE
TABLE TITLE PAGES
Table 1.1 Composition of thermocouple, trade names and letter designations for standardized thermocouples
13
Table 3.1 PRT Scanner Commands 26 Table 4.1 Time constant, 𝜏 (min) for PRT and thermocouple 49 Table 5.1 Measured temperature by thermocouple probe (3.2 mm
diameter) n aluminium insert
53
Table 5.2 Measured temperature by thermocouple probe (3.2 mm diameter) in brass insert
54
Table 5.3 Measured temperature by thermocouple probe (6.0 mm diameter) in aluminium insert
54
Table 5.4 Measured temperature by thermocouple probe (6.0 mm diameter) in brass insert
55
Table 5.5 Measured temperature by thermocouple probe (8.0 mm diameter) in aluminium insert
55
Table 5.6 Measured temperature by thermocouple probe (8.0 mm diameter) in brass insert
56
Table 5.7 Measured temperature by PRT probe (6.0 mm diameter) in aluminium insert
56
Table 5.8 Measured temperature by PRT probe (6.0 mm diameter) in brass insert
57
Table 5.9 Confidence interval of mean for thermocouple probe (3.2mm diameter) in aluminium and brass inserts
59
Table 5.10 Confidence interval of mean for thermocouple probe (6.0 mm diameter) in aluminium and brass inserts
Table 5.11 Confidence interval of mean for thermocouple probe (8.0 mm diameter) in aluminium and brass inserts
59
Table 5.12 Confidence interval of mean for PRT probe (6.0 mm diameter) in aluminium and brass inserts
59
Table 5.13 Confidence interval of standard deviation for
thermocouple probe (3.2 mm diameter) in aluminium and brass inserts
61
Table 5.14 Confidence interval of standard deviation for
thermocouple probe (6.0 mm diameter) in aluminium and brass inserts
62
Table 5.15 Confidence interval of standard deviation for
thermocouple probe (8.0 mm diameter) in aluminium and brass inserts
62
Table 5.16 Confidence interval of standard deviation for PRT probe (6.0 mm diameter) in aluminium and brass inserts
xv
LIST OF ABBREVIATIONS
PRT = Platinum resistive thermometer TC = Thermocouple
MMSL = Microgravity Materials Science Laboratory NASA = National Aeronautics and Space Administration
PID = Proportional integral derivative ITS = International temperature scale RTD = Resistance temperature detectors
LIST OF SYMBOLS
𝜏@𝑑𝑇𝑡
𝑑𝑡 = Time constant I = Current (A)
[email protected] = Electromotive force (V)
T = Temperature(°C)
m = Bulb mass
c = Bulb specific heat
y/ye = Step input
R = Resistance (Ω)
𝛼 = Dominant constant (/0𝐶)
𝛿 = Constant
𝛽 = Constant
𝑈 = Thermoelectric voltage (V)
∆𝑇 = Temperature different (°C)
xvii
LIST OF APPENDIX
APPENDIX TITLE PAGES
APPENDIX 1 Technical specification for Fluke 9170 Series Metrology Well Calibrator
66
APPENDIX 2 Table of detail specification of 2562/2568 PRT Scanner Module
67
APPENDIX 3 Table of detail specification of 2566 Thermocouple Scanner Module
68
APPENDIX 4 Gantt chart for FYP 1 70
CHAPTER 1
INTRODUCTION
1.1 OBJECTIVE
Those objectives evaluated are to assist and complete this study:
To measure and analyze the transient response of temperature probe characteristic.
To study the effect of loading error due to the change of probe diameter for PRT and Thermocouple probes.
1.2 PROBLEM STATEMENT
2
1.3 SCOPE OF STUDY
CHAPTER 2
LITERATURE REVIEW
2.1 PREVIOUS STUDIES ON TEMPERATURE CALIBRATION
.
Temperature calibration has been focused in industries as an indicator to maintain
the quality of products especially in steel and food processing industries. Therefore, many
studies on temperature calibration were conducted by previous researchers such as Mark D. Bethea, Bruce N. Rosenthal, Janko Drnovisek, Jovan B Djkovski, Igor Pusnik, Tanasko Tasic, Jie Chen, Xuejun Hu, Lixin Xu for thermocouples (TC), Platinum
Resistive Thermometers (PRT) and thermistors.
An automated calibration system has been started by Bethea and Rosenthal (1992) which developed an automated thermocouple calibration system for use in the Microgravity Materials Science Laboratory (MMSL) at the NASA LeRC. There is capable of calibrating a large number of thermocouples simultaneously up to 60 thermocouples. On the other hand it also reduce the calibration time significantly while maintaining accuracy of ±0.7 ℃.
4
Recently, a new thermocouple auto-calibration system then have been develop by Chen et al. (2008) by applying fuzzy-PID controller based system. It can improve the accuracy and eliminate the self-oscillation of the system. This control module is developed using LabVIEW that capable to control the calibration temperatures precisely and also to manage data and display the result.
2.2 STATIC AND DYNAMIC CHARACTERISTIC OF TEMPERATURE TRANSDUCER
2.2.1 Static Characteristic of Temperature transducer
Every equipment and transducer has their own static characteristics consist of accuracy, resolution, and sensitivity. The characteristics probably change due to the aging or thermal stress in applications.
2.2.1.1 Accuracy
Accuracy is defined as the closeness of agreement between a measured value and the true value. It is a quantified in terms of measurement error, i.e. the difference between the measured value and the true value. Thus the accuracy of a laboratory standard PRT is the closeness of the reading to the true value of temperature. This brings us back to the problem, of how to establish the true value of a variable. The true value of temperature often referred to primary standard which is International Temperature Scale of 1990 (ITS-90). (Bentley, 2005)
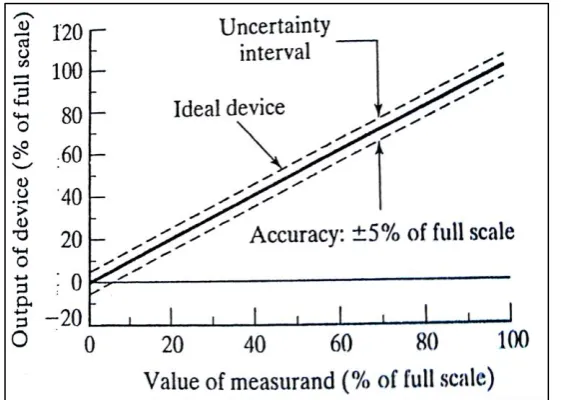
Figure 2.1: Accuracy as a percentage of full scale (Source: Wheeler, Ganji, 2010)
As shown in Figure 2.1, a typical measuring device with an accuracy of ±5% of full scale, at reading below full scale, the percent of uncertainty in the reading will be greater than 5%. At reading towards the lower end of the range, the percent uncertainty might be completely unsatisfactory. This problem with high uncertainty at the low end of the range is a major concern in selecting a measuring system. To minimize uncertainty, the experimenter should select measuring systems so that important readings will fall in the middle to upper portions of the range.
2.2.1.2 Resolution