Mesoscale modeling and simulation of microstructure evolution
during dynamic recrystallization of a Ni-based superalloy
Fei Chen1,2•Zhenshan Cui2•Hengan Ou1• Hui Long3
Received: 3 June 2016 / Accepted: 28 August 2016
The Author(s) 2016. This article is published with open access at Springerlink.com
Abstract Microstructural evolution and plastic flow char-acteristics of a Ni-based superalloy were investigated using a simulative model that couples the basic metallurgical principle of dynamic recrystallization (DRX) with the two-dimensional (2D) cellular automaton (CA). Variation of dislocation density with local strain of deformation is considered for accurate determination of the microstruc-tural evolution during DRX. The grain topography, the grain size and the recrystallized fraction can be well pre-dicted by using the developed CA model, which enables to the establishment of the relationship between the flow stress, dislocation density, recrystallized fraction volume, recrystallized grain size and the thermomechanical parameters.
1 Introduction
The mechanical properties of a metallic component such as high-temperature alloy are largely depended on their chemical composition and microstructures, resulting from processing and heat treatment history in industrial pro-duction. Accurate prediction and precise control of the
microstructural evolution are of great importance for designers to achieve excellent mechanical properties for metals and alloys through hot working. Up to date, DRX has been recognized as a powerful mechanism for grain refinement under hot plastic deformation. In this context, in-depth understanding of microstructural evolution during DRX can help develop more accurate prediction methods to simulate microstructural characterization and mechani-cal properties in the hot deformation of metals and alloys [1–3].
With the rapid development of computer technology and a thorough understanding of microstructural evolution thermodynamics and kinetics, mesoscale methods, i.e., the CA method, Monte Carlo (MC) method, vertex models, phase-field approach and level-set modeling, have been successfully used to simulate microstructural evolution in hot working. Mesoscale models can not only predict the general average microstructure properties (the kinetics of recrystallization and grain size), but also able to visually provide the virtual microstructural evolution during hot deformation. Compared with the other methods, CA method can be used as an alternative approach to describe the spatial and temporal microstructure evolution on a mesoscale. There are some shortcomings of CA method. For example, CA has poor representation of grain boundary curvature as compared to the phase-field model and level-set model. The first attempt to model of microstructural evolution during DRX by CA method was made by Goetz and Seetharaman [4]. Up to now, there are many cases of successful application of CA in modeling microstructural evolution. In these studies, Ding et al. [5], Raabe [6], Kugler and Turk [7], Xiao and Zheng [8] and Jin and Cui [9] contributed greatly to the development of the CA method for the simulation of DRX from the aspects of optimization algorithm, grain morphology change and
& Hengan Ou
1 Department of Mechanical, Materials and Manufacturing
Engineering, University of Nottingham, Nottingham NG7 2RD, UK
2 Institute of Forming Technology and Equipment, Shanghai
Jiao Tong University, 1954 Huashan Road, Shanghai 200030, People’s Republic of China
3 Department of Mechanical Engineering, University of
parameter identification. Recently, based on the work of Ding et al. [5] and Kugler and Turk [7], Yazdipour et al. [10] simulated DRX during thermomechanical deformation of 304 austenitic stainless steel by the CA method. In this case, initial grain size, initial grain orientation and dislo-cation density are used as input data to the CA model; the flow curve, dislocation density, finial grain size and ori-entation and recrystallized fraction are the output data. Hallberg et al. [11] employed the CA model with proba-bilistic cell switches in simulating DRX of pure Cu. Ding et al. [12] investigated the hot compression behavior of the Mg–9Al–1Zn alloy using EBSP analysis and the CA method. Chen et al. [13, 14] predicted microstructural evolution during DRX of an ultra-super-critical rotor steel. In addition, the DRX behavior of TRIP steel [15], C-Mn micro-alloy steel [16], Ti-alloy [17] and Ni-based alloy [18] was studied by using improved CA models. However, in order to perfect the classical CA model for DRX, the following two aspects still need further investigation. Firstly, it is highly necessary to develop reasonable and practicable method to calculate CA simulation constants such as nucleation parameter. Secondly, it is desirable to introduce the mechanisms of grain morphology change on the nucleation and grain growth during DRX in either two-dimensional or three-two-dimensional cases.
Due to its excellent mechanical characteristics at ele-vated temperatures up to 650C, good fatigue and corro-sion resistance, Ni-based superalloy named IN 718 has been widely used in aerospace industry [19]. Usually, IN718 superalloy components are processed by hot forg-ing. The mechanical properties of forgings are extremely sensitive to the dynamic and interconnected variables, such as strain, strain rate and temperature [20]. Therefore, in recent years, the flow behaviors and microstructural evo-lution of IN718 have been studied experimentally by many researchers [21–26]. However, there have been few investigations on modeling and simulation of microstruc-ture evolution for IN718 superalloy during hot working. In order to deeply understand DRX mechanism and to predict and control the microstructure evolution during DRX for IN718, there is a need to develop new model to simulate the grain refinement during hot working from mesoscale aspect.
The main purpose of this article is to develop a 2D CA model to predict the microstructure evolution for IN718 superalloy during hot working. The CA model has the following advantages. Firstly, reverse algorithm was adopted for parameter identification. Secondly, grain morphology deformation technique was used in the CA model, in which a cellular coordinate system (CCS) and a material coordinate system (MCS) were established sepa-rately. The CCS remains unchangeable in the whole sim-ulation. The MCS and the corresponding grain boundary
shape change with deformation in the developed DRX module. By using the developed model, a wide range of deformation temperature and strain rate over DRX were examined to investigate the quantitative and topographic prediction of the microstructural evolution during hot working for IN718 superalloy. As a result, the appropriate hot working parameters for IN718 were recommended based on the CA simulations.
2 Experiment
2.1 Experiment materials and procedures
The chemical composition (wt%) of IN718 superalloy used in this study is as follows: 18.07Cr–17.74Fe–5.41Nb– 2.86Mo–1.02Ti–0.9Si–0.5Al–0.025C–(bal.)Ni. The diam-eter and length of the specimens are 8 mm and 12 mm, respectively. According to ISO 6892-2, suitable test pro-cedures were designed. All the specimens were solution treated at 1100C for 0.75 h and then cooled to room temperature in the air. The isothermal compression tests were carried out at the temperatures of 940, 980, 1020 and 1060C and at the strain rates of 0.001, 0.01, 0.1 and 1 s-1. The tests were performed on a Gleeble-1500 ther-momechanical simulator. Before loading, the specimens were heated to the test temperature with the heating rate of 10C/min. The maximum true strain is 1.0. In order to study the effects of forming process on the microstructure, the specimens were immediately quenched by water after hot compression. The deformed specimens were sliced along the compression axis section for microstructural analysis. The tested specimens were prepared for optical microscopy (OM) using standard metallographic tech-niques of mounting, coarse and fine grinding, final pol-ishing and etching. The specimens were immersion etched with HCL (20 ml)?40 % HF (50 ml)?H2O2(2 ml) to
reveal the microstructures. Etching times varied with test conditions from 2 to 3 min at room temperature. As shown in Fig.1, the optical microstructures in the section plane are examined. The average grain sizes for the nine posi-tions at axial section are measured using the method described in ASTM standards.
2.2 Flow characteristics
the dynamic recovery resulted from the dislocation climbing, and sliding is too weak to overcome the work hardening effect. With the increase in strain, the flow stress curves exhibit similar trends, i.e., a single peak at a critical strain followed by a strain softening stage and then sometimes a steady stage at high strain zone. The charac-teristics of the flow stress curves are typical that can be observed in many metals and alloys. This implies the occurrence of DRX phenomenon during hot deformation.
However, at temperatures from 940 to 1060C and strain rate of 1 s-1, there is no obvious steady stage in the test strain range.
3 Modeling and simulation on DRX by CA method
3.1 Mechanism of CA simulation of DRX
When CA method is adopted, the evolution of the microstructure can be represented by some basic microstructural constituents such as the grain orientation. This means that the actual microstructures can be predicted at mesoscale and the statistical information of internal variables used in the macroscale models are just the inevitable results. The interaction mechanism between mesoscopic and macroscopic evolution for CA simulation is illustrated in Fig.3. Actually, the dislocation density provides a link of multi-scale modeling to bridge the macroscopic thermomechanical parameters and the meso-scopic microstructures. Figure3 also schematically shows the variation of flow stress as well as the mean dislocation density of the material and instantaneous dislocation den-sity at a single cell of CA. In the case of none recrystal-lization, the flow stress depends on the combined effects of work hardening and dynamic recovery, showing a mono-tone increase toward a saturated stress. But in fact, DRX takes place once the dislocation density reaches a critical value, resulting in a significant decrease in the dislocation
Fig. 1 Nine positions at axial section for optical microstructure analysis
a b
c d
Fig. 2 True stress–strain curves of IN718 superalloy deformed at different deformation conditions:ae_ ¼ 0:001 s1,b
_
e ¼ 0:01 s1,ce_ ¼ 0:1 s1
[image:3.595.55.287.58.257.2] [image:3.595.203.545.437.713.2]density in the recrystallized zone. The difference between the dislocation density of recrystallized grain and the matrix supplies the thermodynamic driving force for the growth of recrystallized grain. In continuous deformation, the dislocation density of a particle changes as the strain increases and the recrystallization happens, which shows a decreased mean dislocation density and a decreased flow stress. Therefore, when the CA method is adopted, one of the most important issues is to track the changes in dislo-cation density.
3.2 Modeling of dislocation evolution
During plastic deformation, dislocations are created by work hardening (WH) and annihilated by dynamic recov-ery (DRV). To describe the deformation behavior of austenite, the Kocks–Mecking model [27] is employed, in which the flow stress is proportional to the square root of dislocation density as given in:
r¼alb ffiffiffiffiffiffiffiffiffiffiffiqmean p
ð1Þ
wherea is a dislocation interaction term, which is around 0.5 for most metals, b is Burger’s vector, l is the shear modulus, qmean is the mean dislocation density. In CA simulation,qmeancan be expressed as:
qmean¼
1 Ntotal
X
i;j
qi:j ð2Þ
whereNtotalis the total number of cells in a CA model and qi,j is the dislocation density of site (i,j). The dislocation
hardening and recovery are modeled by the change in the dislocation density exactly as proposed by Estrin [28]. The variation of the dislocation density of site (i,j) with respect to strain can be expressed as:
dqi;j
de ¼k1
ffiffiffiffiffiffi
qi;j
p k2q
i;j ð3Þ
where the two terms represent a competition between storage of mobile dislocations and dynamic annihilation of dislocations, k1represents work hardening, k2is the
soft-ening parameter that represents the recovery of dislocation. k1and k2in Eq. (3) can be evaluated from the measured
flow stress and can be expressed as functions of tempera-ture and strain rate.
3.3 Modeling of nucleation and grain growth
The onset of nucleation of DRX is usually associated with the accumulation of dislocations. When the dislocation density of a deforming matrix reaches a critical value
[image:4.595.205.544.60.380.2](qcritical) during thermomechanical processing, nucleation of DRX is initiated.qcriticalis calculated by using Eq. (1).
Nucleation of DRX is handled by randomly choosing a certain fraction of the total cells located on grain bound-aries (including primary grain boundbound-aries and recrystal-lized grain boundaries) as the new nucleus at each CA simulation step. Each nucleus consists of one cell. The orientations of the nucleus are randomly set in the program and are represented by random integer in the range of 1– 180. When such a nucleus is placed in the system, it is initially assigned a stored energy of zero and increases with increasing strain based on Eq. (3). The nucleation rate per unit grain boundary area for DRX can be expressed as [5]:
Ndynamic ¼Cdynamice_mexp Qact
RT
ð4Þ
whereCdynamicis a constant,mis set to 1.0 in the present
simulation,Qactis the activation energy,e_is the strain rate, Ris the universal gas constant (8.31 J mol-1K-1) andTis the absolute temperature. There are two basic methods to calculate the constant (Cdynamic). First, the percentage of
DRX (g) can be experimentally measured for a specific deformation condition [8]; then, the constant Cdynamic in
Eq. (4) can be determined for a deforming material. Sec-ond, the constant Cdynamic can be determined using an
inverse analysis method [9,14]. The dislocation density of recrystallized grain evolves from zero to a saturated value. The difference between the dislocation densities of recrystallized grain and the matrix supplies the thermody-namic driving force for the growth of recrystallized grain. It is generally assumed that the velocity of grain boundary movement (v) fulfills the following equation [29]:
v¼MDf ð5Þ
whereDfis the driving force andMis the grain boundary mobility, which can be calculated by the following equation:
M¼dDobb KT exp
Qb RT
ð6Þ
wheredis the characteristic grain boundary thickness,Dob
is the boundary self-diffusion coefficient, Qbis the grain
boundary diffusion activation energy, andK is the Boltz-mann’s constant.
It is assumed that the recrystallized grain is spherical. The driving forceDfcan be expressed as:
Df ¼s qmatrixqRgrain
2cir
i recrystallized ð7Þ
whereqmatrixis the dislocation density of the matrix,qR-grain
is the dislocation density of theith recrystallized grain,sis the dislocation line energy (s=clb2) (cis a constant equal to 0.5). The 2D simulation metallography is viewed as a cross
section of the corresponding 3D microstructure. An equiv-alent average radius of a grain (ri_recrystallized) is used to define
the recrystallized grain size and is calculated by using the following equation:
ri recrystallized¼
ffiffiffiffiffiffiffiffiffiffiffiffiffi
NiAcell p
r
ð8Þ
where Ni is the total number of cells belonging to the
recrystallized grain and whereAcellis the area of one cell.
Besides, the grain boundary energy (ci) can be calculated
by the Read–Shockley equation. The time step (Dt) is defined as the ratio of the cell diameter (d0) to maximum
grain boundary velocity (vmax).
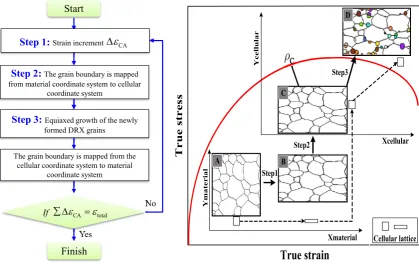
3.4 Consideration of grain geometry of real deformation
The deformation of grain geometry makes change of grain boundary and consequently affects nucleation and growth of nuclei during DRX. To describe the effect of compres-sion on the grain shape more accurately, a 2D CA model with the incorporation of a grain morphology deformation technique was adopted in this study. In the modified CA model, a cellular coordinate system and a material coor-dinate system were established separately. The cellular coordinate system was used to describe the nucleation of DRX and the growth of new recrystallized grains; the size of the cell remains unchangeable. The material coordinate system and the corresponding grain boundary shape change with deformation during a CA simulation. A detail description of grain morphology mechanism in CA simu-lation is shown in Fig.4. As shown in this figure (step 1), the original matrix was compressed in the compression direction and elongated in the perpendicular direction during DRX. Then, the grain boundary will be mapped from the material coordinate system to the cellular coor-dinate system before the appearance of DRX (step 2). The dislocation density increases gradually, and when the value reaches a critical density (qcritical), new nucleus appears on
the grain boundaries and continues to grow with the model of equiaxed growth in the cellular coordinate system (step 3). Finally, the grain boundary will be mapped back to the material coordinate system for the next round of the simulation.
3.5 Implementation of recrystallization in CA model
In this study, the CA framework for recrystallization is composed of the following parts:
(3) Assignment of state variables to each cell; (4) Definition of transition rules for CA models.
Every cell has four state variables:
(1) The dislocation density variable represents the stored energy. The initial dislocation density of all primary grains is uniform and identical. During the progress of DRX, the dislocation density increment (Dq) is calculated based on Eq. (3). When a cell recrystal-lized, the dislocation density of the cell is equal to
qinitial and increases with increasing strain.
(2) The grain orientation variable represents different grains.
(3) The grain boundary variable indicates whether the cell locates on the grain boundary.
(4) The fraction variable (ft
i;j) represents the
recrystal-lized fraction, which can be calculated as
ft i;j¼lti;j
.
l0. The increase in the distance of grain
boundary (lti;j) at time t can be calculated as
lti;j¼lti;jDtþvDt, wherelti;jDtindicates the increment of the distance attDt When a cell recrystallized, the recrystallized fraction of the cell equals to 1.
In the CA model for recrystallization, the transformation of a cell from the unrecrystallized state to the recrystallized state can be initiated when the following conditions are fulfilled simultaneously:
(1) The driving force is positive;
(2) The cell is at the grain boundary; meanwhile, at least one cell in the von Neumann neighborhood is already in the recrystallized state;
(3) The recrystallized fraction variable is equal to 1; (4) The computer-generated random number is less than
the transformation probabilityP, which is defined as P=i/4, whereiis the number of neighboring cells, which have the same orientation in the von Neumann neighborhood.
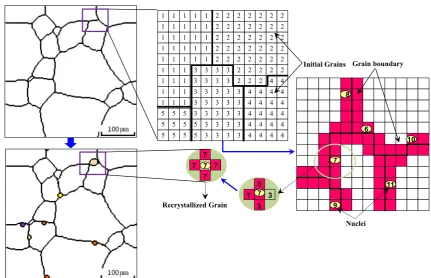
Figure5 gives the operation of the CA model. Gener-ally, it includes the following steps:
(1) The initial grain is generated by running the initial microstructure generation CA module based on the state transition rules. In this module, two of four state variables are used: the orientation variable and grain boundary variable. As shown in Fig.5, the initial orientation of the matrix is randomly set as Q (1 ^Q^180). In each cellular automaton steps (CASs), the entire cells are investigated in accordance with the transition rules. More details on the transition rules can be found in previous work [30].
(2) Calculation of the time step by the following Eq. (9). The time step is defined as the ratio of the cell diameter (d0) to maximum grain boundary velocity
(vmax).
[image:6.595.87.507.61.325.2]Dt¼ d0 vmax
¼ k 2 2d0 Msk2
1
ð9Þ
The total number of cycles can be determined bye=eD_ t in the whole deformation.
(3) Calculation of dislocation density increment with the deformation by Eq. (3). When the dislocation den-sity of the matrix reaches a critical value (qcritical) for
DRX, the recrystallized nuclei form on the grain boundaries as shown in Fig.5.
(4) Once recrystallization occurs in a cell, the density of the cell comes back to the relative low density, which is equal toqinitialin this CA simulation. (5) Growth of the recrystallized nuclei toward to the
recrystallized cells with the model of equiaxed growth method.
4 CA simulation parameters
4.1 Parameter categories
The parameters used in the modified CA simulation are divided into two categories:
(1) The material parameters calculated from the flow stress obtained by compression tests, such ask1and
k2in Eq. (3), the critical dislocation density (qcritical)
for DRX and the nucleation parameterNdynamic.
(2) The physical metallurgy parameters of IN718 super-alloy obtained from the reference. The values of the physical metallurgy parameters for IN718 are listed in Table1.
4.2 Determination ofk1andk2
Equation (3) describes the variation of dislocation density without the occurrence of DRX. Therefore, k1andk2can
be determined from the measured stress–strain data before the onset of DRX. By integrating Eq. (3), the following expression is obtained,
q¼ k1 k2
k1 k2
ek22eþ ffiffiffiffiffiq 0 p
ek22e
2
ð10Þ
where q0 is calculated using Eq. (1) and r0 is obtained
Fig. 5 Illustration of operation of CA mode for dynamic recrystallization
Table 1 Physical metallurgy constants for IN718 superalloy [31,32]
Parameters Values
l0(MN/m2) 7.899104 Qb(kJ/mol) 287
[image:7.595.80.512.54.332.2]from the flow stress. Onceddq
e¼0, it can be obtained,
qsaturation¼ k1 k2
2
ð11Þ
whereqsaturation is the saturation dislocation density.
Sub-stituting Eq. (11) into Eq. (10), it gives
rWH¼rsaturationþðr0rsaturationÞek22e ð12Þ
where rWH is the flow stress in the working hardening stage. For a certain deformation condition, substituting
rWH,r0andrsaturationinto Eq. (12), it gives the value ofk2.
From Eq. (11), the value ofk1can be obtained.
k1¼
1
alb
rsaturationk2 ð13Þ
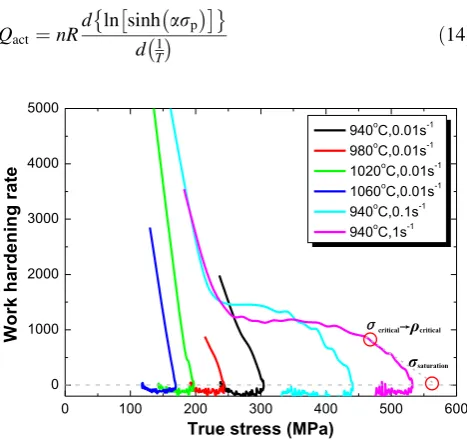
To calculatersaturationandqcriticalon the flow curve, the approach based on the analysis by Kocks and Mecking was employed [27]. Using this method, the critical and satura-tion stress for dynamic recrystallizasatura-tion can be indirectly determined from the curve of working hardening rate (h¼dr=de). Figure6 gives the stress dependence of the experimental work hardening rate at different deformation conditions. As an example (940C and 1 s-1), the key points have been marked by red circle in Fig.6.
4.3 Calculation of work hardening rate and the activation energy
The work hardening rate can be calculated from the slope of the experimental true stress–true strain curves in the work hardening stage. Recrystallization activation energy can be expressed as [27],
Qact ¼nR
dln sinh arp
d 1T ð14Þ
whereR is the gas constant, a is constant, rpis the peak stress,Tis the temperature. The value ofncan be derived from the slope in a plot of the value of ln[sinh(arp)] as a
function of lne_.Qactcan be derived from the slope in a plot
of ln[sinh(arp)] as a function of 1/T. The value of Qactis
430 kJ/mol.
4.4 Reverse method of determination of nucleation parameter
The intrinsic information of DRX such as nucleation and growth of the new recrystallized grain is embedded in the material flow stress. The optimal values of nucleation parameter can be identified when the difference between the measured and calculated stress–strain curves is mini-mized. Essentially, it is a minimization problem and the minimization objective function can be defined as:
f xð Þ ¼X N
k¼1 rcal
k ð Þ x r exp k rexpk
2
ð15Þ
whererexpk andrcal
k ð Þx are experimental and calculated flow
stresses at the strains ek(k=1,…,N), respectively. Nis the number of sampling points on the stress–strain curve andxis the nucleation parameters (Cdynamic) to be
identi-fied. Table2 shows the values obtained from flow stress curves.
5 Simulation results and discussion
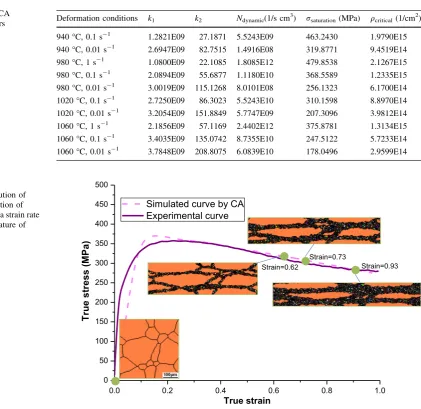
In the developed CA model, the simulation mesh is 512 9512 square lattice, and periodic boundary condi-tions are used. The size of every cell represents 2lm of the real dimension of the material. In order to balance the accuracy and computational efficiency, the increment of strain is 0.2 during coupling with the effect of grain mor-phology change on DRX. Figure7shows a comparison of predicted true stress–strain curve and experimental one. It also gives the microstructural evolution of DRX at a strain rate of 1 s-1and temperature of 1060C with considera-tion of grain morphology deformaconsidera-tion. The different color regions represent the recrystallized grains, and the orange regions denote the deformed matrix, and the black lines denote the grain boundaries (GBs). The initial microstructure (D0=210 lm) is obtained by running the
initial microstructural generation module. As shown in the figure, the grains that have not completed the DRX in each round are compressed in the vertical direction with the continuous deformation, and the newly formed recrystal-lized grains grow with the type of equiaxed growth in the cellular coordinate system. The recrystallized fraction increases with the increase in the strain from 0.62 to 0.93.
[image:8.595.52.286.467.687.2]Figure8 gives the simulated microstructures without considering the grain morphology change of the initial matrix at the temperature of 1060C and the strain rates of 1 and 0.1 s-1, respectively. Figure 9 shows the simulated results by using the CA model with support of the grain morphology technology under the same deformation
[image:9.595.122.544.49.458.2]conditions. Additionally, Fig.10 illustrates the simulated average grain size and recrystallized fraction using the topological CA model at a strain rate of 1 and 0.1 s-1and temperature of 1060C in comparison with the conven-tional CA simulation. Overall, there is a reasonable agreement between the final average grain size in CA simulations and experiments from Figs.8 and 11. Mean-while, the results also show that the grain morphology deformation has an accelerated effect on the recrystalliza-tion process. The recrystallized fracrecrystalliza-tions are 89 and 75 % for the strain rates of 0.1 and 1 s-1, respectively, when the grain morphology deformation technique was adopted as compared to only 58 and 46 % of recrystallized fractions without the consideration of grain morphology deforma-tion. The simulation results also indicate that the simulated average grain size decreases slightly due to the effect of matrix deformation. The reason for such a difference may be because that the elongated grain boundaries provide more potential nucleation sites for recrystallization due to a higher ratio of the grain boundary volume to grain volume.
Table 2 Values of CA
simulation parameters Deformation conditions k1 k2 Ndynamic(1/s cm
3)
rsaturation(MPa) qcritical(1/cm2)
940C, 0.1 s-1 1.2821E09 27.1871 5.5243E09 463.2430 1.9790E15
940C, 0.01 s-1 2.6947E09 82.7515 1.4916E08 319.8771 9.4519E14
980C, 1 s-1 1.0800E09 22.1085 1.8085E12 479.8538 2.1267E15
980C, 0.1 s-1 2.0894E09 55.6877 1.1180E10 368.5589 1.2335E15
980C, 0.01 s-1 3.0019E09 115.1268 8.0101E08 256.1323 6.1700E14
1020C, 0.1 s-1 2.7250E09 86.3023 5.5243E10 310.1598 8.8970E14
1020C, 0.01 s-1 3.2054E09 151.8849 5.7747E09 207.3096 3.9812E14
1060C, 1 s-1 2.1856E09 57.1169 2.4402E12 375.8781 1.3134E15
1060C, 0.1 s-1 3.4035E09 135.0742 8.7355E10 247.5122 5.7233E14
1060C, 0.01 s-1 3.7848E09 208.8075 6.0839E10 178.0496 2.9599E14
Fig. 7 Simulated
microstructural evolution of DRX with consideration of grain morphology at a strain rate of 1 s-1and temperature of 1060C
[image:9.595.177.544.60.211.2] [image:9.595.199.539.208.463.2] [image:9.595.52.288.561.678.2]At the same time, the newly formed recrystallized grains impinge earlier with support of the morphology change of the matrix, resulting in a smaller average grain size as compared to the conventional CA simulation [5–18]. In addition, it can be also found that the grain morphology deformation has a decreased effect on the critical strain for DRX. The reason may be due to that the reduction in the initial grain size/matrix accelerates the progress of DRX [5]. In conclusion, the CA model with the incorporation of the morphology deformation technique can better reflect the topological characteristics of the deformed grains in the simulation of DRX.
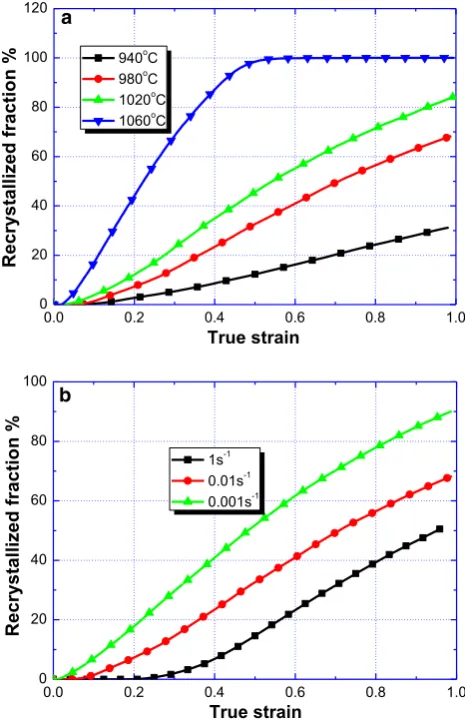
Figure11shows the simulated microstructures of IN718 superalloy under different thermomechanical conditions. The average size of the DRX grains increases from 2 to 12lm with the temperature increases from 940 to 1020C. The average grain size increases from 5 to 8 lm with strain rate decreasing from 0.01 to 0.001 s-1. It is obvious that decrease in temperature and/or increase in strain rate can refine the DRX grain size. The influences of
the strain rate and the temperature on the DRX kinetics are presented in Fig. 12. Figure12a shows the DRX kinetics at different temperatures under the strain rate of 0.01 s-1, while Fig. 12b shows the DRX kinetics at 980C under
Fig. 9 Simulated microstructures with consideration of grain morphology deformation at temperature of 1060C for different strain rates:
[image:10.595.54.542.58.98.2]a0.1 s-1andb1 s-1
Fig. 10 Simulated kinetic curves of DRX using the topological CA model at a temperature of 1060C and strain rates of 0.1 and 1 s-1, and a comparison with the conventional CA simulation result
Fig. 11 CA simulated microstructures of IN718 superalloy at a strain rate of 0.01 s-1and a strain of 1 coupling with the grain morphology technology, the temperatures are:a940C,b980C andc1020C. Anddat temperature of 980C and strain rate of 0.00 1 s-1
a
b
[image:10.595.308.541.137.500.2] [image:10.595.53.286.137.295.2] [image:10.595.54.544.613.687.2]different strain rates. It is clear that only when the strain reaches a critical value, DRX can occur at a certain tem-perature and strain rate under hot deformation. In other words, there is a need for time-dependent deformation to initiate DRX. Also, this time-dependent deformation would account for the incubation period that was observed by Fisher et al. [33]. From these figures, we can also observe that increasing the temperature and/or decreasing the strain rate can reduce the incubation period. This phenomenon is mainly attributable to the rate of dislocation accumulation and the critical strain. The faster the rate of dislocation accumulation and the smaller the critical strain, hence the shorter the incubation time.
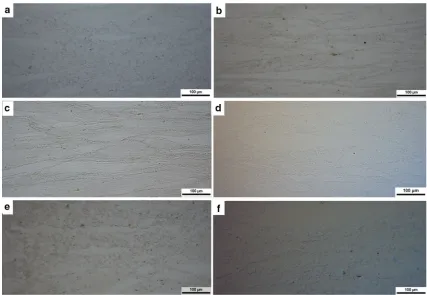
[image:11.595.83.511.56.351.2]Figure13a, b shows the grain microstructures in the deformed specimens under temperature of 1060C and strain rates of 0.1 and 1 s-1, respectively. Figure13d, f shows the grain microstructures in the deformed specimens under temperature of 980C and strain rates of 0.01 and 0.001 s-1. Under the relatively low strain rate, the equiaxed and homogeneous grains are dominant (shown in Fig.13a, f). Meanwhile, it can be found that number of DRX grains obviously decreases under the strain rate of 1 s-1, and the elongated original grains is shown easily in Fig.13b. Also, it reveals that some fine DRX grains pref-erentially nucleate at the vicinities of grain boundaries. From Fig.13a, b, d and f, it can be found that the DRX
Fig. 13 Effect of strain rate on microstructures (9200) of IN718 superalloy deformed at the temperature of 1060C and strain of 1.0 with strain rates ofa0.1 s-1andb1 s-1. Effect of temperature on
microstructures of IN718 superalloy deformed at the strain rate of 0.01 s-1and temperatures ofc940C,d980C ande1020C. And
[image:11.595.55.543.404.514.2]fat the temperature of 980C and strain rate of 0.001 s-1
Fig. 14 Prediction of microstructure evolution at a broad range of strain and the temperature of 940C and strain rate of 0.001 s-1.ae ¼ 1 ,b
grains become fine, while there are still some original coarse grains under the high strain rate. Figure13c, d and e shows the grain microstructures in the deformed specimens under 940, 980 and 1020C, respectively. Here, the true strain and strain rate are 1 and 0.01 s-1, respectively. It is clearly seen that the grain microstructures are greatly dependent on the deformation temperature. Under the rel-atively low temperature (940C), there are many elon-gated original grains, but only a few DRX grains, as shown in Fig.13c, and the recrystallized grain size is less than 2lm. When the deformation temperature increases to 980C, some equiaxed DRX grains appear and the average recrystallized grain size can be estimated as 6–8lm, as shown in Fig.13d. Under the deformation temperature of 1020C, the fraction volume of recrystallized DRX grains increases greatly and the grain microstructure is notably reined (shown in Fig.13e). As compared with the CA simulated microstructures (shown in Figs.9 and 11), the simulated recrystallized DRX grain size values are slightly higher than the experimental values. The main reason may conclude that the modified CA simulation did not consider the effect of precipitation phases such asc0,c00anddon the DRX behavior of Ni-based superalloy [34].
Figure14 shows the microstructural evolution during large strain deformation. As shown in the figure, when the strain reaches 1.0, the recrystallized fraction is less than 50 %, when the strain reaches 1.5, complete recrystalliza-tion takes place, and the initial grains are refined greatly. It is well known that one of the typical characteristic of severe plastic deformation (SPD) is refining the grain size through the large deformation [35]. Therefore, CA method is capable of predicting microstructural evolution for DRX of IN718 superalloy in SPD process such as multi-direction forging.
6 Conclusions
In this paper, the 2D CA model was developed to study on the DRX behaviors of IN718 superalloy. The main con-clusions can be summarized as follows:
(1) By introducing the mechanism of morphology change of grain, a CA model was established to describe the DRX for IN718 superalloy. At the same time, the reverse method was adopted to identify the nucleation parameter. The CA model is shown to be a new and powerful tool for quantitative and explicit simulation of microstructural evolution during DRX. The established CA model can well describe the DRX behaviors of the studied superalloy. Further-more, the developed CA model can also be used as an efficient simulation method to investigate the
microstructural evolution in large material deforma-tion on a mesoscale under the condideforma-tions such as multi-direction forging for IN718 superalloy. (2) The effects of deformation temperature and strain
rate on the recrystallized grain size are significant. Increasing the deformation temperature or decreas-ing the strain rate coarsens the recrystallized grain size. DRX is difficult to take place under the relative low temperature (900C). At a relative low strain rate of 0.001 s-1 and temperature higher than 980C, it is easier for full DRX to take place.
Acknowledgments This work was supported by the Engineering and Physical Science Research Council of UK (EP/L02084X/1), the Marie Curie International Incoming Fellowship (628,055&913,055), International Research Staff Exchange Scheme (IRSES, MatProFu-ture project, 318,968) within the 7th European Community Frame-work Programme (FP7), National Basic Research Program of China (Grant No. 2011CB012903) and National Science and Technology Major Project (Grant No. 2012ZX04012-011).
Open Access This article is distributed under the terms of the Creative Commons Attribution 4.0 International License (http://creative commons.org/licenses/by/4.0/), which permits unrestricted use, dis-tribution, and reproduction in any medium, provided you give appropriate credit to the original author(s) and the source, provide a link to the Creative Commons license, and indicate if changes were made.
References
1. X.Y. Niu, Y.J. Yu, L.H. Ma, L.B. Chen, Experimental study on the dynamic mechanical properties of titanium alloy after thermal oxidation. Appl. Phys. A122, 597 (2011)
2. L. Meng, M.H. Wang, X. Liu, F.L. Wang, Hot compression deformation behavior and a modified physically-based constitu-tive model of Cu-6%Ag alloy. Appl. Phys. A122, 387 (2016) 3. G.Z. Quan, G.C. Luo, J.T. Liang, D.S. Wu, A. Mao, Q. Liu,
Modelling for the dynamic recrystallization evolution of Ti–6Al– 4 V alloy in two-phase temperature range and a wide strain rate range. Comput. Mater. Sci.97, 136–147 (2015)
4. R.L. Goetz, V. Seetharaman, Modeling dynamic recrystallization using cellular automata. Scr. Mater.38, 405–413 (1998) 5. R. Ding, Z.X. Guo, Coupled quantitative simulation of
microstructural evolution and plastic flow during dynamic recrystallization. Acta Mater.49, 3163–3175 (2001)
6. D. Raabe, Cellular automata in materials science with particular reference to crystallization simulation. Annu. Rev. Mater. Res.
32, 53–76 (2002)
7. G. Kugler, R. Turk, Modeling the dynamic recrystallization under multi-stage hot deformation. Acta Mater.52, 4659–4668 (2004) 8. C.W. Zheng, N.M. Xiao, D.Z. Li, Y.Y. Li, Microstructure pre-diction of the austenite recrystallization during multi-pass steel strip hot rolling: a cellular automaton modelling. Comput. Mater. Sci.44, 507–514 (2008)
9. Z.Y. Jin, Z.S. Cui, Investigation on strain dependence of dynamic recrystallization behavior using an inverse analysis method. Mater. Sci. Eng. A527, 3111–3119 (2010)
11. H. Hallberg, M. Wallin, M. Ristinmaa, Simulation of discontin-uous dynamic recrystallization in pure Cu using a probabilistic cellular automaton. Comput. Mater. Sci.49, 25–34 (2010) 12. H.L. Ding, L.F. Liu, S. Kamado, W.J. Ding, Y. Kojima,
Inves-tigation of the hot compression behavior of the Mg–9Al–1Zn alloy using EBSP analysis and a cellular automata simulation. Model. Simul. Mater. Sci. Eng.17, 025009 (2009)
13. F. Chen, Z.S. Cui, J. Liu, X.X. Zhang, W. Chen, Modeling and simulation on dynamic recrystallization of 30Cr2Ni4MoV rotor steel using cellular automaton method. Modelling Simul. Mater. Sci. Eng.17, 075015 (2009)
14. F. Chen, Z.S. Cui, Mesoscale simulation of microstructure evo-lution during multi-stage hot forging processes. Model. Simul. Mater. Sci. Eng.20, 045008 (2012)
15. Y. Zhi, X.H. Liu, H.L. Yu, Cellular automaton simulation of hot deformation of TRIP steel. Comput. Mater. Sci. 81, 104–112 (2014)
16. A. Timoshenkov, P. Warczok, M. Albu, J. Klarner, E. Kozesch-nik, R. Bureau, C. Sommitsch, Modelling the dynamic recrys-tallization in C–Mn micro-alloyed steel during thermo-mechanical treatment using cellular automata. Comput. Mater. Sci.94, 85–94 (2014)
17. C. Wu, H. Yang, H.W. Li, Modeling of discontinuous dynamic recrystallization of a near-a titanium alloy IMI834 during isothermal hot compression by combining a cellular automaton model with a crystal plasticity finite element method. Comput. Mater. Sci.79, 944–959 (2013)
18. Y.C. Lin, Y.X. Liu, M.S. Chen, M.H. Huang, X. Ma, Z.L. Long, Study of static recrystallization behavior in hot deformed Ni-based superalloy using cellular automaton model. Mater. Des.99, 107–114 (2016)
19. X.M. Chen, Y.C. Lin, M.S. Chen, H.B. Li, D.X. Wen, J.L. Zhang, M. He, Microstructural evolution of a nickel-based superalloy during hot deformation. Mater. Des.77, 41–49 (2015)
20. S.C. Medeiros, Y.V.R.K. Prasad, W.G. Frazier, R. Srinivasan, Microstructural modeling of metadynamic recrystallization in hot working of IN 718 superalloy. Mater. Sci. Eng. A293, 198–207 (2000)
21. M.J. Zhang, Z.Y. Gao, J.Y. Zhuang, Z.Y. Zhong, Grain growth model of IN718 during holding period after hot deformation. J. Mater. Process. Technol.101, 25–30 (2000)
22. C.M. Kuo, Y.T. Yang, H.Y. Bor, C.N. Wei, C.C. Tai, Aging effects on the microstructure and creep behavior of Inconel 718 superalloy. Mater. Sci. Eng. A510–511, 289–294 (2009)
23. Y.C. Lin, X.M. Chen, D.X. Wen, M.S. Chen, A physically-based constitutive model for a typical nickel-based superalloy. Comput. Mater. Sci.83, 282–289 (2014)
24. Y.C. Lin, J. Deng, Y.Q. Jiang, D.X. Wen, G. Liu, Hot tensile deformation behaviors and fracture characteristics of a typical Ni-based superalloy. Mater. Des.55, 949–957 (2014)
25. Y.C. Lin, J. Deng, Y.Q. Jiang, D.X. Wen, G. Liu, Effects of initialdphase on hot tensile deformation behaviors and fracture characteristics of a typical Ni-based superalloy. Mater. Sci. Eng. A598, 251–262 (2014)
26. F. Chen, J. Liu, H. Ou, Z.S. Cui, H. Long, Flow characteristics and intrinsic work ability of IN718 superalloy. Mater. Sci. Eng. A
642, 279–287 (2015)
27. H. Mecking, U.F. Kocks, Kinetics of flow and strain-hardening. Acta Metall.29, 1865–1875 (1981)
28. Y. Estrin, H. Mecking, A unified phenomenological description of work hardening and creep based on one-parameter models. Acta Metall.32, 57–70 (1984)
29. V. Marx, F.R. Reher, G. Gottstein, Simulation of primary recrystallization using a modified three-dimensional cellular automaton. Acta Mater.47, 1219–1230 (1999)
30. F. Chen, Z.S. Cui, J. Liu, W. Chen, S. Chen, Mesoscale simu-lation of the high-temperature austenitizing and dynamic recrystallization by coupling a cellular automaton with a topology deformation technique. Mater. Sci. Eng. A 527, 5539–5549 (2010)
31. C.M. Sellars, Q. Zhu, microstructural modelling of aluminium alloys during thermomechanical processing. Mater. Sci. Eng. A
280, 1–7 (2000)
32. N. Zhou, D.C. Lv, H.L. Zhang, D. McAllister, F. Zhang, M.J. Mills, Y. Wang, Computer simulation of phase transformation and plastic deformation in IN718 superalloy: microstructural evolution during precipitation. Acta Mater.65, 270–286 (2014) 33. R. Fisher, L. Darken, K. Carroll, Accelerated growth of tin
whiskers. Acta Metall.2, 368–373 (1954)
34. X.M. Chen, Y.C. Lin, D.X. Wen, J.L. Zhang, M. He, Dynamic recrystallization behavior of a typical nickel-based superalloy. Mater. Des.57, 568–577 (2014)