This is a repository copy of
EvoSuite at the SBST 2016 Tool Competition
.
White Rose Research Online URL for this paper:
http://eprints.whiterose.ac.uk/113439/
Version: Accepted Version
Proceedings Paper:
Fraser, G. and Arcuri, A. (2016) EvoSuite at the SBST 2016 Tool Competition. In:
Proceedings of the 9th International Workshop on Search-Based Software Testing. 9th
International Workshop on Search-Based Software Testing, 14/05/2016 - 22/05/2016,
Austin, Texas. Association for Computing Machinery , pp. 33-36. ISBN 978-1-4503-4166-0
https://doi.org/10.1145/2897010.2897020
[email protected]
https://eprints.whiterose.ac.uk/
Reuse
Unless indicated otherwise, fulltext items are protected by copyright with all rights reserved. The copyright
exception in section 29 of the Copyright, Designs and Patents Act 1988 allows the making of a single copy
solely for the purpose of non-commercial research or private study within the limits of fair dealing. The
publisher or other rights-holder may allow further reproduction and re-use of this version - refer to the White
Rose Research Online record for this item. Where records identify the publisher as the copyright holder,
users can verify any specific terms of use on the publisher’s website.
Takedown
If you consider content in White Rose Research Online to be in breach of UK law, please notify us by
EvoSuite at the SBST 2016 Tool Competition
Gordon Fraser
University of Sheffield
Sheffield, UK
Andrea Arcuri
Scienta, Norway
and University of Luxembourg
ABSTRACT
EvoSuite
is a search-based tool that automatically
gener-ates unit tests for Java code. This paper summarizes the
results and experiences of
EvoSuite
’s participation at the
fourth unit testing competition at SBST 2016, where
Evo-Suite
achieved the highest overall score.
CCS Concepts
•
Software and its engineering
→
Software testing
and debugging; Search-based software engineering;
Keywords
test case generation; search-based testing; testing classes;
search-based software engineering
1.
INTRODUCTION
This paper describes the results of applying the
EvoSuite
test generation tool [2] to the benchmark used in the tool
competition at the International Workshop on Search-Based
Software Testing (SBST) 2016. Details about the
competi-tion and the benchmark can be found in [14]. In this
com-petition,
EvoSuite
achieved a 1126.7 overall score, which
was the highest among the competing tools.
2.
ABOUT EVOSUITE
EvoSuite
[2, 6] automatically generates test suites for
Java classes, targeting branch coverage and other coverage
criteria (e.g., mutation testing [8]).
EvoSuite
works at the
Java bytecode level, i.e., it does not require source code.
It is fully automated and requires no manually written test
drivers or parameterized unit tests. For example, when
Evo-Suite
is used from its Eclipse and IntelliJ plugins, a user
just needs to select a class, and tests are generated with a
mouse-click.
EvoSuite
has been evaluated on millions of lines of Java
code [9], both open-source code and close-source code
pro-Permission to make digital or hard copies of part or all of this work for personal or
classroom use is granted without fee provided that copies are not made or distributed
for profit or commercial advantage and that copies bear this notice and the full citation
on the first page. Copyrights for third-party components of this work must be honored.
For all other uses, contact the owner/author(s).
ICSE ’16 May 16-17 2016, Austin, TX, USA
c
2016 Copyright held by the owner/author(s).
ACM ISBN 978-1-4503-4166-0/16/05.
[image:2.612.318.554.236.555.2]DOI:
http://dx.doi.org/10.1145/2897010.2897020
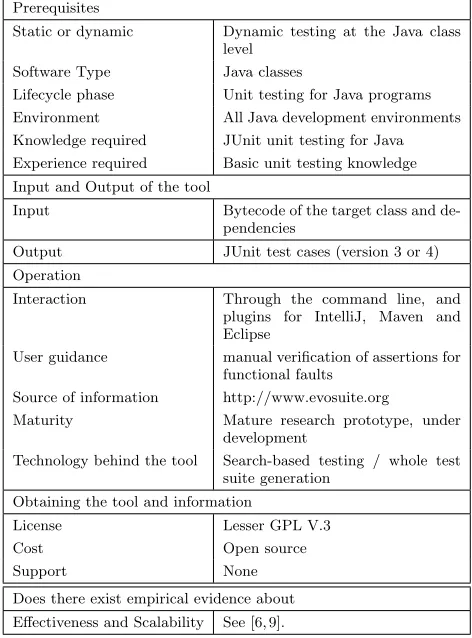
Table 1: Classification of the
EvoSuite
unit test
gen-eration tool.
Prerequisites
Static or dynamic
Dynamic testing at the Java class
level
Software Type
Java classes
Lifecycle phase
Unit testing for Java programs
Environment
All Java development environments
Knowledge required
JUnit unit testing for Java
Experience required
Basic unit testing knowledge
Input and Output of the tool
Input
Bytecode of the target class and
de-pendencies
Output
JUnit test cases (version 3 or 4)
Operation
Interaction
Through the command line, and
plugins for IntelliJ, Maven and
Eclipse
User guidance
manual verification of assertions for
functional faults
Source of information
http://www.evosuite.org
Maturity
Mature research prototype, under
development
Technology behind the tool
Search-based testing / whole test
suite generation
Obtaining the tool and information
License
Lesser GPL V.3
Cost
Open source
Support
None
Does there exist empirical evidence about
Effectiveness and Scalability
See [6, 9].
vided by one of our industrial partners. In the first two
edi-tions of the unit testing tool competition,
EvoSuite
ranked
first [4, 5], whereas it ranked second in the third one.
EvoSuite
uses an evolutionary approach to derive these
test suites: A genetic algorithm evolves candidate
individu-als (chromosomes) using operators inspired by natural
evo-lution (e.g., selection, crossover and mutation), such that
iteratively better solutions with respect to the optimization
target (e.g., branch coverage) are produced. For details on
this test generation approach we refer to [6].
To select the most effective assertions,
EvoSuite
uses
mu-tation analysis [11].
EvoSuite
can also be used to
automat-ically find faults such as undeclared thrown exceptions and
broken code contracts [7]. For more details on the tool and
its abilities we refer to [2, 3].
3.
COMPETITION SETUP
EvoSuite
can be configured to target different coverage
criteria. The fitness function to drive the genetic algorithm
was based on a combination of several criteria [12] (e.g.,
line coverage, branch coverage, branch coverage by direct
method invocation, weak mutation testing, output
cover-age, exception coverage).
EvoSuite
now by default uses
an archive of solutions [13], which means that throughout
the search, whenever a new coverage goal is satisfied, the
corresponding test is stored in the archive, and this goal is
no longer targeted by the fitness function. We enabled the
post-processing step of test minimization, but to reduce the
time spent we included all assertions rather than filtering
them with mutation analysis [11]. The use of all assertions
has effects on readability and the chances of obtaining flaky
tests. However, as readability is not measured by the SBST
contest metric, and many of the improvements to
EvoSuite
since the last competition target flaky tests, we deemed this
not a problem.
In contrast to previous instances of the competition, the
test generation tools this time received a time budget as
input, and then had to generate tests within that time.
EvoSuite
uses a combination of different timeouts for its
individual phases (e.g., initialization, search, minimization,
assertion generation, compilation check, removal of flaky
tests), which created the challenge of distributing the
over-all budget onto these phases. We used a simple approach
where 50% of the time was allocated to the search, whereas
the other half of the time was distributed equally to the
re-maining phases. If any of the phases used more time than
allocated, which can for example happen if test executions
take long or lead to timeouts, then phases for which there
is no time left are skipped. For example, if there is no time
left for minimization, then the raw test suite as generated
by the search is returned.
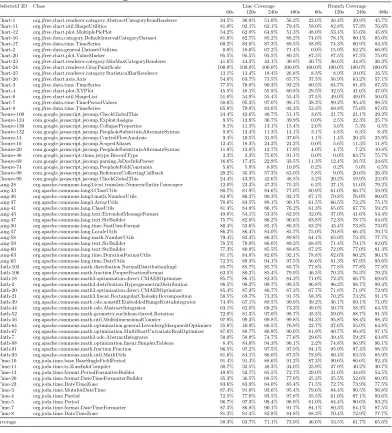
4.
BENCHMARK RESULTS
The coverage results (line coverage and branch coverage)
achieved by
EvoSuite
on the benchmark classes are listed
in Table 2. Coverage is generally in the expected range, with
clear increases for higher time budgets. Coverage on several
of the benchmarks from Closure is low, which matches
pre-vious findings [15].
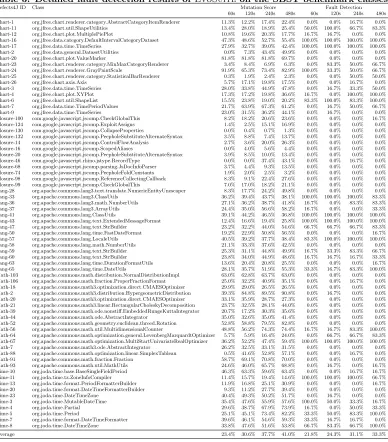
Results in terms of mutation scores and fault detection
ratio (i.e., how many of the runs had at least one failing test
on the corresponding bug) are showing in Table 3. Again
the Closure results are generally worse than those of other
projects, both in terms of mutation score and ratio of fault
detection.
On average,
EvoSuite
generated 0.14 flaky tests per run,
a value that is significantly lower than that of any of the
competing tools. This is due to extensive efforts to isolate
EvoSuite
tests from the execution environment [1]. A few
of these flaky tests were introduced by recent changes to
EvoSuite
following experiments on Defects4J [15]:
Evo-Suite
now includes assertions on the source of exceptions,
similar to commercial tools like Agitar One. Unfortunately,
there were several instances in the competition where these
assertions lead to flaky tests. For example, the following
is an excerpt from a test for the Defects4J bug Lang-41,
generated by
EvoSuite
:
@Test ( t i m e o u t = 4000)
public void test19 ()
throws T h r o w a b l e
{
Class < Double > class0 = Double . class ;
String s t r i n g 0 = C l a s s U t i l s . g e t P a c k a g e N a m e ( class0 ) ;
try {
C l a s s U t i l s . g e t C l a s s ( s t r i n g 0 ) ;
fail (" E x p e c t i n g e x c e p t i o n : C l a s s N o t F o u n d E x c e p t i o n
") ;
} catch ( C l a s s N o t F o u n d E x c e p t i o n e ) {
a s s e r t T h r o w n B y (" java . net . U R L C l a s s L o a d e r " , e ) ;
}
}
While compiling and executing this test with JUnit works
without problems, the mutation analysis step of the
compe-tition used Ant to run the tests; Ant uses a complex setup
of classloaders that eventually leads to the
assertThrownBy
in the above example to fail, as the source of the exception
is a different one.
There are 15 runs in total where
EvoSuite
did not
pro-duce any test suites; these are only for higher time
bud-gets (240s, 480s). The majority of these runs are due to
EvoSuite
not terminating before the hard timeout of the
competition infrastructure. This may happen, for example,
when test execution on the class under test takes long (e.g.,
timeouts), and when resetting the static state of the classes
under test takes a long time. However, this number is still
lower than the number of erroneous runs compared to other
tools, and in the remaining 1617 runs of the competition
EvoSuite
terminated in time and produced at least two
tests. In 13 of these,
EvoSuite
produced a test suite with
a compilation error.
5.
CONCLUSIONS
With an overall score of 1126.7,
EvoSuite
achieved the
highest score of all tools in the competition.
To learn more about
EvoSuite
, visit our Web site:
http://www.evosuite.org
Acknowledgments:
Many thanks to all the
contribu-tors to
EvoSuite
. This project has been funded by the
EPSRC project EP/N023978/1 and the National Research
Fund, Luxembourg (FNR/P10/03).
6.
REFERENCES
[1] A. Arcuri, G. Fraser, and J. P. Galeotti, “Automated
unit test generation for classes with environment
dependencies,” in
IEEE/ACM Int. Conference on
Automated Software Engineering (ASE)
.
ACM, 2014,
pp. 79–90.
[2] G. Fraser and A. Arcuri, “EvoSuite: Automatic test
suite generation for object-oriented software.” in
ACM
Symposium on the Foundations of Software
Engineering (FSE)
, 2011, pp. 416–419.
[3] ——, “EvoSuite: On the challenges of test case
Table 2: Detailed coverage results of
EvoSuite
on the SBST benchmark classes.
Defects4J ID Class Line Coverage Branch Coverage
60s 120s 240s 480s 60s 120s 240s 480s Chart-1 org.jfree.chart.renderer.category.AbstractCategoryItemRenderer 34.5% 36.8% 51.0% 56.2% 22.6% 26.4% 39.9% 45.7% Chart-11 org.jfree.chart.util.ShapeUtilities 81.0% 92.1% 62.1% 79.4% 58.0% 82.8% 57.3% 76.6% Chart-12 org.jfree.chart.plot.MultiplePiePlot 54.2% 62.0% 64.9% 51.3% 48.0% 53.4% 55.6% 45.8% Chart-16 org.jfree.data.category.DefaultIntervalCategoryDataset 81.8% 82.7% 85.2% 88.2% 74.6% 78.1% 80.1% 85.0% Chart-17 org.jfree.data.time.TimeSeries 69.2% 83.0% 87.3% 89.5% 58.9% 74.3% 80.9% 84.5% Chart-2 org.jfree.data.general.DatasetUtilities 0.0% 18.0% 67.2% 71.4% 0.0% 15.9% 62.2% 66.9% Chart-20 org.jfree.chart.plot.ValueMarker 95.5% 95.5% 95.5% 80.3% 87.5% 87.5% 87.5% 75.0% Chart-23 org.jfree.chart.renderer.category.MinMaxCategoryRenderer 41.6% 44.2% 43.1% 30.8% 30.7% 36.6% 34.8% 26.2% Chart-24 org.jfree.chart.renderer.GrayPaintScale 100.0% 100.0% 100.0% 100.0% 100.0% 100.0% 100.0% 100.0% Chart-25 org.jfree.chart.renderer.category.StatisticalBarRenderer 13.1% 13.4% 18.4% 26.8% 8.3% 8.9% 10.0% 16.5% Chart-26 org.jfree.chart.axis.Axis 54.6% 63.7% 73.5% 65.7% 37.5% 56.9% 63.2% 57.1% Chart-3 org.jfree.data.time.TimeSeries 77.5% 78.8% 90.3% 93.2% 60.5% 64.7% 81.4% 87.5% Chart-4 org.jfree.chart.plot.XYPlot 45.5% 48.1% 55.9% 60.8% 29.5% 32.5% 41.6% 47.6% Chart-6 org.jfree.chart.util.ShapeList 51.0% 54.9% 55.4% 55.4% 37.5% 49.0% 49.0% 50.0% Chart-7 org.jfree.data.time.TimePeriodValues 58.6% 95.3% 97.0% 98.1% 38.3% 89.2% 95.4% 98.5% Chart-9 org.jfree.data.time.TimeSeries 65.8% 79.8% 83.6% 92.3% 53.3% 69.8% 75.6% 87.0% Closure-100 com.google.javascript.jscomp.CheckGlobalThis 24.4% 42.6% 40.7% 51.1% 3.6% 21.7% 21.1% 29.2% Closure-124 com.google.javascript.jscomp.ExploitAssigns 9.5% 12.8% 36.7% 39.9% 0.0% 2.5% 22.3% 25.7% Closure-130 com.google.javascript.jscomp.CollapseProperties 9.1% 11.3% 13.1% 15.4% 2.6% 3.6% 5.3% 6.5% Closure-132 com.google.javascript.jscomp.PeepholeSubstituteAlternateSyntax 9.8% 13.4% 11.3% 14.1% 3.1% 4.8% 6.3% 8.4% Closure-14 com.google.javascript.jscomp.ControlFlowAnalysis 9.4% 10.5% 31.9% 37.6% 1.1% 1.4% 20.4% 25.9% Closure-16 com.google.javascript.jscomp.ScopedAliases 12.4% 18.3% 24.2% 24.2% 0.0% 5.6% 11.3% 11.8% Closure-20 com.google.javascript.jscomp.PeepholeSubstituteAlternateSyntax 11.0% 12.8% 12.7% 17.9% 4.0% 4.7% 7.2% 10.8% Closure-46 com.google.javascript.rhino.jstype.RecordType 2.3% 2.3% 75.6% 91.1% 0.0% 0.0% 63.7% 75.7% Closure-68 com.google.javascript.jscomp.parsing.JsDocInfoParser 16.6% 17.4% 22.9% 33.5% 11.3% 12.4% 16.5% 24.6% Closure-74 com.google.javascript.jscomp.PeepholeFoldConstants 5.6% 5.8% 8.9% 10.9% 0.2% 0.2% 5.0% 6.5% Closure-98 com.google.javascript.jscomp.ReferenceCollectingCallback 29.2% 35.3% 57.3% 63.0% 5.8% 9.0% 20.6% 26.3% Closure-99 com.google.javascript.jscomp.CheckGlobalThis 24.4% 43.3% 42.6% 48.5% 3.2% 20.2% 19.9% 23.9% Lang-28 org.apache.commons.lang3.text.translate.NumericEntityUnescaper 12.0% 23.3% 47.3% 75.3% 6.2% 27.1% 51.0% 79.2% Lang-33 org.apache.commons.lang3.ClassUtils 80.7% 81.9% 84.6% 77.0% 60.9% 61.0% 66.7% 59.9% Lang-36 org.apache.commons.lang3.math.NumberUtils 83.9% 86.2% 90.3% 92.1% 67.1% 70.8% 76.0% 80.0% Lang-37 org.apache.commons.lang3.ArrayUtils 78.6% 83.5% 88.1% 90.1% 61.5% 66.5% 72.2% 75.1% Lang-41 org.apache.commons.lang.ClassUtils 81.4% 84.8% 86.1% 76.2% 61.3% 65.6% 67.7% 59.2% Lang-43 org.apache.commons.lang.text.ExtendedMessageFormat 49.6% 54.1% 53.3% 62.9% 32.0% 37.9% 41.6% 54.4% Lang-47 org.apache.commons.lang.text.StrBuilder 75.7% 82.0% 86.2% 90.6% 63.8% 72.3% 78.7% 84.6% Lang-50 org.apache.commons.lang.time.FastDateFormat 80.4% 53.6% 85.1% 86.3% 63.2% 43.4% 73.8% 73.0% Lang-57 org.apache.commons.lang.LocaleUtils 86.2% 86.4% 84.0% 85.7% 75.0% 70.8% 66.4% 70.1% Lang-58 org.apache.commons.lang.math.NumberUtils 79.4% 82.3% 86.3% 89.8% 64.1% 65.9% 73.4% 77.7% Lang-59 org.apache.commons.lang.text.StrBuilder 78.5% 79.9% 86.0% 89.3% 68.8% 71.4% 79.1% 82.0% Lang-60 org.apache.commons.lang.text.StrBuilder 77.3% 80.9% 85.5% 88.6% 67.2% 72.9% 77.0% 81.3% Lang-63 org.apache.commons.lang.time.DurationFormatUtils 81.1% 84.8% 82.6% 92.1% 78.8% 82.6% 80.2% 90.1% Lang-65 org.apache.commons.lang.time.DateUtils 72.5% 89.3% 94.1% 97.5% 56.6% 81.3% 87.9% 93.6% Math-103 org.apache.commons.math.distribution.NormalDistributionImpl 85.7% 85.7% 85.7% 85.7% 77.8% 77.8% 77.8% 77.8% Math-106 org.apache.commons.math.fraction.ProperFractionFormat 63.5% 80.2% 85.4% 79.9% 46.5% 70.2% 76.3% 70.2% Math-18 org.apache.commons.math3.optimization.direct.CMAESOptimizer 85.7% 86.1% 82.3% 84.2% 71.0% 72.2% 66.7% 69.6% Math-2 org.apache.commons.math3.distribution.HypergeometricDistribution 98.5% 98.2% 99.7% 99.5% 96.8% 96.2% 98.7% 99.4% Math-20 org.apache.commons.math3.optimization.direct.CMAESOptimizer 85.4% 87.3% 86.7% 87.3% 67.7% 71.8% 71.9% 72.9% Math-21 org.apache.commons.math3.linear.RectangularCholeskyDecomposition 58.5% 69.7% 73.3% 91.5% 58.3% 70.2% 73.2% 91.1% Math-39 org.apache.commons.math.ode.nonstiff.EmbeddedRungeKuttaIntegrator 74.4% 67.1% 89.5% 90.9% 39.2% 36.1% 69.1% 71.0% Math-44 org.apache.commons.math.ode.AbstractIntegrator 63.1% 62.6% 68.2% 73.3% 49.6% 50.7% 58.3% 64.5% Math-52 org.apache.commons.math.geometry.euclidean.threed.Rotation 72.9% 81.3% 97.0% 98.7% 45.5% 59.0% 88.7% 91.5% Math-56 org.apache.commons.math.util.MultidimensionalCounter 97.9% 99.3% 99.8% 99.8% 94.3% 95.8% 98.4% 98.4% Math-64 org.apache.commons.math.optimization.general.LevenbergMarquardtOptimizer 35.8% 40.9% 66.5% 76.9% 22.7% 27.6% 55.0% 64.8% Math-67 org.apache.commons.math.optimization.MultiStartUnivariateRealOptimizer 87.6% 88.7% 86.9% 90.0% 81.9% 90.7% 86.8% 97.1% Math-7 org.apache.commons.math3.ode.AbstractIntegrator 50.0% 58.9% 74.7% 77.6% 29.6% 39.4% 59.2% 63.8% Math-88 org.apache.commons.math.optimization.linear.SimplexTableau 8.4% 84.0% 94.3% 96.1% 2.2% 74.8% 86.9% 96.1% Math-91 org.apache.commons.math.fraction.Fraction 96.5% 97.2% 97.5% 97.9% 94.1% 95.9% 97.4% 98.5% Math-93 org.apache.commons.math.util.MathUtils 81.6% 84.1% 86.0% 87.5% 78.9% 80.4% 83.5% 85.9% Time-10 org.joda.time.base.BaseSingleFieldPeriod 91.4% 91.4% 88.6% 91.2% 87.3% 90.6% 86.6% 92.4% Time-11 org.joda.time.tz.ZoneInfoCompiler 30.7% 32.5% 46.3% 34.0% 25.9% 27.9% 40.2% 30.7% Time-13 org.joda.time.format.PeriodFormatterBuilder 49.8% 52.7% 65.5% 72.7% 29.0% 31.0% 44.6% 54.5% Time-20 org.joda.time.format.DateTimeFormatterBuilder 35.3% 36.5% 68.5% 77.0% 25.3% 25.5% 52.6% 60.9% Time-23 org.joda.time.DateTimeZone 83.6% 83.9% 84.0% 85.4% 71.5% 72.7% 73.9% 77.5% Time-3 org.joda.time.MutableDateTime 87.4% 91.0% 93.6% 95.4% 79.6% 84.4% 90.5% 96.8%
Time-4 org.joda.time.Partial 72.5% 77.0% 93.5% 97.8% 55.5% 61.0% 87.1% 93.6%
Time-5 org.joda.time.Period 96.7% 97.3% 98.4% 98.9% 81.0% 84.4% 90.6% 93.2%
Time-7 org.joda.time.format.DateTimeFormatter 87.3% 86.8% 90.1% 91.7% 84.1% 80.3% 84.1% 87.5% Time-8 org.joda.time.DateTimeZone 81.3% 81.4% 82.8% 84.8% 68.3% 70.4% 72.9% 77.7%
Average 58.3% 63.7% 71.1% 73.9% 46.6% 53.5% 61.7% 65.6%
[4] ——, “Evosuite at the SBST 2013 tool competition,”
in
International Workshop on Search-Based Software
Testing (SBST)
, 2013, pp. 406–409.
[5] ——, “Evosuite at the second unit testing tool
competition.” in
Fittest Workshop
, 2013.
[6] ——, “Whole test suite generation,”
IEEE
Transactions on Software Engineering
, vol. 39, no. 2,
pp. 276–291, 2013.
[7] ——, “1600 faults in 100 projects: Automatically
finding faults while achieving high coverage with
evosuite,”
Empirical Software Engineering (EMSE)
,
2014.
[8] ——, “Achieving scalable mutation-based generation
of whole test suites.”
Empirical Software Engineering
(EMSE)
, 2014.
[9] ——, “A large-scale evaluation of automated unit test
generation using evosuite,”
ACM Transactions on
Software Engineering and Methodology (TOSEM)
,
vol. 24, no. 2, p. 8, 2014.
[10] G. Fraser, M. Staats, P. McMinn, A. Arcuri, and
F. Padberg, “Does automated white-box test
generation really help software testers?” in
Proceedings
of the 2013 International Symposium on Software
Testing and Analysis
.
ACM, 2013, pp. 291–301.
[11] G. Fraser and A. Zeller, “Mutation-driven generation
of unit tests and oracles,”
IEEE Transactions on
Software Engineering (TSE)
, vol. 28, no. 2, pp.
278–292, 2012.
[12] J. M. Rojas, J. Campos, M. Vivanti, G. Fraser, and
A. Arcuri, “Combining multiple coverage criteria in
search-based unit test generation,” in
Search-Based
Software Engineering
.
Springer, 2015, pp. 93–108.
[13] J. M. Rojas, M. Vivanti, A. Arcuri, and G. Fraser, “A
Detailed Investigation of the Effectiveness of Whole
Test Suite Generation,”
Empirical Software
Table 3: Detailed fault detection results of
EvoSuite
on the SBST benchmark classes.
Defects4J ID Class Mutation Score Fault Detection
60s 120s 240s 480s 60s 120s 240s 480s Chart-1 org.jfree.chart.renderer.category.AbstractCategoryItemRenderer 11.3% 12.2% 17.4% 22.4% 0.0% 0.0% 16.7% 0.0% Chart-11 org.jfree.chart.util.ShapeUtilities 13.4% 28.0% 18.9% 25.4% 50.0% 100.0% 66.7% 83.3% Chart-12 org.jfree.chart.plot.MultiplePiePlot 10.8% 19.6% 20.3% 17.7% 16.7% 16.7% 0.0% 0.0% Chart-16 org.jfree.data.category.DefaultIntervalCategoryDataset 47.3% 48.6% 52.7% 55.4% 100.0% 100.0% 100.0% 100.0% Chart-17 org.jfree.data.time.TimeSeries 27.9% 32.7% 39.0% 42.4% 100.0% 100.0% 100.0% 100.0% Chart-2 org.jfree.data.general.DatasetUtilities 0.0% 7.3% 43.4% 49.9% 0.0% 0.0% 0.0% 0.0% Chart-20 org.jfree.chart.plot.ValueMarker 81.8% 81.8% 81.8% 69.7% 0.0% 0.0% 0.0% 0.0% Chart-23 org.jfree.chart.renderer.category.MinMaxCategoryRenderer 3.4% 8.4% 6.9% 6.3% 0.0% 83.3% 50.0% 66.7% Chart-24 org.jfree.chart.renderer.GrayPaintScale 91.9% 65.3% 73.4% 82.9% 100.0% 33.3% 50.0% 66.7% Chart-25 org.jfree.chart.renderer.category.StatisticalBarRenderer 0.3% 1.9% 2.4% 2.3% 0.0% 0.0% 50.0% 50.0% Chart-26 org.jfree.chart.axis.Axis 5.7% 17.1% 19.8% 17.5% 0.0% 0.0% 16.7% 0.0% Chart-3 org.jfree.data.time.TimeSeries 28.0% 33.8% 44.9% 47.8% 0.0% 16.7% 33.3% 50.0% Chart-4 org.jfree.chart.plot.XYPlot 17.3% 17.2% 19.8% 36.6% 16.7% 0.0% 100.0% 100.0% Chart-6 org.jfree.chart.util.ShapeList 15.5% 23.8% 19.0% 20.2% 83.3% 100.0% 83.3% 100.0% Chart-7 org.jfree.data.time.TimePeriodValues 21.7% 63.9% 67.3% 61.2% 0.0% 16.7% 50.0% 66.7% Chart-9 org.jfree.data.time.TimeSeries 23.0% 31.5% 36.2% 44.1% 0.0% 16.7% 0.0% 0.0% Closure-100 com.google.javascript.jscomp.CheckGlobalThis 8.2% 18.2% 20.6% 23.6% 0.0% 0.0% 0.0% 16.7% Closure-124 com.google.javascript.jscomp.ExploitAssigns 1.4% 2.5% 15.1% 16.9% 0.0% 0.0% 0.0% 0.0% Closure-130 com.google.javascript.jscomp.CollapseProperties 0.0% 0.4% 0.7% 1.3% 0.0% 0.0% 0.0% 0.0% Closure-132 com.google.javascript.jscomp.PeepholeSubstituteAlternateSyntax 3.5% 8.8% 7.4% 13.7% 0.0% 0.0% 0.0% 0.0% Closure-14 com.google.javascript.jscomp.ControlFlowAnalysis 2.7% 3.6% 20.0% 26.3% 0.0% 0.0% 0.0% 0.0% Closure-16 com.google.javascript.jscomp.ScopedAliases 0.0% 4.0% 5.6% 4.4% 0.0% 0.0% 0.0% 0.0% Closure-20 com.google.javascript.jscomp.PeepholeSubstituteAlternateSyntax 3.9% 8.5% 10.0% 13.4% 0.0% 0.0% 0.0% 0.0% Closure-46 com.google.javascript.rhino.jstype.RecordType 0.0% 0.0% 37.4% 43.1% 0.0% 0.0% 16.7% 0.0% Closure-68 com.google.javascript.jscomp.parsing.JsDocInfoParser 3.7% 4.4% 9.3% 13.5% 0.0% 0.0% 0.0% 0.0% Closure-74 com.google.javascript.jscomp.PeepholeFoldConstants 1.9% 2.0% 2.5% 3.2% 0.0% 0.0% 0.0% 0.0% Closure-98 com.google.javascript.jscomp.ReferenceCollectingCallback 8.3% 9.1% 22.4% 27.6% 0.0% 0.0% 0.0% 0.0% Closure-99 com.google.javascript.jscomp.CheckGlobalThis 7.0% 17.0% 18.2% 21.1% 0.0% 0.0% 0.0% 0.0% Lang-28 org.apache.commons.lang3.text.translate.NumericEntityUnescaper 8.3% 17.7% 24.2% 49.8% 0.0% 0.0% 0.0% 0.0% Lang-33 org.apache.commons.lang3.ClassUtils 36.2% 39.4% 43.7% 38.1% 100.0% 100.0% 100.0% 83.3% Lang-36 org.apache.commons.lang3.math.NumberUtils 27.1% 36.2% 38.7% 41.8% 16.7% 0.0% 83.3% 83.3% Lang-37 org.apache.commons.lang3.ArrayUtils 24.4% 35.0% 56.6% 58.2% 16.7% 0.0% 0.0% 33.3% Lang-41 org.apache.commons.lang.ClassUtils 39.1% 44.2% 46.5% 36.8% 100.0% 100.0% 100.0% 100.0% Lang-43 org.apache.commons.lang.text.ExtendedMessageFormat 12.4% 16.6% 19.4% 25.8% 100.0% 100.0% 100.0% 100.0% Lang-47 org.apache.commons.lang.text.StrBuilder 23.2% 32.2% 44.0% 54.6% 66.7% 66.7% 66.7% 83.3% Lang-50 org.apache.commons.lang.time.FastDateFormat 19.2% 22.9% 50.8% 56.5% 0.0% 0.0% 0.0% 16.7% Lang-57 org.apache.commons.lang.LocaleUtils 40.5% 39.2% 37.7% 38.4% 83.3% 100.0% 100.0% 100.0% Lang-58 org.apache.commons.lang.math.NumberUtils 21.1% 33.3% 37.6% 42.5% 0.0% 0.0% 0.0% 0.0% Lang-59 org.apache.commons.lang.text.StrBuilder 25.3% 31.1% 44.8% 49.9% 16.7% 33.3% 83.3% 66.7% Lang-60 org.apache.commons.lang.text.StrBuilder 23.8% 34.0% 44.9% 48.6% 16.7% 16.7% 16.7% 33.3% Lang-63 org.apache.commons.lang.time.DurationFormatUtils 13.6% 20.4% 20.8% 25.5% 0.0% 0.0% 0.0% 16.7% Lang-65 org.apache.commons.lang.time.DateUtils 28.1% 35.7% 51.9% 55.3% 33.3% 16.7% 83.3% 100.0% Math-103 org.apache.commons.math.distribution.NormalDistributionImpl 63.0% 62.8% 63.7% 63.0% 0.0% 0.0% 0.0% 0.0% Math-106 org.apache.commons.math.fraction.ProperFractionFormat 25.0% 32.2% 40.9% 35.1% 0.0% 0.0% 16.7% 0.0% Math-18 org.apache.commons.math3.optimization.direct.CMAESOptimizer 29.9% 29.0% 26.5% 26.5% 0.0% 0.0% 0.0% 0.0% Math-2 org.apache.commons.math3.distribution.HypergeometricDistribution 39.3% 84.8% 89.5% 90.8% 0.0% 16.7% 0.0% 0.0% Math-20 org.apache.commons.math3.optimization.direct.CMAESOptimizer 33.1% 35.9% 28.7% 27.3% 0.0% 0.0% 0.0% 0.0% Math-21 org.apache.commons.math3.linear.RectangularCholeskyDecomposition 23.7% 32.5% 28.1% 44.0% 0.0% 0.0% 0.0% 0.0% Math-39 org.apache.commons.math.ode.nonstiff.EmbeddedRungeKuttaIntegrator 20.7% 17.2% 30.3% 35.6% 0.0% 0.0% 0.0% 0.0% Math-44 org.apache.commons.math.ode.AbstractIntegrator 35.0% 32.6% 35.0% 41.4% 0.0% 0.0% 0.0% 0.0% Math-52 org.apache.commons.math.geometry.euclidean.threed.Rotation 52.8% 58.8% 79.5% 82.8% 0.0% 0.0% 0.0% 0.0% Math-56 org.apache.commons.math.util.MultidimensionalCounter 48.8% 56.2% 74.3% 74.4% 16.7% 16.7% 83.3% 100.0% Math-64 org.apache.commons.math.optimization.general.LevenbergMarquardtOptimizer 5.7% 5.9% 16.4% 24.0% 0.0% 66.7% 66.7% 83.3% Math-67 org.apache.commons.math.optimization.MultiStartUnivariateRealOptimizer 36.2% 52.2% 47.4% 59.4% 100.0% 100.0% 100.0% 100.0% Math-7 org.apache.commons.math3.ode.AbstractIntegrator 26.2% 32.5% 33.1% 31.5% 0.0% 0.0% 0.0% 0.0% Math-88 org.apache.commons.math.optimization.linear.SimplexTableau 0.5% 41.6% 52.8% 57.1% 0.0% 0.0% 16.7% 0.0% Math-91 org.apache.commons.math.fraction.Fraction 58.7% 69.1% 70.8% 70.0% 0.0% 0.0% 0.0% 0.0% Math-93 org.apache.commons.math.util.MathUtils 24.6% 46.0% 65.7% 68.8% 0.0% 16.7% 0.0% 16.7% Time-10 org.joda.time.base.BaseSingleFieldPeriod 46.3% 63.3% 59.6% 63.4% 0.0% 0.0% 16.7% 16.7% Time-11 org.joda.time.tz.ZoneInfoCompiler 11.4% 15.7% 19.4% 14.6% 100.0% 100.0% 100.0% 66.7% Time-13 org.joda.time.format.PeriodFormatterBuilder 11.9% 16.8% 25.1% 30.9% 0.0% 0.0% 0.0% 16.7% Time-20 org.joda.time.format.DateTimeFormatterBuilder 9.3% 11.2% 27.7% 39.4% 0.0% 0.0% 0.0% 0.0% Time-23 org.joda.time.DateTimeZone 40.4% 49.3% 50.2% 51.7% 0.0% 16.7% 0.0% 0.0% Time-3 org.joda.time.MutableDateTime 35.4% 47.6% 55.9% 57.6% 100.0% 50.0% 33.3% 16.7%
Time-4 org.joda.time.Partial 29.6% 38.7% 67.9% 73.9% 16.7% 0.0% 50.0% 33.3%
Time-5 org.joda.time.Period 25.1% 45.1% 73.4% 82.2% 33.3% 50.0% 83.3% 100.0%
Time-7 org.joda.time.format.DateTimeFormatter 39.6% 46.1% 54.6% 59.3% 33.3% 16.7% 16.7% 0.0% Time-8 org.joda.time.DateTimeZone 33.8% 47.6% 51.6% 53.8% 66.7% 83.3% 66.7% 100.0%
Average 23.4% 30.6% 37.7% 41.0% 21.8% 24.3% 31.1% 33.3%