White Rose Research Online URL for this paper: http://eprints.whiterose.ac.uk/101872/
Version: Accepted Version
Article:
Haynes, BI orcid.org/0000-0003-0054-6591, Bauermeister, S and Bunce, D
orcid.org/0000-0003-3265-2700 (2017) Does within-person variability predict errors in healthy adults aged 18–90? Quarterly Journal of Experimental Psychology, 70 (8). pp. 1722-1731. ISSN 1747-0218
https://doi.org/10.1080/17470218.2016.1204328
© 2016, The Experimental Psychology Society. This is an Accepted Manuscript of an article published by Taylor & Francis in Quarterly Journal of Experimental Psychology on 12/07/2016, available online: http://dx.doi.org/10.1080/17470218.2016.1204328. Uploaded in accordance with the publisher's self-archiving policy.
[email protected] https://eprints.whiterose.ac.uk/ Reuse
Unless indicated otherwise, fulltext items are protected by copyright with all rights reserved. The copyright exception in section 29 of the Copyright, Designs and Patents Act 1988 allows the making of a single copy solely for the purpose of non-commercial research or private study within the limits of fair dealing. The publisher or other rights-holder may allow further reproduction and re-use of this version - refer to the White Rose Research Online record for this item. Where records identify the publisher as the copyright holder, users can verify any specific terms of use on the publisher’s website.
Takedown
If you consider content in White Rose Research Online to be in breach of UK law, please notify us by
Publisher: Taylor & Francis & The Experimental Psychology Society
Journal: The Quarterly Journal of Experimental Psychology
DOI: 10.1080/17470218.2016.1204328
Does within-person variability predict errors in healthy adults aged 18-90? Becky I. Haynes, Sarah Bauermeister and David Bunce
University of Leeds
Becky I. Haynes, David Bunce, and Sarah Bauermeister, School of Psychology, Faculty of Medicine and Health, University of Leeds, Leeds, UK
Correspondence concerning this article should be addressed to Becky I. Haynes, School of Psychology, Faculty of Medicine and Health, University of Leeds, Leeds, LS2 9JT,
UK. Email: [email protected]. Phone: +44(0)113 3430570
Acknowledgements
The Bunce et al. (2008) study was supported by the Economic and Social Research Council, UK, under Grant RES-000-22-1399. We would like to thank Rowena Handley for her assistance in collecting data for that study.
Abstract
This study investigated within-person variability on basic psychomotor tasks in relation to errors on a higher-order cognitive task. We were interested in whether more variable
individuals were more prone to making errors, and whether this relationship varied with age.
Variability was assessed using simple and choice reaction time, while errors of omission (misses) and commission (false alarms) were obtained from simple and complex visual search tasks. Data from 557 participants aged 18-90 years were included in the analysis.
Greater variability was associated with more misses and distribution analyses showed that slower responses were behind this effect. Variability was also associated with false alarms,
but the pattern was inconsistent. Taking age into account revealed that the association between variability and misses in the simple visual search condition was stronger in older (aged 65-90 years) participants. The results suggest the relationship between greater
variability and errors of omission (misses) may be related to inattention. Measures of variability may therefore provide valuable insights into individual differences in error rates
and more broadly, may also offer early warning of persons who are more prone to errors in visual search.
Keywords: Ageing, reaction time, attention, within-person variability, errors
Does within-person variability predict errors in healthy adults aged 18-90?
In safety-critical situations such as driving, visual processing errors can potentially
have dangerous consequences. It is therefore important to identify factors that increase the likelihood of making such errors. Here, we focus on within-person reaction time (RT)
variability, a measure that has received considerable interest in the cognitive ageing literature.
Our main question was whether more variable individuals are more prone to making errors. Although there are a variety of taxonomies that have been used to classify errors (e.g., Miller
& Swain, 1987; Norman, 1981; Reason, 1990), for present purposes we make the distinction
between misses (omission errors) and false alarms (commission errors). Omission errors are
the failure to carry out an intended action, whereas commission errors occur when an action is performed that should not have been.
Within-person RT variability refers to the trial-by-trial fluctuations in responses for a
given cognitive task. Often, this has been thought of as methodological error variance and ignored by using measures of central tendency such as the mean or median RT collapsed
across trials. However, there is evidence that within-person variability provides meaningful information about either individual differences or task engagement (e.g., Hultsch, Strauss, Hunter, & MacDonald, 2008). One proposal is that increased variability may reflect
fluctuations in attentional or executive control (Bunce, MacDonald, & Hultsch, 2004; Bunce, Warr, & Cochrane, 1993; West, Murphy, Armilio, Craik, & Stuss, 2002). Here, the extent to
which attentional or executive processes are focused is reflected in RTs of differing duration with more consistent responding indicating greater focus. Across individuals, variability typically increases with age (Bielak, Cherbuin, Bunce, & Anstey, 2014; West et al., 2002),
even when controlling for age-related slowing (Dykiert, Der, Starr, & Deary, 2012). Also, it has been proposed that RT variability is a behavioural marker of neurobiological disturbance (Hultsch et al., 2008) and consistent with this view, elevated variability has been shown to
accompany neuropathology such as mild cognitive impairment or dementia (e.g., Dixon et al., 2007; Duchek et al., 2009), Parkinson’s disease (de Frias, Dixon, Fisher, & Camicioli,
2007), and traumatic brain injury (Stuss, Murphy, Binns, & Alexander, 2003). Our interest in the measure in the present study stems from previous research suggesting that within-person variability in laboratory tasks is linked to real-world
functioning (Bunce, Young, Blane, & Khugputh, 2012; Burton, Strauss, Hultsch, & Hunter, 2009; Kennedy et al., 2013). Although few studies have investigated the association between
variability and visual search performance, Biggs and colleagues showed that search time
variability predicted search accuracy (Biggs, Cain, Clark, Darling, & Mitroff, 2013; Biggs &
Mitroff, 2014). Other research has focused on the link between variability and errors in other contexts such as sustained attention (e.g., Gu, Gau, Tzang, & Hsu, 2013). Here, increased variability was linked with misses and false alarms, though notably, misses were specifically
associated with slower RTs whereas false alarms were associated with faster responses. However, as this study was limited to adolescents, it is unclear whether such relationships
hold across adult age ranges.
There is also evidence that the relationship between within-person variability and errors may vary as a function of age. In older adults, increased variability has been associated
with poorer memory performance (MacDonald, Nyberg, Sandblom, Fischer, & Backman, 2008) and forgetting rates over a one-week period (Papenberg et al., 2011). Across old and
young however, increased variability was moderately associated with poorer memory in older adults, but in younger adults, the opposite was found (Vandermorris, Murphy, & Troyer, 2013). In addition, RT variability was not associated with prospective memory accuracy in
younger adults although faster responses were related to more prospective memory misses (Loft, Bowden, Ball, & Brewer, 2014).
The present study investigated within-person variability on basic psychomotor tasks
that use relatively straightforward information processing. Hultsch and colleagues (2008) suggest such tasks capture fundamental central nervous system functioning. Our main
research question was whether variability on these lower-order tasks was predictive of errors (misses and false alarms) on higher-order cognitive tasks. This issue was examined in a sample of 557 participants where visual search errors (referred to as “errors”) were recorded
from simple and complex visual search tasks. Such laboratory tasks require processes that are important in everyday activities and may therefore provide valuable insights into everyday
visual functioning. Given previous work, we expected to see an association between
variability on the psychomotor tasks and errors on the visual search tasks. RT variability has
been linked to fluctuating attentional or executive control mechanisms, and it is likely that errors such as misses are related to attentional lapses (see Reason, 1990). Due to this shared theoretical association with attention, an association with increased variability was
particularly expected for misses.
We were also interested in the relationship between errors and faster and slower
responding. As attentional fluctuations may lead to intermittently slower RTs, we anticipated that slower responses would be associated with misses. In contrast, we expected faster responses would be associated with false alarms, as these errors may reflect more impulsive
responding. Additionally, based on previous research (e.g., Vandermorris et al., 2013), and evidence that variability increases with age (Bielak et al., 2014; Dykiert et al., 2012), we
expected associations between variability and errors to strengthen with age. Finally, we anticipated a stronger relationship between variability and errors for the complex visual search task, as this was more attentionally demanding than the simple version of the task.
Methods
Participants
Data were drawn from two previously published studies (Bauermeister & Bunce, 2015; Bunce, Handley, & Gaines, 2008) to form the current dataset of 557
community-dwelling participants (327 women) aged 18-90 years (M=56.45, SD=17.20). There were 105 younger (18-39 years, 61% women), 249 middle-aged (40-64 years, 63% women), and 203 older adults (65-90 years, 77% women) in the combined sample. There were no significant
differences in the gender distribution across the three age groups. The original studies excluded participants with major neurological disorders that could affect cognitive function.
To minimise inclusion of persons with possible dementia, older participants were also
excluded if they scored <25 on the Mini-Mental State Examination (Folstein, Folstein, &
Mchugh, 1975). The National Adult Reading Test (NART: Nelson, 1982) was used to assess verbal intelligence, with error scores converted to full scale IQ scores using standard
procedures (M=119.12, SD=7.38). Ethics approval was obtained from the School of Social
Sciences Research Ethics Committee, Brunel University London. Materials
The cognitive tasks were embedded within a broader battery, details of which have been previously reported (Bauermeister & Bunce, 2015; Bunce et al., 2008). Task and condition order were counterbalanced across participants.
Visual search tasks. Errors were taken from simple and complex visual search tasks
in which 16 practice trials and 64 test trials were administered for each task. Simple visual
search: On each trial, participants were presented with a 6 x 6 array of green letter ‘O’s
(stimulus size 0.6 x 0.8 cm) presented in a 5 cm by 8 cm grid. On half of the trials a target (a green letter ‘Q’; 0.6 x 1.0 cm including tail) was embedded pseudorandomly within the array.
Participants were instructed to respond with designated keyboard keys according to whether the target was present or absent. Complex visual search: Participants were presented with an array of ‘O’s and ‘Q’s of differing colours and had to respond according to whether a target
was present or absent. Targets were defined by the conjunction of the colour and letter (e.g., a green letter ‘Q’ in an array of red ‘Q’s and green ‘O’s). For both visual search tasks, each
array remained on the screen until a response was made, or to a maximum of 10,000 ms (inter-trial interval 500 ms). Participants were instructed to respond as quickly and as accurately as possible, and were allowed to move their eyes throughout the task. Prior to
computing error measures, unusually fast (RTs <150ms) trials were removed, (<0.1% of trials) as these are likely to represent accidental key presses. For both visual search tasks, the
proportion of misses (where a target was present but a target absent response was made) and
false alarms (where a target was absent but a target present response was made) were
recorded. On the complex visual search task, mean false alarm rates were 1.41%, however, six participants produced false alarm rates greater than 25%. Removal of these participants did not substantially change any of the results reported below. However, to ensure these
outlying participants did not unduly influence analyses, this variable was log transformed. Psychomotor tasks (within person variability measures). Three 48-trial
psychomotor tasks were administered. Before each task, participants completed eight (SRT) or 12 (CRT) practice trials. Simple RT (SRT): In this task a stimulus (the letter ‘X’) was presented in the middle of the computer screen following a randomly determined inter-trial
interval (300-1000 ms). Participants were instructed to press the spacebar as fast as possible when the stimulus appeared. Two-Choice RT (2CRT): The stimulus (a black circle, 25mm
diameter) was randomly presented on either the left or right side of the computer screen (inter-trial interval 500ms). Participants were instructed to respond with designated keyboard keys (X and M) according to the side on which the stimulus appeared. Four-Choice RT
(4CRT): The stimulus (a black circle) was presented in one of the four corners of the screen
(inter-trial interval 500 ms) and participants responded using four keyboard keys (S, X, M and K) that mapped spatially onto the locations on the computer screen. For both choice RT
tasks, instructions emphasised speed and accuracy. Data processing
Prior to computing the within-person variability and distribution measures, we removed unusually fast (<150ms) or slow (3 SD beyond the intraindividual mean-RT) responses and error trials on the CRT tasks. Eliminated trials were replaced with the
intraindividual mean-RT for that task. For all tasks, <5% of trials were replaced across the full sample. On the 4CRT task, data from two older participants were removed as the
trimming procedure replaced more than 45% of trials, which would result in artificially low
variability measures. Seven further participants (n=5 aged 65-90 and n=2 aged 40-64 years)
were removed for having a high proportion of extreme RTs (>3000 ms) remaining after data trimming. These cases were treated as missing data.
The coefficient of variation (CV: raw individual SD/raw mean-RT) was used as a
within-person variability metric as this measure takes mean level of performance into account. Additionally, we used Vincentile analysis to assess the relationship between an
individual’s faster and slower responses and errors. To obtain six Vincentiles, intraindividual RTs were rank ordered from fastest to slowest. The first 1/6 of trials (in our case the fastest eight) were averaged to form Vincentile-1, then the next 1/6 were averaged to form
Vincentile-2, and so on. We were interested in whether errors were associated with
intermittently slower RTs (indexed by an individual’s slower responses only, i.e.,
6) or response speed in general (indexed by both faster and slower responses, i.e., Vincentile-1 and Vincentile-6).
Results
At the aggregate sample level, a small amount of missing data (<0.7%) was imputed using the EM algorithm in IBM SPSS version 21 taking all study variables into consideration (Schafer & Graham, 2002). This procedure uses an iterative process to impute missing data
using estimates of the means, covariances, and correlations obtained from other observed data.
The mean values for the RT variability and error measures are displayed in Table 1 together with the bivariate correlations between variables. All variability measures were positively associated with age, which was also positively associated with misses on the
complex visual search task, but not the simple visual search task. In contrast, age was negatively associated with false alarms on the simple visual search task, but the association
with complex visual search task was nonsignificant. Regarding correlations between
variability and errors, greater variability was associated with a higher percentage of misses on
both visual search tasks. For false alarm errors, there was a less consistent pattern. SRT variability correlated with errors on the simple visual search task, while CRT variability correlated with complex visual search errors. Associations however, were small.
(Table 1 about here)
Misses (errors of omission)
A series of hierarchical linear regression analyses were run with percentage of errors
as the outcome variable. In Model 1, we adjusted for sex and NART scores at Step 1, and in Step 2 each RT measure was added in turn, to see whether this accounted for variance in each
error type. To adjust for multiple analyses for each outcome, we adopted a conservative alpha of 1%. There were significant relationships between variability and misses for both visual search tasks (see Table 2). In Model 2 after additionally adjusting for age, variability
remained a significant predictor of misses, though R2 values were somewhat attenuated for complex visual search. For example, after controlling for IQ and sex, adding SRT CV explained 6.2% of the shared variance, but only 3.8% after additionally taking age into
account. To explore the age effects further, associations between variability and misses were assessed separately in younger, middle-aged, and older participants. As similar results were
obtained for the three RT tasks and they were significantly intercorrelated (r≥.24, p<.001), a composite measure was computed in these analyses. Figures 1a and 1b show the relationship between the CV-composite and misses in the age subgroups. Here estimates were obtained
from linear regression using a continuous CV variable, but have been plotted with high and low CV defined as ±1 SD from the overall sample mean. On the simple visual search task, the
strength of the relationship increased with age (younger, =.10, p=.297; middle-aged, =.20,
p=.001; older, =.34, p<.001). These regression coefficients were compared by rerunning the
initial model with the addition of age group (older participants as the reference group) and a multiplicative Age group x CV-composite interaction term. The interaction was significant for the comparison between the older participants and the younger ( =-.10, p=.035), and
middle-aged ( =-.12, p=.033) groups. For complex visual search, although older participants made more errors both at low variability and high variability, within all groups greater
variability was associated with more errors (younger, =.22, p=.024; middle-aged, =.21, p=.001; older, =.28, p<.001: between-group differences were non-significant).
(Figure 1 and Table 2 about here)
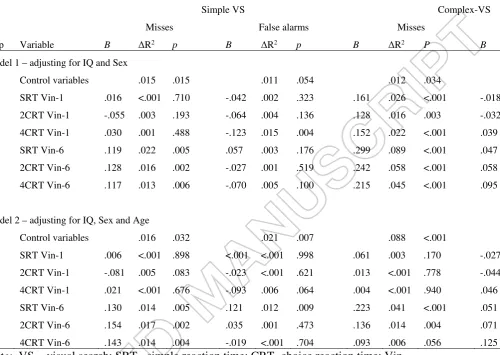
To further understand the relationship between variability and misses, models were also run regressing errors onto faster (Vincentile-1) and slower (Vincentile-6) responses. This assessed whether errors were associated with intermittently slower RTs or a general slowing
of responses. The results for these hierarchical regression models are displayed in Table 3. After adjusting for IQ and sex (Model 1), faster responses were not related to misses on the simple visual search task, but did show a significant relationship with complex visual search
misses (all ps ≤.003). When age was controlled for (Model 2), this significant relationship was rendered nonsignificant (ps ≥.170). Similarly, there were no significant associations
between faster responses and misses within any of the three age subgroups ( ≤.11, p≥.122). In contrast, slower responses were associated with misses for both tasks (all ps ≤.006, see top panel of Table 3). Controlling for age (Model 2), did not affect the relationship between
slower responses and simple visual search misses (all ps ≤.005), but the association with complex visual search misses was attenuated, particularly for the 4CRT task. A final analysis
investigated the association between slower responses and errors when also adjusting for
faster responses. This controlled for a general slowing of responses, which would affect both
the faster and slower responses of an individual. This strengthened all relationships between slower responses and errors suggesting that it was slower responses relative to faster
responses that were associated with misses rather than a general slowing of responses. As can
be seen in Table 3, -values for the association between slower responses and misses ranged from .10 to .30. When also controlling for faster responses, -values increased in both Model
1 (simple visual search, ≥.20, p<.001; complex visual search, ≥.32, p<.001) and Model 2 (simple visual search, ≥.21, p<.001; complex visual search, ≥.24, p<.001). Further
investigation splitting the sample by age group, revealed comparable results to those obtained
using the CV-composite measure (figures not shown).
(Table 3 about here)
It is possible that differences in episodic memory underlie the reported effects, as poorer memory in older adults could lead to occasional long RTs and misses in the visual
search task. We therefore reran the models controlling for episodic memory performance (measured using a word recognition memory task used in the original studies: Bauermeister & Bunce, 2015; Bunce et al., 2008). This did not influence the reported results.
False alarms (errors of commission)
Consistent with the bivariate correlations described earlier, regression analyses
showed SRT variability was related to false alarms on the simple visual search task whereas CRT variability was related to false alarms on the complex visual search task (Table 2). Controlling for age (Model 2), did not influence these associations. However, as one of our
hypotheses was that the relationship would vary with age, associations between the CV-composite measure and false alarms were assessed separately within the younger,
middle-aged, and older participants (see Figures 1c and 1d). On both visual search tasks, the
association between variability and errors was significant in the older participants (simple
visual search, =.27, p<.001; complex visual search, =.21, p=.003) but nonsignificant in the middle-aged group. Contrary to expectations, in the younger group, variability was associated with errors on the complex search task ( =.22, p=.023). However, further inspection revealed
one younger participant was an outlying case and excluding this participant removed this significant result ( =.12, p=.213). For both tasks the Age group x CV-composite was
significant for the comparison between the older and middle-aged groups (simple visual search, =-.15, p=.008; complex visual search, =-.14, p=.019) but was non-significant for the comparison between the older and younger participants (p≥.324)
The relationship between false alarms and the distribution measures was also assessed and results can be found in Table 3. In Model 1, faster responses (Vincentile-1) for the 4CRT
task were negatively associated with simple visual search false alarms. All other associations were nonsignificant. In Model 2, controlling for age, the relationship between 4CRT faster responses and simple visual search errors was eliminated. When split by age group, the
relationship between faster responses and simple visual search false alarms was
nonsignificant in all three groups ( ranged from -.02 to -.10, p=.335). The results for slower responses were similar to those obtained using the CV; in the age group analysis, there was a
significant association between slower responses and complex visual search errors in the older participants but not in the other groups.
(Figure 1 about here) Discussion
To our knowledge, this the first study to investigate the relationship between
within-person variability on basic psychomotor tasks and errors on a higher-order cognitive task across a wide age range. Greater variability was associated with an increased percentage of
misses (omission errors), a finding that was independent of task complexity as relations were
similar across both task conditions. Controlling for age attenuated the relationship between
variability and misses for the complex visual search task, but did not eliminate it.
Importantly, although the association strengthened with age, variability was significantly related to misses across all age groups. Greater variability was also associated with false
alarms (commission errors), although somewhat inconsistently. When split by age group, this association was only significant in the older participants.
The findings support previous research showing a positive association between RT variability and misses (Gu et al., 2013), but extends this finding from adolescents to the broader adult age range. RT variability is thought to reflect fluctuations in attentional or
executive control mechanisms (Bunce et al., 2004; Bunce et al., 1993; West et al., 2002) and failures of attention may lead to lapse errors (Reason, 1990) such as the failure to detect a
target (i.e., a miss). The relationship between greater variability and misses may therefore be related to inattention. The results from the distribution analyses supported this view, as it was slower responses that were consistently associated with misses. If attentional variation leads
to more intermittently slower RTs, these would be captured by the slower Vincentile.
Controlling for faster responses (Vincentile-1) strengthened this relationship, suggesting that it was specifically the slower RTs that accounted for the misses and not response speed shifts
across the entire distribution (as captured by Vincentile-1).
A further aim was to see whether the relationship between variability and errors was
affected by age. Based on previous research in this area (e.g., Vandermorris et al., 2013) and predictions arising from the dedifferentiation hypothesis (Baltes, Cornelius, Spiro,
Nesselroade, & Willis, 1980; Hulur, Ram, Willis, Schaie, & Gerstorf, 2015) where cognitive
performance in different domains is commonly found to converge onto a single factor, we anticipated that the relationship between variability and errors would strengthen with age.
This possibility was, therefore, assessed separately in the younger, middle-aged and older
participants. Consistent with earlier work and this hypothesis, the expectation was confirmed,
as a stronger association between variability and misses on the simple visual search task was found for the older relative to younger participants. It may be that due to age-related
reductions in attentional resources, more variable older individuals are particularly vulnerable
to making errors of omission (i.e., misses). However, for the more attentionally demanding complex visual search task, greater variability was associated with increased misses in all
three age groups. The findings for the younger group contrast with earlier work in which younger adults’ increased variability was associated with fewer errors (Vandermorris et al., 2013). However, this may be due to that earlier study using an outcome measure that
combined misses and false alarms. It is possible, therefore, that collapsing the error type masked the effects for misses.
Consistent with previous research (e.g., Gu et al., 2013), false alarms showed a positive association with variability and a negative association with faster responses (Vincentile-1). Both findings, however, were inconsistent, and relationships were only
evident for certain task conditions. For example, SRT variability was related to simple visual search false alarms, whilst CRT variability was associated with complex visual search errors. Moreover, when analyses were conducted by age group, the association between variability
and false alarms was only significant for the older adults, supporting the notion that
variability-error relations strengthen with age. In contrast, controlling for age eliminated the
association for faster responses. This would suggest that the relationship in the full sample was related to older adults’ slowing of responses and concurrently making fewer false alarms.
The present findings have important broader implications for everyday behaviours as
they suggest that individuals who are more variable may also be more prone to making errors, particularly those of omission (i.e., misses). Research in older adults suggests that greater
variability is associated with motor problems such as gait difficulties and falls (for review,
see Graveson, Bauermeister, McKeown, & Bunce, 2015), and is related to simulated driving
(Bunce et al., 2012) or flight (Kennedy et al., 2013) performance. Given the association identified here suggesting a relationship between greater variability and visual search errors, a key question for future research is whether increased variability in laboratory tasks
translates into errors in other contexts or in real world situations. Examples where greater within-person variability may be associated with errors include prospective memory failures
(e.g., forgetting medications) and errors in safety-critical situations (e.g., driving, medical fields or industrial processes). It is important that future research is extended to these contexts to provide information on the neurocognitive mechanisms supporting everyday performance,
and help identify potentially vulnerable older persons for possible intervention. For example, more variable older individuals may benefit from cognitive remediation interventions that
enhance attentional focus or improve mobility (e.g., Verghese, Mahoney, Ambrose, Wang, & Holtzer, 2010). An interesting question is whether such approaches would also reduce errors in everyday tasks.
A strength of the present study was the large sample size that allowed us to
investigate the association between variability and errors across age groups in some detail. There were, however, some limitations that we should acknowledge. First, error rates,
particularly false alarms, were very low. This may have impacted on our ability to detect relationships, and may explain the inconsistency in the false alarm data. It may be that a more
complex visual search task (e.g., medical or baggage screening) that produces higher false alarm rates, would better determine the relationship between RT variability and false alarms. Second, as there were relatively few practice trials for the RT tasks, some of the variability in
RTs may have been due to practice effects, with those who take longer to learn (e.g., older adults) having larger CVs. Future work using tasks with a greater number of trials would
allow greater understanding of whether relationships persist once RT performance has
stabilised. Third, although the analyses controlled for extraneous variables that can influence
RT performance such as IQ and sex, there are other factors that may have influenced the relationship between variability and errors. These include motivation, fatigue, and various personality traits. It is clearly important that future research take these into account too.
Finally, as CV and Vincentile-6 were significantly associated, it is possible that the
relationship between misses and Vincentile-6 was due to the latter variable serving as a proxy
for CV. Indeed, in unreported supplementary analyses, when we adjusted for CV in the significant Vincentile-6-misses associations, we found that relations were weakened or became nonsignificant. This suggests that some of the variability that was related to misses
stemmed from responses that fell into the tail of the RT distribution.
In conclusion, the present study identified a clear link between variability on
lower-order psychomotor tasks and errors on a higher-lower-order cognitive task. These basic
psychomotor tasks are thought to capture fundamental central nervous system functioning (Hultsch et al., 2008), while the visual search tasks require higher-order processes that are
important for everyday functioning. In making a distinction between omission errors (misses) and commission errors (false alarms), greater variability was consistently associated with increased omission errors, a relationship that may stem from fluctuations in attentional
control. The relationship with commission errors was less consistent, but false alarm rates were low, and future research using tasks that elicit a greater number of errors is warranted to
allow better understanding the relationship with variability. Across both error types, the association with variability strengthened with age, suggesting that more variable older adults are particularly prone to making errors. Variability measures may therefore have some
potential in helping to identify older persons who are more vulnerable to everyday errors of both commission and omission.
References
Baltes, P. B., Cornelius, S. W., Spiro, A., Nesselroade, J. R., & Willis, S. L. (1980).
Integration Versus Differentiation of Fluid-Crystallized Intelligence in Old-Age. Dev Psychol, 16(6), 625-635. doi: Doi 10.1037/0012-1649.16.6.625
Bauermeister, S., & Bunce, D. (2015). Poorer mental health is associated with cognitive deficits in old age. Aging Neuropsychology and Cognition, 22(1), 95-105. doi:
10.1080/13825585.2014.893554
Bielak, A. A., Cherbuin, N., Bunce, D., & Anstey, K. J. (2014). Intraindividual variability is a fundamental phenomenon of aging: evidence from an 8-year longitudinal study across
young, middle, and older adulthood. Dev Psychol, 50(1), 143-151. doi: 10.1037/a0032650
Biggs, A. T., Cain, M. S., Clark, K., Darling, E. F., & Mitroff, S. R. (2013). Assessing visual search performance differences between Transportation Security Administration Officers and nonprofessional visual searchers. Visual Cognition, 21(3), 330-352. doi:
10.1080/13506285.2013.790329
Biggs, A. T., & Mitroff, S. R. (2014). Different predictors of multiple-target search accuracy between nonprofessional and professional visual searchers. Quarterly Journal of
Experimental Psychology, 67(7), 1335-1348. doi: 10.1080/17470218.2013.859715
Bunce, D., Handley, R., & Gaines, S. O. (2008). Depression, Anxiety, and Within-Person
Variability in Adults Aged 18 to 85 Years. Psychology and Aging, 23(4), 848-858. doi: 10.1037/A0013678
Bunce, D., MacDonald, S. W. S., & Hultsch, D. F. (2004). Inconsistency in serial choice
decision and motor reaction times dissociate in younger and older adults. Brain and Cognition, 56(3), 320-327. doi: 10.1016/j.bandc.2004.08.006
Bunce, D., Warr, P. B., & Cochrane, T. (1993). Blocks in Choice Responding as a Function
of Age and Physical-Fitness. Psychology and Aging, 8(1), 26-33. doi: 10.1037/0882-7974.8.1.26
Bunce, D., Young, M. S., Blane, A., & Khugputh, P. (2012). Age and inconsistency in
driving performance. Accident Analysis and Prevention, 49, 293-299. doi: 10.1016/j.aap.2012.01.001
Burton, C. L., Strauss, E., Hultsch, D. F., & Hunter, M. A. (2009). The Relationship between Everyday Problem Solving and Inconsistency in Reaction Time in Older Adults. Aging Neuropsychology and Cognition, 16(5), 607-632. doi:
10.1080/13825580903167283
de Frias, C. M., Dixon, R. A., Fisher, N., & Camicioli, R. (2007). Intraindividual variability
in neurocognitive speed: A comparison of Parkinson's disease and normal older adults. Neuropsychologia, 45(11), 2499-2507. doi:
10.1016/j.neuropsychologia.2007.03.022
Dixon, R. A., Lentz, T. L., Garrett, D. D., MacDonald, S. W. S., Strauss, E., & Hultsch, D. F. (2007). Neurocognitive markers of cognitive impairment: Exploring the roles of speed and inconsistency. Neuropsychology, 21(3), 381-399. doi:
10.1037/0894-4105.21.3.381
Duchek, J. M., Balota, D. A., Tse, C. S., Holtzman, D. M., Fagan, A. M., & Goate, A. M.
(2009). The Utility of Intraindividual Variability in Selective Attention Tasks as an Early Marker for Alzheimer's Disease. Neuropsychology, 23(6), 746-758. doi: 10.1037/A0016583
Dykiert, D., Der, G., Starr, J. M., & Deary, I. J. (2012). Age Differences in Intra-Individual
Variability in Simple and Choice Reaction Time: Systematic Review and Meta-Analysis. Plos One, 7(10). doi: 10.1371/journal.pone.0045759
Folstein, M. F., Folstein, S. E., & Mchugh, P. R. (1975). Mini-Mental State - Practical
Method for Grading Cognitive State of Patients for Clinician. Journal of Psychiatric Research, 12(3), 189-198. doi: 10.1016/0022-3956(75)90026-6
Graveson, J., Bauermeister, S., McKeown, D., & Bunce, D. (2015). Intraindividual reaction time varaibility, falls and gait in old age: A systematic review. Journals of
Gerontology Series B-Psychological Sciences and Social Sciences. doi:
10.1093/geronb/gbv027
Gu, S. L. H., Gau, S. S. F., Tzang, S. W., & Hsu, W. Y. (2013). The ex-Gaussian distribution
of reaction times in adolescents with attention-deficit/hyperactivity disorder. Research in Developmental Disabilities, 34(11), 3709-3719. doi: 10.1016/j.ridd.2013.07.025
Hultsch, D. F., Strauss, E., Hunter, M. A., & MacDonald, S. W. S. (2008). Intraindividual
variability, cognition and aging. In F. I. M. Craik & T. A. Salthouse (Eds.), The handbook of aging and cognition (3rd ed., pp. 491-556). New York: Psychology
Press.
Hulur, G., Ram, N., Willis, S. L., Schaie, K. W., & Gerstorf, D. (2015). Cognitive Dedifferentiation With Increasing Age and Proximity of Death: Within-Person
Evidence From the Seattle Longitudinal Study. Psychology and Aging, 30(2), 311-323. doi: 10.1037/a0039260
Kennedy, Q., Taylor, J., Heraldez, D., Noda, A., Lazzeroni, L. C., & Yesavage, J. (2013).
Intraindividual Variability in Basic Reaction Time Predicts Middle-Aged and Older
Pilots Flight Simulator Performance. Journals of Gerontology Series B-Psychological
Sciences and Social Sciences, 68(4), 487-494. doi: 10.1093/geronb/gbs090
Loft, S., Bowden, V. K., Ball, B. H., & Brewer, G. A. (2014). Fitting an ex-Gaussian function to examine costs in event-based prospective memory: Evidence for a continuous
monitoring profile. Acta Psychologica, 152, 177-182. doi: 10.1016/j.actpsy.2014.08.010
MacDonald, S. W. S., Nyberg, L., Sandblom, J., Fischer, H., & Backman, L. (2008). Increased response-time variability is associated with reduced inferior parietal activation during episodic recognition in aging. Journal of Cognitive Neuroscience,
20(5), 779-786. doi: 10.1162/jocn.2008.20502
Miller, D. P., & Swain, A. D. (1987). Human error and human reliability. In G. Salvendy
(Ed.), Handbook of human factors. New York: John Wiley & Sons Inc.
Nelson, H. E. (1982). The National Adult Reading Test (NART). Windsor: NFER-Nelson.
Norman, D. A. (1981). Categorization of Action Slips. Psychological Review, 88(1), 1-15.
doi: Doi 10.1037/0033-295x.88.1.1
Papenberg, G., Backman, L., Chicherio, C., Nagel, I. E., Heekeren, H. R., Lindenberger, U., & Li, S. C. (2011). Higher intraindividual variability is associated with more
forgetting and dedifferentiated memory functions in old age. Neuropsychologia, 49(7), 1879-1888. doi: 10.1016/j.neuropsychologia.2011.03.013
Reason, J. (1990). Human error. Cambridge: Cambridge University Press.
Schafer, J. L., & Graham, J. W. (2002). Missing data: our view of the state of the art. Psychol Methods, 7(2), 147-177.
Stuss, D. T., Murphy, K. J., Binns, M. A., & Alexander, M. P. (2003). Staying on the job: the
frontal lobes control individual performance variability. Brain, 126, 2363-2380. doi: 10.1093/Brain/Awg237
Vandermorris, S., Murphy, K. J., & Troyer, A. K. (2013). Age-related elevations in
intraindividual variability on associative memory tasks. Aging Neuropsychology and Cognition, 20(6), 722-734. doi: 10.1080/13825585.2013.772557
Verghese, J., Mahoney, J., Ambrose, A. F., Wang, C. L., & Holtzer, R. (2010). Effect of Cognitive Remediation on Gait in Sedentary Seniors. Journals of Gerontology Series a-Biological Sciences and Medical Sciences, 65(12), 1338-1343. doi: DOI
10.1093/gerona/glq127
West, R., Murphy, K. J., Armilio, M. L., Craik, F. I. M., & Stuss, D. T. (2002). Lapses of
intention and performance variability reveal age-related increases in fluctuations of executive control. Brain and Cognition, 49(3), 402-419. doi: 10.1006/brcg.2001.1507
Figure Captions
Figure 1:
The relationship between CV-composite score and errors in younger, middle-aged and older
adults.
Table 1:
Bivariate correlations between age, reaction time and error variables.
Variable Mean (SD) 1. 2. 3. 4. 5. 6. 7. 8. 9. 10.
1. Age 56.45 (17.19) -
2. SRT CV 0.22 (0.09) .20** -
3. SRT Vin-1 230.76 (42.52) .39** .02 -
4. SRT Vin-6 424.67 (133.77) .40** .69** .68** -
5. 2CRT CV 0.19 (0.07) .18** .30** .01 .24** -
6. 2CRT Vin-1 260.55 (60.91) .43** .10* .53** .42** -.13** -
7. 2CRT Vin-6 441.42 (119.34) .50** .29** .47** .55** .47** .79** -
8. 4CRT CV 0.21 (0.07) .22** .24** .06 .21** .34** -.01 .22** -
9. 4CRT Vin-1 393.34 (119.25) .53** .16** .45** .42** .14** .64** .67** .08 -
10. 4CRT Vin-6 715.68 (216.20) .53** .25** .38** .45** .30** .50** .66** .55** .85** -
11. Simple-VS miss 1.98% (2.97) -.01 .14** .01 .11** .25** -.07 .12** .16** .02 .11**
12. Simple-VS FA 0.80% (1.81) -.13** .12** -.05 .05 .05 -.07 -.03 .06 -.13** -.07
13. Complex-VS miss 18.44% (15.62) .25** .25** .15** .29** .22** .13** .25** .18** .16** .22**
14. Complex-VS FA 0.18 (0.33)a -.02 .05 -.03 .04 .13** -.03 .06 .11* .04 .10*
Note. SRT= simple reaction time; CRT=choice reaction time; CV=coefficient of variation;
Vin-1=Vincentile-1 (average of 8 fastest responses); Vin-6=Vincentile-6 (average of 8 slowest responses); VS= visual search. a Descriptive statistics for log transformed variable. Sample size = 557. *p<.05; ** p<.01.
Table 2
Hierarchical regression: Errors regressed on variability metrics (CV)
Simple-VS Complex-VS
Misses False alarms Misses F
Step Variable B R2 p B R2 P B R2 p B
Model 1 – adjusting for IQ and Sex
1 Control variables .015 .015 .011 .057 .012 .038
2a SRT CV .137 .019 .001 .116 .014 .006 .248 .062 <.001 .050
2b 2CRT CV .251 .063 <.001 .049 .002 .248 .220 .048 <.001 .128
2c 4CRT CV .159 .025 <.001 .060 .004 .157 .183 .033 <.001 .112
Model 2 – adjusting for IQ, Sex and Age
1 Control variables .016 .033 .021 .008 .088 <.001
2a SRT CV .137 .018 .001 .145 .020 .001 .199 .038 <.001 .050
2b 2CRT CV .255 .062 <.001 .072 .005 .093 .173 .029 <.001 .131
2c 4CRT CV .161 .024 <.001 .088 .007 .041 .127 .015 .002 .115
Note: VS = visual search; SRT= simple reaction time; CRT=choice reaction time;
CV=coefficient of variation
Table 3
Hierarchical regression: Errors regressed on distribution parameters.
Simple VS Complex-VS
Misses False alarms Misses F
Step Variable B R2 p B R2 p B R2 P B
Model 1 – adjusting for IQ and Sex
1 Control variables .015 .015 .011 .054 .012 .034
2a SRT Vin-1 .016 <.001 .710 -.042 .002 .323 .161 .026 <.001 -.018
2b 2CRT Vin-1 -.055 .003 .193 -.064 .004 .136 .128 .016 .003 -.032
2c 4CRT Vin-1 .030 .001 .488 -.123 .015 .004 .152 .022 <.001 .039
2d SRT Vin-6 .119 .022 .005 .057 .003 .176 .299 .089 <.001 .047
2e 2CRT Vin-6 .128 .016 .002 -.027 .001 .519 .242 .058 <.001 .058
2f 4CRT Vin-6 .117 .013 .006 -.070 .005 .100 .215 .045 <.001 .095
Model 2 – adjusting for IQ, Sex and Age
1 Control variables .016 .032 .021 .007 .088 <.001
2a SRT Vin-1 .006 <.001 .898 <.001 <.001 .998 .061 .003 .170 -.027
2b 2CRT Vin-1 -.081 .005 .083 -.023 <.001 .621 .013 <.001 .778 -.044
2c 4CRT Vin-1 .021 <.001 .676 -.093 .006 .064 .004 <.001 .940 .046
2d SRT Vin-6 .130 .014 .005 .121 .012 .009 .223 .041 <.001 .051
2e 2CRT Vin-6 .154 .017 .002 .035 .001 .473 .136 .014 .004 .071
2f 4CRT Vin-6 .143 .014 .004 -.019 <.001 .704 .093 .006 .056 .125
Note: VS = visual search; SRT= simple reaction time; CRT=choice reaction time;
Vin-1=Vincentile-1 (average of 8 fastest responses); Vin-6=Vincentile-6 (average of 8 slowest responses).
RT VARIABILITY AND ERR
O
RS