This is a repository copy of Gas Phase Train in Upstream Oil & Gas Fields: PART-I Model
Development .
White Rose Research Online URL for this paper:
http://eprints.whiterose.ac.uk/109286/
Version: Accepted Version
Proceedings Paper:
Al-Naumani, Y.H., Rossiter, J.A. orcid.org/0000-0002-1336-0633 and Al-Bahlawi, S. (2016)
Gas Phase Train in Upstream Oil & Gas Fields: PART-I Model Development. In:
IFAC-PapersOnLine. 11th IFAC Symposium on Dynamics and Control of Process
SystemsIncluding Biosystems DYCOPS-CAB 2016, 06-08 Jun 2016, Trondheim, Norway.
Elsevier , pp. 875-881.
https://doi.org/10.1016/j.ifacol.2016.07.300
[email protected] https://eprints.whiterose.ac.uk/
Reuse
This article is distributed under the terms of the Creative Commons Attribution-NonCommercial-NoDerivs (CC BY-NC-ND) licence. This licence only allows you to download this work and share it with others as long as you credit the authors, but you can’t change the article in any way or use it commercially. More
information and the full terms of the licence here: https://creativecommons.org/licenses/
Takedown
If you consider content in White Rose Research Online to be in breach of UK law, please notify us by
A Process Model Representing Gas Phase
Train in Upstream Oil & Gas Fields:
PART-I
Y. H. Al-Naumani∗,∗∗ J. A. Rossiter∗∗ S. J. Bahlawi∗∗∗
∗Quality Measuring Instruments and Metering Supervisor
-OSGOH432, Petroleum Development Oman LLC, P.O.Box 81, Postal code 100, Muscat, Sultanate of Oman ([email protected])
∗∗Department of Automatic Control and Systems Engineering
University of Sheffield. Sheffield S1,3JD UK
([email protected]) ([email protected])
∗∗∗Harweel Production Support Coordinator - OSGOH2, Petroleum
Development Oman LLC, P.O.Box 81, Postal code 100, Muscat, Sultanate of Oman ([email protected])
Abstract:The prime contribution of this paper is to provide a large scale system (LSS) model
for the gas phase operation in upstream oil and gas plants. The process model consists of the three main gas conditioning processes which exist in most upstream oil and gas gathering stations; these are gas sweetening, gas dehydration, and hydrocarbon dew-pointing. The function of such a model is to provide a realistic process representation in order to test and verify different process control approaches, specifically those control themes which deal with highly interactive control loops.
Keywords:Process Model; Process Control; Upstream Oil & Gas
1. INTRODUCTION
Process models representing upstream oil & gas processes are scarce in the literature. The majority of the process models available in the literature represent single chem-ical processes. In order to investigate different control structures and proposals it is necessary to have a suitable benchmark model and/or scenario reflecting realistic up-stream oil & gas operations. Such a model would not only be of benefit to studies on upstream oil & gas processes, but also to Large Scale Systems (LSS) in general and control research on how to deal with system interaction as well.
The scarcity of process models in the literature could be due to the fact that most of the upstream process control goals can be achieved sufficiently well by implementing Single Input Single Output (SISO) control strategies. This comment is true to some extent for simple process control operations such as level control of storage tanks and fur-nace temperature control. On the other hand the situation is different with complex oil & gas dynamic processes such as control of fractionation columns, compressor surge control or crude stabiliser column control. These units contain a number of interactive control loops and thus it is often difficult to tune SISO loops to control such processes effectively. Nevertheless in practice these process are often controlled using simple control strategies with one con-sequence being that their performance and stability are sensitive to disturbances and load changes.
⋆ The first author is sponsored by the government of Oman and
supported by Petroleum Development Oman LLC.
Looking to the past, Shell Oil’s heavy oil fractionater model was one of the earliest models presented in the literature to represent a multivariable interactive control process. The distillation column model introduced by Prett and Morari (1987) has three controlled variables and three manipulated variables which are highly interactive with each other. For decades, this model was the base for many studies of different control approaches and strategies for distillation columns control.
A few years later, the first and most famous plant-wide process control problem ’Tennessee Eastman’ (TE) was proposed by Downs and Vogel (1993) as a control challenge test problem. It was based on an actual industrial plant and consists of number of linked chemical process units with multivariable control loops which can be subdivided into four or five interacting subsystems. The TE process characteristics were described by sets of flow sheets and steady-state material balances rather than transfer func-tion models or model equafunc-tions.
signif-icance. The model can be used to develop a specific Model Based Predictive Controller (MBPC) which is expected to significantly reduce the plant shut down occasions due to process disturbances and also to drop down operating cost by properly controlling the disturbance growth in the process, hence reducing energy fluctuations in the process and saves fuel.
The process description is illustrated in section two, while section three presents the plant-wide process model and section four gives some model validation and verification. Section five finishes with conclusions and future work recommendations.
2. PROCESS DESCRIPTION
Natural gas processing trains in upstream gas plants contain processes to purify the raw natural gas extracted from underground oil & gas fields and brought up to the surface by production wells. Raw natural gas typically consists primarily of methane, the lightest hydrocarbon molecule. It also contains significant amounts of ethane and varying amounts of heavier hydrocarbon products like natural gas liquids (NGL) compromising of propane, butane, and pentane and even higher molecular weight hydrocarbons such as crude oil. In addition, the gas contains undesirable impurities, such as liquid or vapour
water, carbon dioxide (CO2), hydrogen sulfide (H2S), and
mercaptans molecules (Baker and Lokhandwala (2008); Kidnay et al. (2011)).
The process model illustrated by Fig. 1, describes the three main processes which are commonly found in the upstream fields; upstream fields are classified as those with high gas to oil ratio (GOR). The processes are Gas Sweetening, Gas Dehydration, and Hydrocarbon Dew Pointing. Table 1, provides a description of the abbreviations used in figure 1.
In line with the strict global regulations to reduce levels of sulphur and carbon dioxide content inside gaseous hy-drocarbons used as fuel, it is necessary to remove sulphur and carbonic dioxide from the gas to meet the specifica-tions on acid gas imposed by safety procedures, transport requirements, and distribution specifications (Ohshiro and Izumi (1999)).
Acronym Description
DPIC Differential Pressure Indicator Control FIC Flow Indicator Control
FCV Flow Control Valve GDU Gas Dehydration Unit GSU Gas Sweetening Unit
HCDP Hydrocarbon Dew Pointing Unit IGV Inlet Guide Vanes
[image:3.595.325.540.67.769.2]LIC Level Indicator Control LCV Level Control Valve PIC Pressure Indicator Control PCV Pressure Control Valve QIC Quality Indicator Control TIC Temperature Indicator Control TCV Temperature Control Valve
Table 1. Process figure key
[image:3.595.65.269.588.751.2]Sour gas produced from the oil and gas wells is sepa-rated from the crude in the production separators and then routed to the Gas Sweetening Unit (GSU) where it is treated to meet the hydrogen sulphide and carbon dioxide export gas specification and in addition the bulk of the mercaptans (RSH) and carbonyl sulphide (COS) contaminants are removed.
The GSU consists of an absorber where the acid gas is removed by a counter current contacting with sulfinol solvent and a regeneration loop where the sulfinol is regenerated via desorption of the acid gas components. The treated gas from the absorber is further washed in the Treated Gas Water Wash Vessel to minimize carry over of solvent to the downstream process. The treated gas subsequently flows to the Dehydration Unit (GDU) and Hydrocarbon Dew Pointing Unit (HCDP) for further treatment to remove moisture, and condensate in order to reach the final product quality.
The lean sulfinol flows downward through the GSU ab-sorber contacting the upward flowing natural gas. Sulfinol absorbs acid gas components and other impurities from the natural gas, and leaves the bottom of the absorber as rich sulfinol under level control. Rich sulfinol then flows to the Lean/Rich Heat Exchangers where it is heated by the hot lean sulfinol from the Regenerator column.
The pre-heated rich sulfinol is then introduced to the top of the regenerator column, where the sulfinol solvent is regenerated by contacting with the stripping steam and recycled back to the system as lean sulfinol.
Presence of water vapour in the hydrocarbon gas raises several problems on the production operation and in the transportation. The water vapour may condense and cause the formation of hydrates, solidify or favour corrosion if the gas contains acid components (Kvenvolden and Lorenson (2001); Sloan (2003)). Henceforth the wet sweet gas stream from the gas sweetening units is sent to the Gas Dehydration Unit (GDU) where it contacts with a liquid stream of glycol which has a greater affinity for the water vapour than does the gas. Afterwards the dehydrated gas is then sent to the Hydrocarbon Dew Pointing Unit (HCDP).
After contacting the gas, the water-rich glycol is regen-erated in the glycol regeneration package by heating at approximately atmospheric pressure to a temperature high enough to drive off almost all the absorbed water. The regenerated glycol is then cooled and re-circulated back to the contactor.
To meet the required quality for export gas specification, the gas is further processed in the Hydrocarbon Dew Pointing unit. The purpose of Hydrocarbon Dew Pointing Unit is to achieve the export gas specification of Gross Heat Value (GHV), Wobbe Index, and hydrocarbon dew point. This is done by expanding the gas from the GDU through a Turbo-Expander and removing the condensed heavier hydrocarbon as a liquid stream from the Cold Condensate Flash Drum. The gas is then compressed in a re-compressor and flows to Gas Export metering.
3. PROCESS MODEL
The model of the gas phase train is developed using first order transfer functions (where possible) with dead-time. Those simple models are sufficient to represent many chemical processes and moreover favoured in the industry (Forbes et al. (2015)). The benefits of using simple models may not be seen during design and commissioning phases when an expert control engineers are mostly present. However the benefits will be clearly visible during the operation phase when process engineers or plant operators can easily identify a model’s gain, delay, and time constant and compare the information with the real process data. Hence use of such simple models builds confidence amongst the operation team and reduces the risk of large model errors (model-plant mismatch) which may arise due to staff difficulty in understanding and identifying higher order models for a large scale system.
The developed process model, as it sketched in figure 1, is based on plant with a natural gas specification of
around 100 barg pressure, 45 gas temperature and a
throughput gas flow rate up to 3.0 MMSCMD (Million
Metric Standard Cubic Meter per day).
3.1 Gas Sweetening Unit (GSU) Dynamical Model
Referring to the GSU in figure 1, sour gas enters the bot-tom of the absorber column where the acid gas components are removed in a counter-current contact with the sulfinol flowing downwards from the top. The GSU system has two variables that have to be controlled: these are the
throughput gas flow measured by FIC-1 and the acid
concentration in the gas outlet measured by the process
analyser QIC-1. The manipulated variables are the
ab-sorber gas outlet flow through FCV-1 and the absorber
sulfinol input flow throughFCV-2. The specification of the
acid concentration in the outlet gas is fixed by operational goals and must be kept no more than 0.5% of its setpoint
at steady state.FIC-2 provides lean sulfinol flow
measure-ments to the GSU control system, whereas the differential
pressure sensorDPIC-1 across the sulfinol filter provides
measurements of the sulfinol flow disturbances.
The dynamics of the GSU system (inputs FIC-1, QIC-1
and outputsFCV-1,FCV-2 respectively) found to be well
defined by the following model:
GGSU =
−13.5
18.6s+ 1e
−2s 16.7
23.5s+ 1e
−6s
7.3 9.5s+ 1e
−13s 20
15.4s+ 1e
−6s
(1)
Time
50 100 150 200 250 300 350 400 450
Amplitude
0 2 4 6
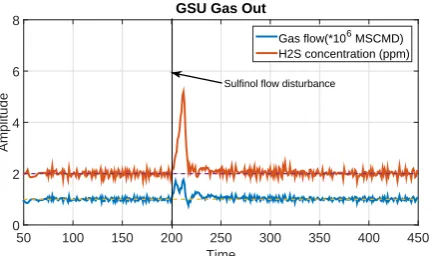
8 GSU Gas Out
Gas flow(*106 MSCMD) H2S concentration (ppm)
[image:5.595.62.278.73.201.2]Sulfinol flow disturbance
Fig. 2. GSU gas outlet responses for a solvent filter chock under GPC control.
The GSU model trended in figure 2 responds to solvent filter chocks exactly as expected of a real gas sweetening process. The results are obtained using a multivariable Generalised Predictive Controller (GPC) with a prediction horizon of 30, and a control horizon of 5. (Rossiter (2013), Camacho et al. (2007)).
The absorber bottom liquid level is maintained by the
level controllerLIC-1 which acts on the level control valve
LCV-1. Level is one of the most common variables in the process industry. The model transfer function of the absorber level control can be approximated to:
LIC1 = 1.2
54s+ 1e
−12s
(2)
The rich sulfinol is then routed to a low pressure Flash Vessel (not shown) where most of entrained and absorbed
hydrocarbons, some of the sour components like H2S,
CO2, COS, RSH, and water vapour are flashed off. Rich
sulfinol then flows through the lean/rich heat exchanger (where it will be preheated) towards the top of the sulfinol regeneration column. The absorbed acid gases will be stripped off by the counter-current contacting with a stripping vapour produced by the re-boiler beneath the column. The most important controls here are the vapour pressure and temperature. The rich Sulfinol is heated in the re-boiler and the vapour is returned to the column for stripping the absorbed acid gas components from the solvent. The flow rate of heating media, that is hot water,
is controlled through TIC-1. The vapour outlet of the
regeneration column passes through overhead condenser and is then routed to the overhead separator to capture any hydrocarbons or sulfinol carried over by the gas; this is then recycled back to the regeneration column as a reflux.
3.2 Gas Dehydration Unit (GDU) Dynamical Model
The Gas Dehydration Unit is downstream of sweetening train as shown in figure 1. The GDU mainly consists of an export gas glycol contactor and dehydration regeneration package. The wet gas enters into the bottom section of the contactor column and then flows into the inlet scrub-ber section of the column where any entrained liquid is removed before the gas is introduced into the dehydration section of the contactor. All the liquids recovered in the bottom of the inlet scrubber are drawn down under level
controlLIC-3. A transfer function model of the level
con-trol at the bottom of the contactor is quite similar to the
LIC-1 of the GSU absorber.
Lean glycol enters at the top of the column and is equally distributed over the whole section of the column. The dehydration by absorption takes place as the gas flows upwards through the packing, contacting the wetted sur-face of the packing. The GDU system has two variables that have to be controlled; these are the throughput gas
flow measured by FIC-3 and the water vapour load in
the gas outlet measured by the process analyser QIC-2.
The manipulated variables are the contactor gas outlet
flow throughFCV-3 and the contactor lean glycol input
flow throughFCV-4. The specification of the water vapour
concentration in the outlet gas is fixed by operational goals and must be kept to within 0.5% of its setpoint at steady
state. FIC-4 provides lean glycol flow measurements to
the GDU control system, whereas the differential pressure
sensorDPIC-2 across the rich glycol filter provides
mea-surements of the glycol flow disturbances. The dynamics
of the GDU system with these inputs (FIC-3,QIC-2) and
outputs (FCV-3,FCV-4) are well defined by the following
model:
GGDU=
−8
15s+ 1e
−3s 19
30.3s+ 1e
−7s
6.2 13.5s+ 1e
−13s 10
16.7s+ 1e
−7s
(3)
To evaluate the model response of the GDU model, a disturbance of 5% glycol filter chock has been introduced to the system at sample time 200. Filter chock is expected to limit glycol flow to the glycol regeneration package and causes disturbances to the regenerated glycol quality. Lean glycol flow to the contactor column is expected to be effected after a while which causes a small fluctuation in the gas flow rate. GDU control fluctuations are predicted to take a longer time to settle because the disturbance effects both operations in the system; those are the glycol regeneration package and the export gas dehydration.
It is clearly seen that, the GDU model responses as shown in figure 3 respond to glycol filter chocks exactly as expected of a real gas dehydration process. The results are obtained using a multivariable Generalised Predictive Controller (GPC) with a prediction horizon of 30, and a control horizon of 5.
Time
100 150 200 250 300 350 400 450
Amplitude
0 2 4 6
8 GDU Gas Out
Gas flow(*106 MSCMD) H2O concentration (ppm)
[image:5.595.324.541.555.682.2]Glycol flow disturbance
Fig. 3. GDU Gas outlet responses for a glycol filter chock under GPC control.
any remaining gases. Thereafter the rich glycol flows through the Glycol Cartridge Filters to remove any solid particles from the rich glycol stream to prevent these solids from fouling the heat transfer surfaces within the glycol regeneration package. Filter chocks are continuously
monitored by the differential pressure indicator DPIC-2
installed across the filter cartridge.
The filtered glycol flows to the Lean/Rich Glycol Ex-changer provided for energy conservation and reduces the total heat input required for the regeneration process. The rich glycol enters the Glycol Regeneration Column and flows down through the packing in a counter-flow stream to the upward water vapours from the reboiler beneath. In
the reboiler, the rich glycol is heated to 202 by a hot oil
bundle to remove any volatile material. The temperature in the glycol reboiler is maintained by the temperature
controller TIC-2 which controls the flow rate of the hot
oil. Finally the regenerated lean glycol flows to the glycol pump which circulates the glycol back into the system.
Control of temperature, like pressure and level, is one of the most common objectives in the process industry. The model transfer function of the repoiler temperature control
TIC-2 can be approximated to:
T IC2 = 0.5
45s+se
−45s (4)
3.3 Hydrocarbon Dew-pointing Unit (HCDP) Dynamical Model
The export gas then flows through a further gas condi-tioning process called Hydrocarbon Dew Pointing (HCDP) to remove hydrocarbon liquids from the natural gas in order to achieve a defined export gas specification of Gross Heating Value (GHV), Wobbe Index and hydrocarbon dew point. The process consists in cooling the natural gas under the dew point temperature of the heavy hydrocarbons which also maximises the production of the natural gas liquid obtaining LPG (C3 and C4) from the raw gas.
The feed gas from the GDU, at 45 and 95barg
approxi-mately, is cooled in the first heat exchanger by exchanging heat with the cold condensate return from the condensate flush drum. It is further cooled in the second heat ex-changer by exchanging heat with separated gas from the condensate flush drum. The feed gas then flows to the suction knock out drum, where the temperature is further
reduced to around 2by flashing. Thereafter the gas flows
to the Turbo-Expander where it is expanded to 65bargand
due to that the gas is cooled to around -15. The exit
gas from Turbo-Expander flows to the Cold Condensate Flash Drum, in which the condensed hydrocarbon liquid is removed. The dry gas from the Cold Condensate Flash Drum is then heated up by exchanging heat with incoming feed gas. Afterwards the gas enters the Re-compressor
section, where it is pressurised to around 70barg and then
flows to the export pipeline after which it is being cooled down via the third heat exchanger.
The performance of the HCDP unit is mainly driven by the operating pressure and temperature. The two main
controllers for this function are PIC-2 and TIC-3, see
figure 1.
The temperature control of the export gas Turbo expander
is achieved by TIC-3 located at vapour outlet of the
condensate flush drum. TIC-3 will throttle the control
valve TCV-3 provided in the cold bypass line of the
second heat exchanger to maintain the Turbo expander inlet temperature. Achieving this temperature is very important to remove the liquid condensate and attain the export gas specification.
The Turbo Expander has two variables to be controlled to maintain the quality of the product; these are unit pressure
measured byPIC-2 which is located at the vapour outlet
of the condensate flush drum and the load demand on the
unit measured by FIC-5. The manipulated variables are
the re-compressor outlet flow measured through FCV-5
and the expander inlet flow through IGV (Inlet Guide
Vans). The dynamics of the Turbo Expander can be
described by the following model (inputs PIC-2, FIC-5
and outputsFCV-5,IGV respectively):
GHCDP =
0.2 2s2+ 4s+ 1e
−s 1
2s+ 1
0.3 0.4s2+s+ 1e
−0.5s −0.3
0.1s2+ 3s+ 1e
−1.3s
(5)
To evaluate the model response of the HCDP, the flow set
point ofFIC-5 stepped down from 1.2 to 1.7 MMSCMD
at sample time 240. It is expected that at a time when the
IGV decreased the angle opening in order to decrease the
load demand through the turbo expander, there will be a slight reduction in pressure and then a small overshoot as expected due to the load reduction. The delay of pressure stream fluctuation is due to the fact that the pressure
sensor PIC-2 is physically located in the downstream of
the condensate flush drum while theIGV is located in the
inlet of the expander.
The HCDP model responses as shown in figure 9 react to step disturbances on gas flow rate exactly as expected of a real hydrocarbon dew-pointing process. The results ob-tained by applying a multivariable Generalised Predictive Controller (GPC) with a prediction horizon of 23, and a control horizon of 3.
Time
150 200 250 300 350 400 450
Amplitude
0 0.5 1 1.5 2 2.5
3 Export Gas Out
[image:6.595.320.542.584.712.2]Gas flow(*106 MSCMD) Pressure(*100 barg)
4. MODEL VALIDATION
Model validation and verification is the most important step in the model building sequence. The ultimate goals of creating a model representing the gas phase train in upstream oil & gas fields are to aid decision making and to provide engineering solutions to operational problems. The obtained models need to accurately reflect the real process scenarios which they will be compared to.
Never-theless, the developed models ofGGSU, GGDU, GHCDP are
destined to represent general processes and dynamics and not specific units; therefore the models can be validated by graphical comparisons and descriptions of model outputs with data from commonly available industrial processes (Jain et al. (2011)).
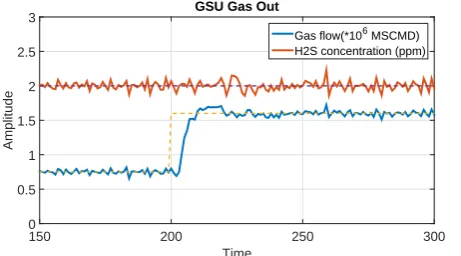
[image:7.595.306.561.72.219.2]4.1 Gas Sweetening Unit (GSU) Model Validation
Figure 5, below captures the simulation results of the GSU model stimulated by a step increment of almost 33% in the throughput gas flow. The results obtained by applying a multivariable Generalised Predictive Controller (GPC) with a prediction horizon of 30, and a control horizon of 5.
The model outcome is then compared with a real GSU response for almost the same size step increment taken from PDO Harweel site in Oman shown in figure 6. It is noticeable from the trends that the model responds -of
the two concerned signals, the gas flow rate and the H2S
concentration- almost in a similar manner to a real gas sweetening unit.
Time
150 200 250 300
Amplitude
0 0.5 1 1.5 2 2.5
3 GSU Gas Out
[image:7.595.315.559.256.424.2]Gas flow(*106 MSCMD) H2S concentration (ppm)
Fig. 5. Model: GSU Gas outlet responses with a set point increment of 33% in gas flow rate
4.2 Gas Dehydration Unit (GDU) Model Validation
Figure 7 trends the simulation results of the GDU model stimulated by a step increment of almost 30% in the throughput gas flow. The results obtained by applying a multivariable Generalised Predictive Controller (GPC) with a prediction horizon of 30 and a control horizon of 5.
The model outcome is then compared with a real GDU response for almost the same size step increment taken from PDO Harweel site in Oman shown in figure 8. It is visible from the figures that the model responds similarly as a real gas dehydration unit when comparing the two concerned signals, the gas flow rate and the water vapour load in the gas.
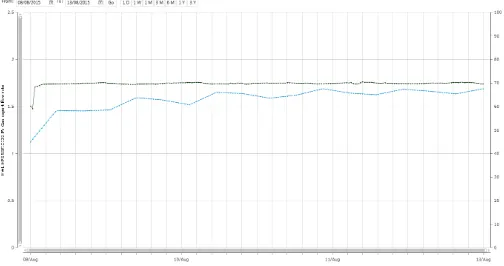
Fig. 6. PDO Harweel GSU Gas outlet responses with a set point increment of 33% in gas flow rate. Blue:
Gas flow rate (Range 0 - 2.5 MMSCMD), Brown: H2S
concentration (Range 0 - 50 ppm), Red: Solvent flow
rate (Range 0 - 10000 m3
/d)
Time
150 200 250 300 350 400 450
Amplitude
0 0.5 1 1.5 2 2.5
3 GDU Gas Out
[image:7.595.54.285.427.555.2]Gas flow(*106 MSCMD) H2O concentration (ppm)
Fig. 7. Model: GDU Gas outlet responses with a set point increment of 30% in gas flow rate
Fig. 8. PDO Harweel GDU Gas outlet responses with a set point increment of 30% in gas flow rate. Blue:
Gas flow rate (Range 0 - 2.5 MMSCMD), Green: H2O
concentration (Range 0 - 10 ppm), Red: Glycol flow
rate (Range 0 - 140 m3
/d)
4.3 Hydrocarbon Dew-pointing Unit (HCDP) Model Validation
[image:7.595.306.560.463.605.2]The model results obtained by applying a multivariable Generalised Predictive Controller (GPC) with a prediction horizon of 23, and a control horizon of 3.
Time
150 200 250 300 350 400 450
Amplitude
0 0.5 1 1.5 2 2.5
3 Export Gas Out
[image:8.595.55.287.112.242.2]Gas flow(*106 MSCMD) Pressure(*100 barg)
Fig. 9. Model: HCDP Gas outlet responses with a step disturbance in gas flow rate
Fig. 10. PDO Harweel HCDP Gas outlet responses with a step disturbance in gas flow rate. Blue: Gas flow
rate (Range 0 - 2.5 MMSCMD), Green: Gas pressure
(Range 0 - 100 barg)
5. CONCLUSIONS AND FUTURE CHALLENGES
Large scale series processes are rather common in the upstream oil & gas industry. Consequently, representative models are a key demand for control and automation engineers to test and verify different control approaches and strategies. The intention of this ’PART I’ paper is to deliver simple and easy to understand process models based on transfer functions for a complex gas processing operations. Processes like gas sweetening and gas dehydra-tion are deemed as difficult control tasks for both process and control engineers. Henceforth the presented model is aimed to ease these control challenges by providing an authentic framework for engineers to design, analyse and evaluate different control solutions. The model provides good opportunity for control engineers to test different variety of process disturbances, malfunctions, and load changes on the process operation and verify its significance in order to design a precise control system. Control system thats able to solve a major control challenge problem the disturbance growth effecting the series connected processes in LSS.
’PART II’ paper will investigate the use of this models as a base to test the control concept of ”Integration of Distributed Model Predictive Control (DMPC) and
the plant safe guarding system with the classical control system” presented by AlNaumani and Rossiter (2015). These models will be used to develop a specific Model Based Predictive Controller (MBPC) which is expected to significantly reduce the plant shut down occasions due to process disturbances and also to drop down operating cost by properly controlling the disturbance growth in the process, hence reducing energy fluctuations in the process and saves fuel. Accordingly the process element fatigues will be reduced which increases the process safety measure. As a result, the process operators work load will be decreased.
REFERENCES
AlNaumani, Y. and Rossiter, J. (2015). Distributed mpc
for upstream oil & gas fields - a practical view. In
9th International Symposium on Advanced Control of Chemical Processes, 325–330. IFAC.
Baker, R.W. and Lokhandwala, K. (2008). Natural gas
processing with membranes: an overview. Industrial &
Engineering Chemistry Research, 47(7), 2109–2121. Camacho, E.F. et al. (2007). Model predictive controllers.
InModel Predictive control. Springer.
Downs, J.J. and Vogel, E.F. (1993). A plant-wide
indus-trial process control problem. Computers & chemical
engineering, 17(3), 245–255.
Forbes, M.G., Patwardhan, R., Hamadah, H., and Gopaluni, B. (2015). Model predictive control in
indus-try: Challenges and opportunities. In9th International
Symposium on Advanced Control of Chemical Processes, 532–539. IFAC.
Jain, S., Creasey, R., Himmelspach, J., White, K., and Fu, M. (2011). Verification and validation of simulation models.
Kidnay, A.J., Parrish, W.R., and McCartney, D.G. (2011).
Fundamentals of natural gas processing, volume 218. CRC Press.
Kvenvolden, K.A. and Lorenson, T.D. (2001). The global
occurrence of natural gas hydrate. Wiley Online Library. Ohshiro, T. and Izumi, Y. (1999). Microbial
desulfuriza-tion of organic sulfur compounds in petroleum.
Bio-science, biotechnology, and biochemistry, 63(1), 1–9. Prett, D. and Morari, M. (1987). Shell process control
workshopbutterworths. Stoneham, Mass.
Rossiter, J.A. (2013). Model-based predictive control: a
practical approach. CRC press.
Sloan, E.D. (2003). Fundamental principles and
applica-tions of natural gas hydrates. Nature, 426(6964), 353–
[image:8.595.41.293.285.418.2]