This is a repository copy of
Formula for success: Multilevel modelling of Formula One
Driver and Constructor performance, 1950-2014
.
White Rose Research Online URL for this paper:
http://eprints.whiterose.ac.uk/96995/
Version: Supplemental Material
Article:
Bell, A. orcid.org/0000-0002-8268-5853, Smith, J., Sabel, C.E. et al. (1 more author)
(2016) Formula for success: Multilevel modelling of Formula One Driver and Constructor
performance, 1950-2014. Journal of Quantitative Analysis in Sports, 12 (2). pp. 99-112.
ISSN 1559-0410
https://doi.org/10.1515/jqas-2015-0050
[email protected] https://eprints.whiterose.ac.uk/ Reuse
Unless indicated otherwise, fulltext items are protected by copyright with all rights reserved. The copyright exception in section 29 of the Copyright, Designs and Patents Act 1988 allows the making of a single copy solely for the purpose of non-commercial research or private study within the limits of fair dealing. The publisher or other rights-holder may allow further reproduction and re-use of this version - refer to the White Rose Research Online record for this item. Where records identify the publisher as the copyright holder, users can verify any specific terms of use on the publisher’s website.
Takedown
If you consider content in White Rose Research Online to be in breach of UK law, please notify us by
Online appendix to
Formula for Success: Multilevel modelling of Formula
One driver and constructor performance, 1950-2014
.
This appendix provides further figures and tables that could not be included in the printed version of the paper, but which may nonetheless be of interest to some readers. The contents of this document are as followed:
Table A1: shows the sensitivity of the models to different outcome variable transformations, as
mentioned in section 3.3.2.
Table A2: shows the insignificance of the race-level and driver-year level random effects (as mentioned in
section 3.1.
Table A3: shows basic null models in the form of equation 2 in the paper, including the model that
produced Figure 1 and the variances mentioned in section 4.2.
Table A4: shows complex models in the form of equation 3 in the paper, including the model that
produced Figure 2.
Table A5: shows complex models that produced differential random effects for different weather
conditions, including the model that produces Figure 3.
Table A6: shows complex models in the form of equation 7 in the paper, including the model that
produced Figure 4.
Table A7: shows the separately coded version of the models shown in table A5.
Table A8: shows the separately coded version of the models shown in table A6.
Table A9: shows a list of the top 50 drivers, extending Figure 1.
Table A10: shows predicted and actual champions in each season, as mentioned in section 4.3.
Table A11: shows predicted and actual champions for the 2015 season, as mentioned in section 4.3.
Figure A1: a visual representation of the team, team-year and driver variances from the model in table
A3.
Figure A2: shows all the drivers in a single graph
Figure A3: shows the top 20 team-level residuals
Figure A4: shows the top 20 team-year-level residuals
Figure A5: shows the top 20 drivers under different weather conditions, as mentioned in section 4.1.
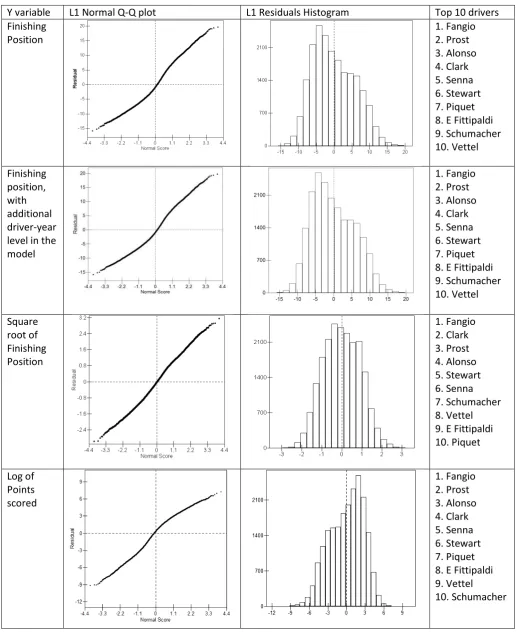
Table A1: Level 1 residual plots, and predicted top 10 drivers, according to a variety of different dependent variables and model specifications.
Y variable L1 Normal Q-Q plot L1 Residuals Histogram Top 10 drivers
Rankit of Points scored 1. Fangio 2. Clark 3. Prost 4. Alonso 5. Stewart 6. Senna 7. Schumacher 8. Vettel 9. E Fittipaldi 10. Piquet
Table A2: Model results for 5 and 6 level model including a driver-year level and a race level (for a model with 500,000 iterations).
6-level model 5-level model
Estimate 95% CIs ESS Estimate 95% CIs ESS
Fixed Part
Constant 0.434 0.403 0.464 19157 0.434 0.404 0.464 19492 Ndrivers -gm -0.042 -0.046 -0.038 150153 -0.042 -0.046 -0.038 153110 NewComp -gm 0.977 0.343 1.614 166553 0.978 0.346 1.611 168164
Random Part
Driver-Year
Variance 0.003 0.001 0.006 984 0.003 0.001 0.006 1007 Race Variance 0.000 0.000 0.000 7314
Team Variance 0.023 0.016 0.032 32087 0.023 0.016 0.031 32399 Team-Year Variance 0.021 0.017 0.025 29449 0.021 0.017 0.025 28677 Driver Variance 0.013 0.010 0.017 32126 0.013 0.010 0.017 31736 Level 1 Variance 0.288 0.282 0.294 349694 0.288 0.282 0.294 350524
[image:4.595.54.554.516.740.2]DIC: 33786.549 33762.679
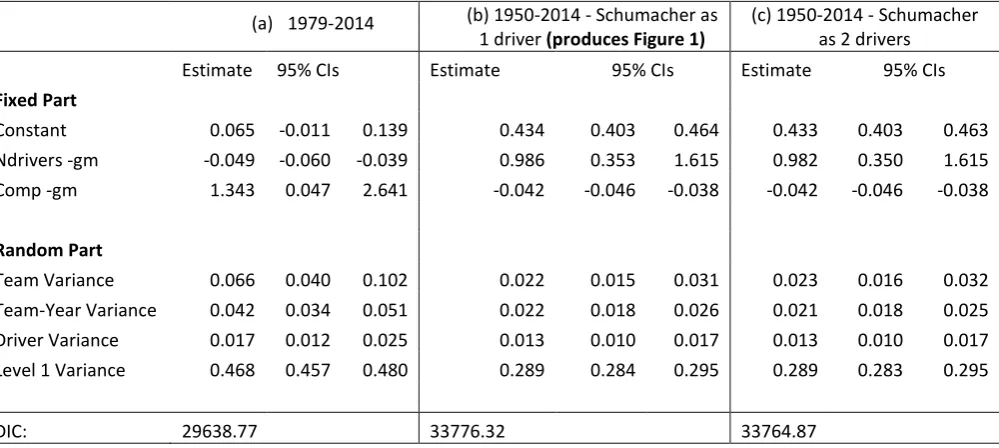
Table A3: Models showing variance partitioning, controlling for competitiveness and the number of drivers.
(a) 1979-2014 (b) 1950-2014 - Schumacher as 1 driver (produces Figure 1)
(c) 1950-2014 - Schumacher as 2 drivers
Estimate 95% CIs Estimate 95% CIs Estimate 95% CIs
Fixed Part
Constant 0.065 -0.011 0.139 0.434 0.403 0.464 0.433 0.403 0.463 Ndrivers -gm -0.049 -0.060 -0.039 0.986 0.353 1.615 0.982 0.350 1.615 Comp -gm 1.343 0.047 2.641 -0.042 -0.046 -0.038 -0.042 -0.046 -0.038
Random Part
Team Variance 0.066 0.040 0.102 0.022 0.015 0.031 0.023 0.016 0.032 Team-Year Variance 0.042 0.034 0.051 0.022 0.018 0.026 0.021 0.018 0.025 Driver Variance 0.017 0.012 0.025 0.013 0.010 0.017 0.013 0.010 0.017 Level 1 Variance 0.468 0.457 0.480 0.289 0.284 0.295 0.289 0.283 0.295
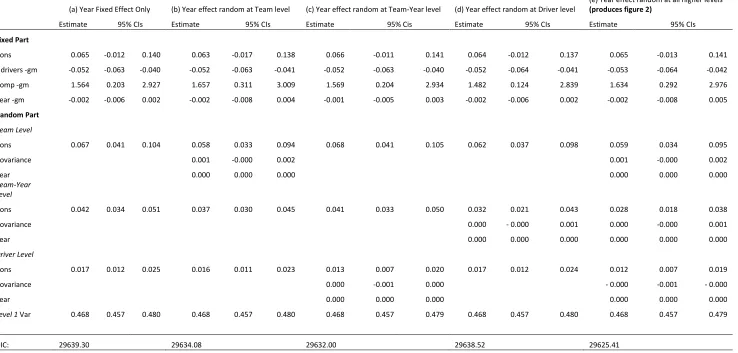
Table A4: Models with variance as a function of Year, 1979-2014
(a) Year Fixed Effect Only (b) Year effect random at Team level (c) Year effect random at Team-Year level (d) Year effect random at Driver level
(e) Year effect random at all higher levels
(produces figure 2)
Estimate 95% CIs Estimate 95% CIs Estimate 95% Cis Estimate 95% CIs Estimate 95% CIs
Fixed Part
Cons 0.065 -0.012 0.140 0.063 -0.017 0.138 0.066 -0.011 0.141 0.064 -0.012 0.137 0.065 -0.013 0.141
Ndrivers -gm -0.052 -0.063 -0.040 -0.052 -0.063 -0.041 -0.052 -0.063 -0.040 -0.052 -0.064 -0.041 -0.053 -0.064 -0.042
Comp -gm 1.564 0.203 2.927 1.657 0.311 3.009 1.569 0.204 2.934 1.482 0.124 2.839 1.634 0.292 2.976
Year -gm -0.002 -0.006 0.002 -0.002 -0.008 0.004 -0.001 -0.005 0.003 -0.002 -0.006 0.002 -0.002 -0.008 0.005
Random Part
Team Level
Cons 0.067 0.041 0.104 0.058 0.033 0.094 0.068 0.041 0.105 0.062 0.037 0.098 0.059 0.034 0.095
Covariance 0.001 -0.000 0.002 0.001 -0.000 0.002
Year 0.000 0.000 0.000 0.000 0.000 0.000
Team-Year Level
Cons 0.042 0.034 0.051 0.037 0.030 0.045 0.041 0.033 0.050 0.032 0.021 0.043 0.028 0.018 0.038
Covariance 0.000 - 0.000 0.001 0.000 -0.000 0.001
Year 0.000 0.000 0.000 0.000 0.000 0.000
Driver Level
Cons 0.017 0.012 0.025 0.016 0.011 0.023 0.013 0.007 0.020 0.017 0.012 0.024 0.012 0.007 0.019
Covariance 0.000 -0.001 0.000 - 0.000 -0.001 - 0.000
Year 0.000 0.000 0.000 0.000 0.000 0.000
Level 1 Var 0.468 0.457 0.480 0.468 0.457 0.480 0.468 0.457 0.479 0.468 0.457 0.480 0.468 0.457 0.479
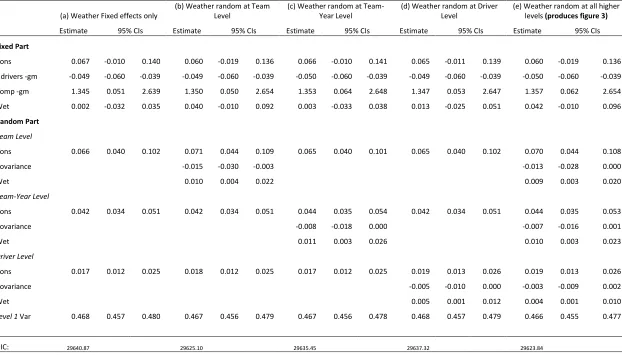
Table A5: Models with variance as a function of weather (dry/wet conditions), 1979-2014
(a) Weather Fixed effects only
(b) Weather random at Team Level
(c) Weather random at Team-Year Level
(d) Weather random at Driver Level
(e) Weather random at all higher levels (produces figure 3)
Estimate 95% CIs Estimate 95% CIs Estimate 95% CIs Estimate 95% CIs Estimate 95% CIs
Fixed Part
Cons 0.067 -0.010 0.140 0.060 -0.019 0.136 0.066 -0.010 0.141 0.065 -0.011 0.139 0.060 -0.019 0.136
Ndrivers -gm -0.049 -0.060 -0.039 -0.049 -0.060 -0.039 -0.050 -0.060 -0.039 -0.049 -0.060 -0.039 -0.050 -0.060 -0.039
Comp -gm 1.345 0.051 2.639 1.350 0.050 2.654 1.353 0.064 2.648 1.347 0.053 2.647 1.357 0.062 2.654
Wet 0.002 -0.032 0.035 0.040 -0.010 0.092 0.003 -0.033 0.038 0.013 -0.025 0.051 0.042 -0.010 0.096
Random Part
Team Level
Cons 0.066 0.040 0.102 0.071 0.044 0.109 0.065 0.040 0.101 0.065 0.040 0.102 0.070 0.044 0.108
Covariance -0.015 -0.030 -0.003 -0.013 -0.028 0.000
Wet 0.010 0.004 0.022 0.009 0.003 0.020
Team-Year Level
Cons 0.042 0.034 0.051 0.042 0.034 0.051 0.044 0.035 0.054 0.042 0.034 0.051 0.044 0.035 0.053
Covariance -0.008 -0.018 0.000 -0.007 -0.016 0.001
Wet 0.011 0.003 0.026 0.010 0.003 0.023
Driver Level
Cons 0.017 0.012 0.025 0.018 0.012 0.025 0.017 0.012 0.025 0.019 0.013 0.026 0.019 0.013 0.026
Covariance -0.005 -0.010 0.000 -0.003 -0.009 0.002
Wet 0.005 0.001 0.012 0.004 0.001 0.010
Level 1 Var 0.468 0.457 0.480 0.467 0.456 0.479 0.467 0.456 0.478 0.468 0.457 0.479 0.466 0.455 0.477
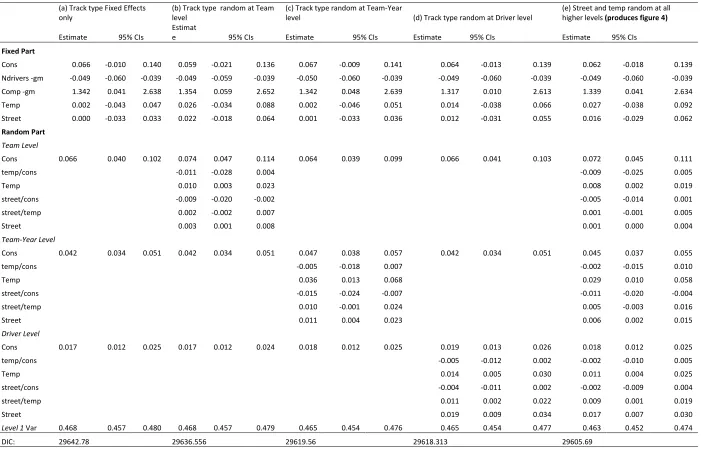
Table A6: Models with variance as a function of track type (permanent/temporary/street), 1979-2014
(a) Track type Fixed Effects only
(b) Track type random at Team level
(c) Track type random at Team-Year
level (d) Track type random at Driver level
(e) Street and temp random at all higher levels (produces figure 4)
Estimate 95% CIs
Estimat
e 95% CIs Estimate 95% CIs Estimate 95% CIs Estimate 95% CIs
Fixed Part
Cons 0.066 -0.010 0.140 0.059 -0.021 0.136 0.067 -0.009 0.141 0.064 -0.013 0.139 0.062 -0.018 0.139
Ndrivers -gm -0.049 -0.060 -0.039 -0.049 -0.059 -0.039 -0.050 -0.060 -0.039 -0.049 -0.060 -0.039 -0.049 -0.060 -0.039
Comp -gm 1.342 0.041 2.638 1.354 0.059 2.652 1.342 0.048 2.639 1.317 0.010 2.613 1.339 0.041 2.634
Temp 0.002 -0.043 0.047 0.026 -0.034 0.088 0.002 -0.046 0.051 0.014 -0.038 0.066 0.027 -0.038 0.092
Street 0.000 -0.033 0.033 0.022 -0.018 0.064 0.001 -0.033 0.036 0.012 -0.031 0.055 0.016 -0.029 0.062
Random Part
Team Level
Cons 0.066 0.040 0.102 0.074 0.047 0.114 0.064 0.039 0.099 0.066 0.041 0.103 0.072 0.045 0.111
temp/cons -0.011 -0.028 0.004 -0.009 -0.025 0.005
Temp 0.010 0.003 0.023 0.008 0.002 0.019
street/cons -0.009 -0.020 -0.002 -0.005 -0.014 0.001
street/temp 0.002 -0.002 0.007 0.001 -0.001 0.005
Street 0.003 0.001 0.008 0.001 0.000 0.004
Team-Year Level
Cons 0.042 0.034 0.051 0.042 0.034 0.051 0.047 0.038 0.057 0.042 0.034 0.051 0.045 0.037 0.055
temp/cons -0.005 -0.018 0.007 -0.002 -0.015 0.010
Temp 0.036 0.013 0.068 0.029 0.010 0.058
street/cons -0.015 -0.024 -0.007 -0.011 -0.020 -0.004
street/temp 0.010 -0.001 0.024 0.005 -0.003 0.016
Street 0.011 0.004 0.023 0.006 0.002 0.015
Driver Level
Cons 0.017 0.012 0.025 0.017 0.012 0.024 0.018 0.012 0.025 0.019 0.013 0.026 0.018 0.012 0.025
temp/cons -0.005 -0.012 0.002 -0.002 -0.010 0.005
Temp 0.014 0.005 0.030 0.011 0.004 0.025
street/cons -0.004 -0.011 0.002 -0.002 -0.009 0.004
street/temp 0.011 0.002 0.022 0.009 0.001 0.019
Street 0.019 0.009 0.034 0.017 0.007 0.030
Level 1 Var 0.468 0.457 0.480 0.468 0.457 0.479 0.465 0.454 0.476 0.465 0.454 0.477 0.463 0.452 0.474
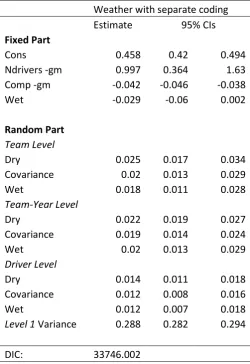
Table A7: Separately coded model with variance as a function of weather, 1950-2014
Weather with separate coding
Estimate 95% CIs
Fixed Part
Cons 0.458 0.42 0.494
Ndrivers -gm 0.997 0.364 1.63
Comp -gm -0.042 -0.046 -0.038
Wet -0.029 -0.06 0.002
Random Part
Team Level
Dry 0.025 0.017 0.034
Covariance 0.02 0.013 0.029
Wet 0.018 0.011 0.028
Team-Year Level
Dry 0.022 0.019 0.027
Covariance 0.019 0.014 0.024
Wet 0.02 0.013 0.029
Driver Level
Dry 0.014 0.011 0.018
Covariance 0.012 0.008 0.016
Wet 0.012 0.007 0.018
Level 1 Variance 0.288 0.282 0.294
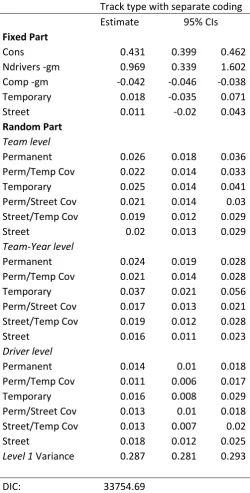
Table A8: Separately coded model with variance as a function of track type, 1950-2014
Track type with separate coding
Estimate 95% CIs
Fixed Part
Cons 0.431 0.399 0.462
Ndrivers -gm 0.969 0.339 1.602
Comp -gm -0.042 -0.046 -0.038
Temporary 0.018 -0.035 0.071
Street 0.011 -0.02 0.043
Random Part
Team level
Permanent 0.026 0.018 0.036
Perm/Temp Cov 0.022 0.014 0.033
Temporary 0.025 0.014 0.041
Perm/Street Cov 0.021 0.014 0.03
Street/Temp Cov 0.019 0.012 0.029
Street 0.02 0.013 0.029
Team-Year level
Permanent 0.024 0.019 0.028
Perm/Temp Cov 0.021 0.014 0.028
Temporary 0.037 0.021 0.056
Perm/Street Cov 0.017 0.013 0.021
Street/Temp Cov 0.019 0.012 0.028
Street 0.016 0.011 0.023
Driver level
Permanent 0.014 0.01 0.018
Perm/Temp Cov 0.011 0.006 0.017
Temporary 0.016 0.008 0.029
Perm/Street Cov 0.013 0.01 0.018
Street/Temp Cov 0.013 0.007 0.02
Street 0.018 0.012 0.025
Level 1 Variance 0.287 0.281 0.293
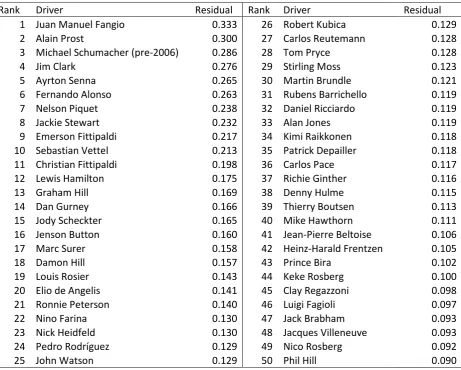
Table A9: Top 50 drivers based on the driver level residuals from model A1d (Michael Schumacher treated as two drivers, pre 2006 and post 2010)
Rank Driver Residual Rank Driver Residual
1 Juan Manuel Fangio 0.333 26 Robert Kubica 0.129
2 Alain Prost 0.300 27 Carlos Reutemann 0.128
3 Michael Schumacher (pre-2006) 0.286 28 Tom Pryce 0.128
4 Jim Clark 0.276 29 Stirling Moss 0.123
5 Ayrton Senna 0.265 30 Martin Brundle 0.121
6 Fernando Alonso 0.263 31 Rubens Barrichello 0.119
7 Nelson Piquet 0.238 32 Daniel Ricciardo 0.119
8 Jackie Stewart 0.232 33 Alan Jones 0.119
9 Emerson Fittipaldi 0.217 34 Kimi Raikkonen 0.118
10 Sebastian Vettel 0.213 35 Patrick Depailler 0.118
11 Christian Fittipaldi 0.198 36 Carlos Pace 0.117
12 Lewis Hamilton 0.175 37 Richie Ginther 0.116
13 Graham Hill 0.169 38 Denny Hulme 0.115
14 Dan Gurney 0.166 39 Thierry Boutsen 0.113
15 Jody Scheckter 0.165 40 Mike Hawthorn 0.111
16 Jenson Button 0.160 41 Jean-Pierre Beltoise 0.106
17 Marc Surer 0.158 42 Heinz-Harald Frentzen 0.105
18 Damon Hill 0.157 43 Prince Bira 0.102
19 Louis Rosier 0.143 44 Keke Rosberg 0.100
20 Elio de Angelis 0.141 45 Clay Regazzoni 0.098
21 Ronnie Peterson 0.140 46 Luigi Fagioli 0.097
22 Nino Farina 0.130 47 Jack Brabham 0.093
23 Nick Heidfeld 0.130 48 Jacques Villeneuve 0.093
24 Pedro Rodríguez 0.129 49 Nico Rosberg 0.092
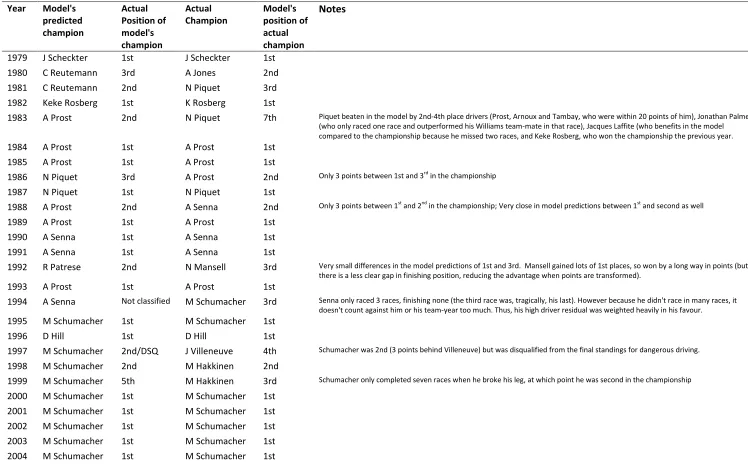
Table A10: Comparison between predictions of the champion (from the model as in equation 3) and the actual champion, for years 1979-2014. Schumacher is treated as two drivers.
Year Model's predicted champion Actual Position of model's champion Actual Champion Model's position of actual champion Notes
1979 J Scheckter 1st J Scheckter 1st 1980 C Reutemann 3rd A Jones 2nd 1981 C Reutemann 2nd N Piquet 3rd 1982 Keke Rosberg 1st K Rosberg 1st
1983 A Prost 2nd N Piquet 7th Piquet beaten in the model by 2nd-4th place drivers (Prost, Arnoux and Tambay, who were within 20 points of him), Jonathan Palmer (who only raced one race and outperformed his Williams team-mate in that race), Jacques Laffite (who benefits in the model compared to the championship because he missed two races, and Keke Rosberg, who won the championship the previous year.
1984 A Prost 1st A Prost 1st 1985 A Prost 1st A Prost 1st
1986 N Piquet 3rd A Prost 2nd Only 3 points between 1st and 3rd in the championship
1987 N Piquet 1st N Piquet 1st
1988 A Prost 2nd A Senna 2nd Only 3 points between 1st and 2nd in the championship; Very close in model predictions between 1st and second as well
1989 A Prost 1st A Prost 1st 1990 A Senna 1st A Senna 1st 1991 A Senna 1st A Senna 1st
1992 R Patrese 2nd N Mansell 3rd Very small differences in the model predictions of 1st and 3rd. Mansell gained lots of 1st places, so won by a long way in points (but there is a less clear gap in finishing position, reducing the advantage when points are transformed).
1993 A Prost 1st A Prost 1st
1994 A Senna Not classified M Schumacher 3rd Senna only raced 3 races, finishing none (the third race was, tragically, his last). However because he didn't race in many races, it doesn't count against him or his team-year too much. Thus, his high driver residual was weighted heavily in his favour.
1995 M Schumacher 1st M Schumacher 1st 1996 D Hill 1st D Hill 1st
1997 M Schumacher 2nd/DSQ J Villeneuve 4th Schumacher was 2nd (3 points behind Villeneuve) but was disqualified from the final standings for dangerous driving.
1998 M Schumacher 2nd M Hakkinen 2nd
1999 M Schumacher 5th M Hakkinen 3rd Schumacher only completed seven races when he broke his leg, at which point he was second in the championship
2005 F Alonso 1st F Alonso 1st
2006 M Schumacher 2nd F Alonso 2nd Model produces a close result between Alonso and Schumacher. In the championship there was only a 13 point difference.
2007 F Alonso 3rd K Raikkonen 2nd Only 1 point between 1st and 3rd on the championship
2008 L Hamilton 1st L Hamilton 1st 2009 J Button 1st J Button 1st
2010 F Alonso 2nd S Vettel 2nd Only 4 points between 1st and 2nd in the championship
2011 S Vettel 1st S Vettel 1st
2012 F Alonso 2nd S Vettel 2nd Only 3 points between 1st and 2nd in the championship
[image:12.842.37.361.228.490.2]2013 S Vettel 1st S Vettel 1st 2014 L Hamilton 1st L Hamilton 1st
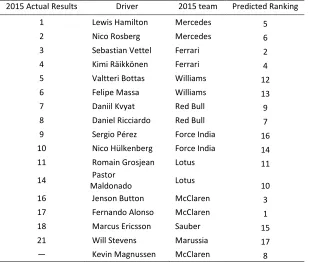
Table A11: Out of sample predictions for the 2015 F1 season. Team year residuals are assumed not to change from 2014, and all trends are extrapolated. Based on a model including random slopes on year, using data from 1979. Michael Schumacher is treated as two drivers.
2015 Actual Results Driver 2015 team Predicted Ranking
1 Lewis Hamilton Mercedes 5
2 Nico Rosberg Mercedes 6
3 Sebastian Vettel Ferrari 2
4 Kimi Räikkönen Ferrari 4
5 Valtteri Bottas Williams 12
6 Felipe Massa Williams 13
7 Daniil Kvyat Red Bull 9
8 Daniel Ricciardo Red Bull 7
9 Sergio Pérez Force India 16
10 Nico Hülkenberg Force India 14
11 Romain Grosjean Lotus 11
14 Pastor
Maldonado Lotus 10 16 Jenson Button McClaren 3
17 Fernando Alonso McClaren 1
18 Marcus Ericsson Sauber 15
21 Will Stevens Marussia 17
F
A P
-
-
N
M
S
-
B
[image:13.595.92.511.474.753.2]
A
Figure A3: Top 20 team-level residuals, based on model (b) in table A3
[image:14.595.77.503.468.744.2]F
A P
-
-
N
M
S
-
1
F
A P
-
-
N
M
S
B
A
1
These graphs (figures A6 and A7) were produced by mo the model, to allow effects and their uncertainty to be most easily computed. These models produce exactly