M E T H O D O L O G Y
Open Access
An adjusted bed net coverage indicator with
estimations for 23 African countries
Dieter Vanderelst
1*and Niko Speybroeck
2Abstract
Background: Many studies have assessed the level of bed net coverage in populations at risk of malaria infection. These revealed large variations in bed net use across countries, regions and social strata. Such studies are often aimed at identifying populations with low access to bed nets that should be prioritized in future interventions. However, often spatial differences in malaria endemicity are not taken into account. By ignoring variability in malaria endemicity, these studies prioritize populations with little access to bed nets, even if these happen to live in low endemicity areas. Conversely, populations living in regions with high malaria endemicity will receive a lower priority once a seizable proportion is protected by bed nets. Adequately assigning priorities requires accounting for both the current level of bed net coverage and the local malaria endemicity. Indeed, as shown here for 23 African countries, there is no correlation between the level of bed net coverage and the level of malaria endemicity in a region. Therefore, the need for future interventions can not be assessed based on current bed net coverage alone. This paper proposes the Adjusted Bed net Coverage (ABC) statistic as a measure taking into account both local malaria endemicity and the level of bed net coverage. The measure allows setting priorities for future interventions taking into account both local malaria endemicity and bed net coverage.
Methods: A mathematical formulation of the ABC as a weighted difference of bed net coverage and malaria endemicity is presented. The formulation is parameterized based on a model of malaria epidemiology (Smithet al. Trends Parasitol 25:511-516, 2009). By parameterizing the ABC based on this model, the ABC as used in this paper is proxy for the steady-state malaria burden given the current level of bed net coverage. Data on the bed net coverage in under five year olds and malaria endemicity in 23 Sub-Saharan countries is used to show that the ABC prioritizes different populations than the level of bed net coverage by itself. Data from the following countries was used: Angola, Burkina Faso, Burundi, Cameroon, Congo Democratic Republic, Ethiopia, Ghana, Guinea, Kenya, Liberia, Madagascar, Malawi, Mali, Mozambique, Namibia, Nigeria, Rwanda, Senegal, Sierra Leone, Tanzania, Uganda, Zambia and Zimbabwe. The priority order given by the ABC and the bed net coverage are compared at the countries’ level, the first level administrative divisions and for five different wealth quintiles.
Results: Both at national level and at the level of the administrative divisions the ABC suggests a different priority order for selecting countries and divisions for future interventions. When taking into account malaria endemicity, measures assessing equality in access to bed nets across wealth quintiles, such as slopes of inequality, are prone to change. This suggests that when assessing inequality in access to bed nets one should take into account the local malaria endemicity for populations from different wealth quintiles.
Conclusion: Accounting for malaria endemicity highlights different countries, regions and socio-economic strata for future intervention than the bed net coverage by itself. Therefore, care should be taken to factor out any effects of local malaria endemicity in assessing bed net coverage and in prioritizing populations for further scale-up of bed net coverage. The ABC is proposed as a simple means to do this that is derived from an existing model of malaria epidemiology.
*Correspondence: [email protected]
1University Antwerp Faculty of Applied Economics Prinsstraat 13, Antwerp 2000, Belgium
Full list of author information is available at the end of the article
distribution of malaria vectors and malaria burden [1]. Recently, these efforts have culminated in a high-resolution map of the global malaria endemicity [2,3] confirming the existence of large between and within country differences in malaria burden, vector preva-lence and endemicity. The most effective way to prevent malaria infection is using an insecticide-treated bed net [4]. In spite of the large-scale programmes that have been undertaken to distribute nets [5], nets are not uniformly distributed across the population at risk. Bed net own-ership varies among countries, regions and social strata [5,6].
The spatial variation in both malaria endemicity and bed net coverage strongly suggests that some populations are at greater risk than others. In particular, populations living in regions of high malaria endemicity but with low levels of bed net coverage are at high risk. Indeed, if bed net coverage and malaria endemicity are not strongly cor-related, they are two independent components of the level of protection against malaria. In this case, the level of malaria endemicity should be taken into account when determining the level of protection or when setting priori-ties for bed net distribution as for populations with similar bed net coverage the level of local malaria endemicity will vary considerably.
Recent data on bed net coverage (obtained through sur-veys) and a map of global malaria endemicity [2,3] allow investigating the relation between bed net coverage and malaria endemicity for many countries. In this paper, data from 23 sub-Saharan countries are used to propose an Adjusted Bed net Coverage (ABC) statistic taking into account both bed net coverage and malaria endemicity. It is shown how the ABC can be used in identifying popula-tions characterized by a low level of bed net usage living in regions with malaria endemicity. Such populations would be prime targets for scaling up bed net coverage through additional programmes.
Methods
Bed net coverage and malaria endemicity
Data on bed net use were obtained from the MEA-SURE Demographic and Health Surveys (DHS). In this paper, the level of bed net coverage in children under five is used. All Demographic and Health Surveys (DHS) and Malaria Indicators Surveys (MIS) conducted in sub-Saharan Africa were included provided data were available in June 2013. If more than one survey was conducted in a particular country, the most recent survey was used pro-vided it contained all necessary variables. Some surveys or countries had to be omitted from the analysis as the avail-able data were deemed too old or because variavail-ables critical
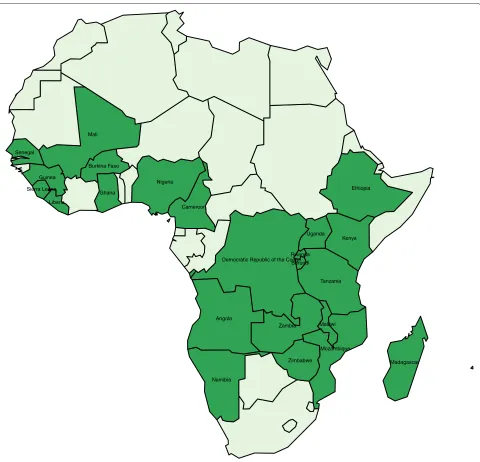
total, data from 23 countries were analysed in the current study (see Figure 1 and Table 1).
The DHS selects clusters of households to be sur-veyed in a two-stage cluster sampling design. The GPS coordinates of these clusters are recorded using GPS receivers. To ensure respondent confidentiality, the lat-itude/longitude positions are displaced for all surveys. Urban clusters are displaced by maximally 2 kilometres and rural clusters by maximally 5 kilometres. Moreover, 1% of the rural clusters are displaced by up to 10 km. In sum, for over 99% of the clusters the provided GPS coordinates are correct up to at least 5 km.
For each cluster, the level of P. falciparum endemic-ity in 2010 as provided by the Malaria Atlas Project was extracted at the recorded GPS location. More specifically, the age-standardized P. falciparumparasite rate (PfPR2-10) was extracted describing the estimated proportion of 2–10 year olds in the general population that are infected withP. falciparumat any one time, averaged over the 12 months of 2010.
The first-level administrative divisions for all included countries were downloaded from the GADM database of Global Administrative Areas. The level of bed net cover-age and malaria endemicity for each first-level administra-tive division was determined by taking the weighted mean of the bed net coverage and malaria endemicity for all clusters in the division using the sample weights provided by the DHS.
Evaluating the differences in bed net coverage across dif-ferent social strata is done based on the wealth quintiles provided by the DHS. For each sampled household, the DHS constructs a wealth index using easy-to-collect data on a household’s ownership of selected assets, such as televisions and bicycles; materials used for housing con-struction; and types of water access and sanitation facili-ties. The wealth quintiles divide the sampled households into five different levels of wealth. In many instances, the wealth index or quintile has been shown to be an impor-tant factor in a household’s access to healthcare with richer households having usually better access to provisions.
The Adjusted Bed net Coverage (ABC)
Angola Burkina Faso
Burundi Cameroon
Democratic Republic of the Congo
Ethiopia Ghana
Guinea
Kenya Liberia
Madagascar Malawi
Mali
Nigeria
Namibia
Rwanda Senegal
Sierra Leone
Zambia
Tanzania Uganda
Zimbabwe
[image:3.595.59.539.84.546.2]Mozambique
Figure 1Map of the 23 countries included in the current study.
endemicity, it becomes clear that the difference in malaria risk between regions A and D is not as large as the bed net coverage would let one to belief. The low and high malaria endemicity in regions A and D respectively are likely to compensate the difference in bed net coverage between the regions and the malaria risk in region D is arguably as high as in region A. In spite of the difference in bed net coverage, future interventions aimed at increasing or maintaining the bed net coverage in region D might be as pressing as interventions to increase bed net coverage in region A. This illustrates that bed net coverage is not a sufficient measure to prioritize regions for intervention.
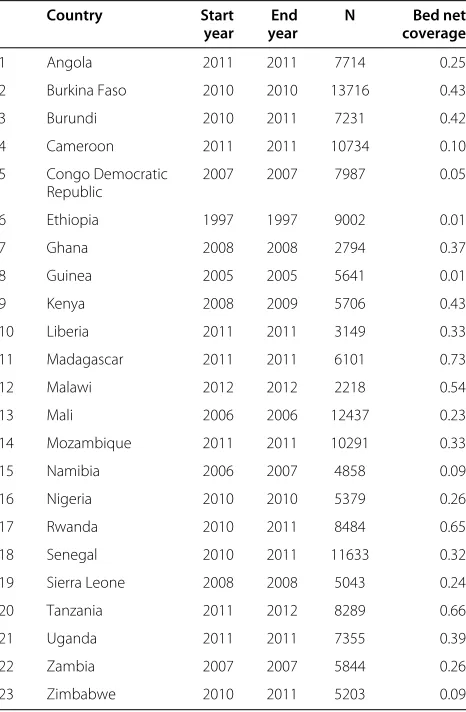
number of children sampled and the average level of bed net coverage
Country Start End N Bed net
year year coverage
1 Angola 2011 2011 7714 0.25
2 Burkina Faso 2010 2010 13716 0.43
3 Burundi 2010 2011 7231 0.42
4 Cameroon 2011 2011 10734 0.10
5 Congo Democratic 2007 2007 7987 0.05
Republic
6 Ethiopia 1997 1997 9002 0.01
7 Ghana 2008 2008 2794 0.37
8 Guinea 2005 2005 5641 0.01
9 Kenya 2008 2009 5706 0.43
10 Liberia 2011 2011 3149 0.33
11 Madagascar 2011 2011 6101 0.73
12 Malawi 2012 2012 2218 0.54
13 Mali 2006 2006 12437 0.23
14 Mozambique 2011 2011 10291 0.33
15 Namibia 2006 2007 4858 0.09
16 Nigeria 2010 2010 5379 0.26
17 Rwanda 2010 2011 8484 0.65
18 Senegal 2010 2011 11633 0.32
19 Sierra Leone 2008 2008 5043 0.24
20 Tanzania 2011 2012 8289 0.66
21 Uganda 2011 2011 7355 0.39
22 Zambia 2007 2007 5844 0.26
23 Zimbabwe 2010 2011 5203 0.09
according to their level of bed net coverage alone (see Table 2).
[image:4.595.57.290.131.487.2]In sum, the example listed in Table 2 illustrates that (1) both bed net coverage and malaria endemicity should be taken into account when determining the malaria risk of a given population and (2) the weight assigned
Table 2 Four hypothetical regions with different levels of bed net coverage and malaria endemicity
Coverage Endemicity Adjusted Coverage ABC rank rank
Region A 0.10 0.10 0.55 1 3
Region B 0.30 0.70 0.26 2 1
Region C 0.70 0.30 0.68 3 4
Region D 0.90 0.90 0.39 4 2
The third column gives the ABC calculated using Equation 4. The fourth and fifth column give the priority order as deduced from the level of bed net coverage and the ABC respectively. See text for details.
statistic is derived that is a weighted combination of both parameters.
Mathematical definition of the Adjusted Bed net Coverage
The ABC assigns populations a value between 0 (no pro-tection) and 1 (complete propro-tection) and is calculated as the weighted difference of the malaria endemicity and bed net coverage. In the following, the formulation of the statistic is presented and it is shown how the weighting used here relates to a model of the reduction in malaria endemicity proposed by Smithet al. [7].
Let abe the vector defined in Figure 2a and given in Equation (1).
a=[−cosθ, sinθ] (1)
The ABCi for population i is obtained by projecting populationiwith bed net coverageci and endemicityei onto vectora. This results in a higher ABC being assigned to populations with a lower bed net coverage and a higher endemicity. To be able to project populationiontoa, the vectorvis defined based onciandeias follows (see also Figure 2a),
vi=[ci,ei−em] (2)
Projecting vi on aresults in a new vector with norm ABCigiving the Adjusted Bed net statistic for population i(Equation 3). Note that the denominator in Equation 3 normalizesABCito assume values between 0 ans 1.
ABCi=
sinθ×ci−cosθ×(ei−emax) sinθ+cosθ×emax
(3)
As can be seen from Equations 1-3, the projection depends on a variableemax and the angle θ. emax is the level of malaria endemicity one wishes to associate with the minimum level of protection (i.e. if ci = 0 and ei = emax thenABCi = 0). The angle θ is a parame-ter that controls the weighting of bed net coverage and malaria endemicity in determining the ABC. Higher val-ues ofθassign more relative weight to the level of malaria endemicity and vice versa. Forθ = 0°,ABCi = ei. When θ =90°,ABCi=ci.
[image:4.595.58.289.626.706.2]b
c
a
0
0.5
1 0 0.2
0.4 0.6
0.8 −0.2
0 0.2 0.4 0.6 0.8
Malaria endemicity Bed net coverage
[image:5.595.58.542.107.578.2]Stable malaria endemicity
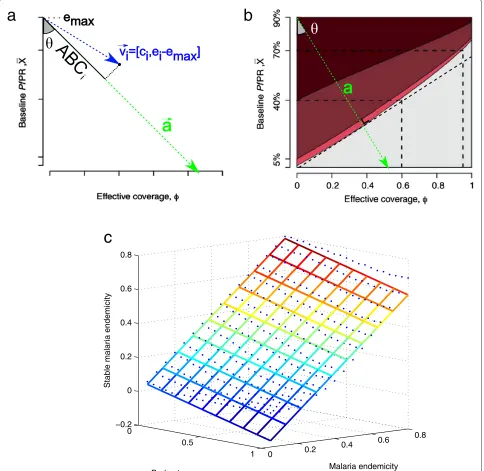
Figure 2Geometrical definition of the adjusted bed net coverage.(a)Geometric definition of the ABC statistic. Populationsicharacterized by bed net coverageciand malaria endemicityeiare projected onto a vectora. This vector is to be chosen such that projectionABCiof regioniis higher for lower values ofciand lower for higher values ofei. By parameterizing the vector using angleθandemaxthe correspondence with external statistics of protection can be optimized. In this paper,θis chosen such thatABCicorresponds with the reduction of malaria endemicity for a given endemicity and bed net coverage as predicted by the model of Smithet al. [7].(b)Figure altered from Smithet al. [7]. For a set of benchmark parameters, the resulting malaria endemicity as a function of baseline endemicity and bed net coverage. The colours represent different endemicity levels (dark red,>40%; red, 5%-40%; pink, 1%-5%; and gray, <1%). In this paper,θwas choosen such that theais orthogonal to the boundary of the area for which the final malaria endemicity is lower than 1%.(c)Results of fitting a linear model to data of Smithet al. [7]. The blue dots represent the predicted final malaria endemicity for a program that scaled-up the bed net coverage from 0 to a specific target level at the end of five years. The grid represents the result of a linear fit of the data. A linear model could fit the data very well (R2=0.97). The regression function was
function of bed net coverage. Choosingaas perpendicular to one of the isocontours as shown in 2b results in an esti-mate forθ of about 34°. Therefore, in the current paper, θ was set to 34°. The parameteremaxwas set to 0.9 as the data presented by Smithet al. [7] did not cover higher lev-els of endemicity. Furthermore, this was well above any of malaria endemicity of the household clusters included in this paper. By parameterizing Equation 3 based on the model of Smithet al. [7], ABC can be seen as proxy for the steady-state malaria burden given the current level of bed net coverage. Filling in the values forθ andemax in Equation 3, results in the following equation (which will be used in the remainder of the paper) withcithe level of bed net coverage in under five year olds andeithePfPR2−10as
provided by the Malaria Atlas Project.
ABCi=0.57+0.43·ci−0.63·ei (4)
Equation 4 shows that the ABC assumes that level of protection is a linear function of both bed net coverage and malaria endemicity (with a larger weight for malaria endemicity). Inspecting Figure 2b suggests that a linear function provides a good approximation of the model of Smithet al. [7]. The authors do not provide the numerical data used in creating the plot in Figure 2b but do pro-vide numerical results for the simulated changes inPfPR for an ITN programme that scales-up bed net coverage for a period of five years. It was found that a linear model could fit these data very well (R2=0.97) assigning a larger
In the Results section, the correlation between the bed net coverage and the ABC will be assessed using the Spearman Rank Correlation (SRC). The SRC assesses how well the ordering based on bed net coverage of different administrative divisions, countries and sub populations is retained by the ABC. Therefore, the SRC gives an indica-tion of the difference in priority order assigned to admin-istrative divisions, countries and sub-populations by the two statistics.
Results
Independence of malaria endemicity and bed net coverage
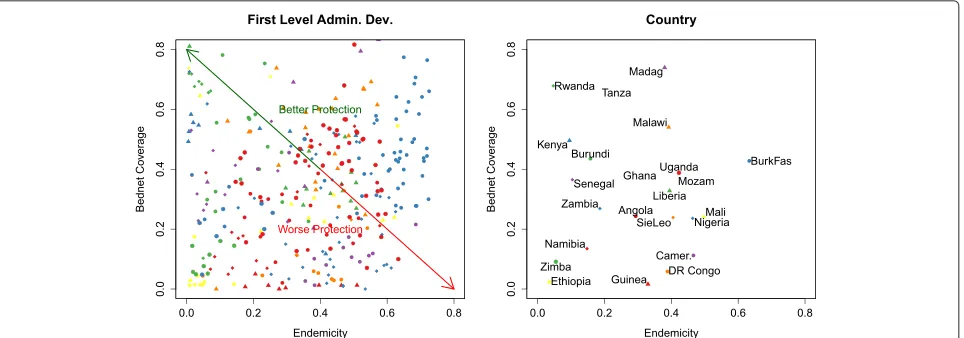
Figure 3, shows the level of bed net coverage in under five year olds in each of the 23 countries as a function of the average level of malaria endemicity. This plot illus-trates the absence of a strong correlation between these measures. Neither for the first level administrative divi-sions [SRC : r= −0.04,p= 0.84] nor at the level of the countries [SRC : r = −0.04,p = 0.84] a significant cor-relation was found between bed net coverage and malaria endemicity.
[image:6.595.59.541.481.650.2]The absence of correlation between bed net coverage and malaria endemicity (Figure 3), indicates that bed net coverage and malaria endemicity are statistically indepen-dent components of protection against malaria infection. This was corroborated by estimating the mutual infor-mation between both variables. An empirical estiinfor-mation of the entropy [8] yielded 3.13 bits and 3.25 bits for bed net coverage and the malaria endemicity in the first
level administrative divisions respectively. As the data was binned into 10 intervals these values approach the maximum entropy value of 3.32 bits (log2(10) ≈ 3.32). The mutual information between both variables was about 0.04 bits confirming the statistical independence of the variables.
The independence of both variables indicates that nei-ther the level of bed net coverage nor the endemicity by itself is sufficient to identify populations with high pri-ority for intervention. Indeed, a given bed net coverage is equally likely to be found in regions with any level of malaria endemicity. This justifies the construction of an ABC which allows taking into account both the level of bed net coverage and malaria endemicity in a region or population.
ABC for countries and first level divisions
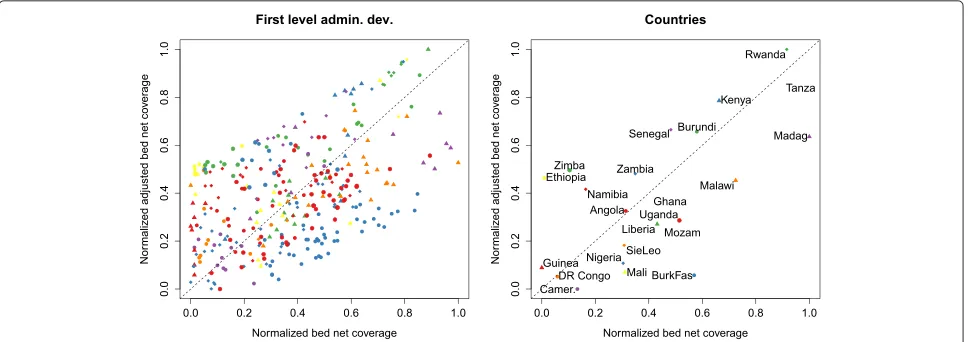
The bed net coverage and ABC correlate significantly but not very strongly, both at the level of the administrative divisions [SRC : r = 0.58,p < 0.01] and at the level of the countries [SRC:r=0.65,p<0.01]. Indeed, Figure 4 shows that ordering countries according to ABC alters the priority order of first level administrative divisions and countries with respect to that obtained by using bed net coverage. For example, Zimbabwe having fairly low bed net coverage rates is better protected when considering the ABC. On the other hand, Malawi, having a high level of bed net coverage has a lower ABC. Other examples are Burkina Faso and Mali which rank lowly on the ABC.
Within countries, the correlation between bed net coverage and ABC of the divisions varies considerably
(Figure 5). In some countries, the SRC was very high (e.g. Rwanda, 0.95). For others, the correlations was about zero (e.g. Tanzania, 0.01) or negative (e.g. Cameroon, -0.57). The comparison between the divisional bed net coverage and ABC for all countries is shown by means of maps in Figure 5.
Slopes of inequality
[image:7.595.58.542.491.662.2]Indicators of socio-economic inequalities of bed net cov-erage are prone to change as well when using the ABC (Figure 6). The slope of inequality was calculated for each country by regressing either the level of bed net cover-age or ABC on the five wealth quintiles. A positive slope indicates that higher wealth quintiles have more bed nets. The slopes obtained by using the bed net coverage were larger than the slopes obtained using the ABC [paired t-test,t(22) = −2.09,p < 0.05]. In addition, the vari-ance of slopes obtained using the ABC was lower than that for the bed net coverage slopes [F(22, 22) = 4.40,p < 0.01]. This indicates that ABC slopes revealed a more consistent tendency for richer households to be better protected across countries. Moreover, while the slopes obtained through both measures correlated significantly [SRC : r = 0.57,p < 0.01] substantial differences in slopes were observed for some countries. For example, in Liberia using the ABC results in a positive slope indicating better protection for richer children while the bed net cov-erage slope showed no statistical difference in protection between children from richer and poorer households. In other countries, including Namibia and Senegal, the sign of the slope changes with the indicator.
0.05 0.10 0.15 0.20 0.25 0.30 0.35 0.40 0.35 0.40 0.45 0.50 0.55 0.3 0.4 0.5 0.6 0.7 0.55 0.60 0.65 0.70 0.75 0.80 0.3 0.4 0.5 0.6 0.7 0.25 0.30 0.35 0.40 0.45
Cameroon (SRC: −0.58) Coverage 0.04 0.06 0.08 0.10 0.12 0.14 0.16 0.18 0.20 0.22 Adjusted coverage 0.24 0.26 0.28 0.30 0.32 0.34 0.36
Congo Democratic Republic (SRC: 0.7) Coverage 0.05 0.10 0.15 0.20 0.25 Adjusted coverage 0.30 0.32 0.34 0.36 0.38 0.40 0.42 0.44
Ethiopia (SRC: 0.35) Coverage 0.00 0.02 0.04 0.06 0.08 0.10 0.12 0.14 0.16 Adjusted coverage 0.0 0.1 0.2 0.3 0.4 0.5 0.6
Ghana (SRC: −0.18) Coverage 0.25 0.30 0.35 0.40 0.45 0.50 0.55 Adjusted coverage 0.35 0.40 0.45 0.50 0.55
Guinea (SRC: −0.19) Coverage 0.00 0.01 0.02 0.03 0.04 0.05 Adjusted coverage 0.25 0.30 0.35 0.40 0.45
Kenya (SRC: 0.57) Coverage 0.40 0.45 0.50 0.55 Adjusted coverage 0.60 0.65 0.70 0.75 0.80
Liberia (SRC: 0.51) Coverage 0.25 0.30 0.35 0.40 0.45 0.50 Adjusted coverage 0.36 0.38 0.40 0.42 0.44 0.46 0.48 0.50 0.52 0.54
Madagascar (SRC: 0.2) Coverage 0.40 0.45 0.50 0.55 0.60 0.65 0.70 0.75 0.80 0.85 Adjusted coverage 0.58 0.60 0.62 0.64 0.66 0.68 0.70 0.72
Mali (SRC: −0.23) Coverage 0.00 0.05 0.10 0.15 0.20 0.25 0.30 Adjusted coverage 0.30 0.35 0.40 0.45 0.50
Mozambique (SRC: −0.24) Coverage 0.10 0.15 0.20 0.25 0.30 0.35 0.40 0.45 Adjusted coverage 0.38 0.40 0.42 0.44 0.46 0.48 0.50 0.52 0.54 0.56
Malawi (SRC: 0.38) Coverage 0.0 0.1 0.2 0.3 0.4 0.5 0.6 0.7 0.8 0.9 Adjusted coverage 0.0 0.1 0.2 0.3 0.4 0.5 0.6 0.7
Namibia (SRC: 0.68) Coverage 0.00 0.05 0.10 0.15 0.20 0.25 0.30 0.35 Adjusted coverage 0.0 0.1 0.2 0.3 0.4 0.5 0.6 0.7
Nigeria (SRC: 0.75) Coverage 0.0 0.1 0.2 0.3 0.4 0.5 Adjusted coverage 0.0 0.1 0.2 0.3 0.4 0.5
Rwanda (SRC: 0.95) Coverage 0.62 0.64 0.66 0.68 0.70 0.72 0.74 0.76 0.78 0.80 Adjusted coverage 0.80 0.82 0.84 0.86 0.88 0.90
Senegal (SRC: 0.39) Coverage 0.25 0.30 0.35 0.40 0.45 0.50 0.55 Adjusted coverage 0.60 0.65 0.70 0.75
Sierra Leone (SRC: −0.6) Coverage 0.20 0.22 0.24 0.26 0.28 0.30 0.32 Adjusted coverage 0.36 0.38 0.40 0.42 0.44 0.46 0.48
Tanzania (SRC: 0.01) Coverage 0.40 0.45 0.50 0.55 0.60 0.65 0.70 0.75 Adjusted coverage 0.60 0.65 0.70 0.75 0.80 0.85
Uganda (SRC: 0.5) Coverage 0.0 0.1 0.2 0.3 0.4 0.5 0.6 0.7 0.8 Adjusted coverage 0.0 0.1 0.2 0.3 0.4 0.5 0.6
Zambia (SRC: −0.13) Coverage 0.20 0.25 0.30 0.35 0.40 0.45 0.50 Adjusted coverage 0.52 0.54 0.56 0.58 0.60 0.62 0.64
[image:8.595.56.541.87.722.2]Zimbabwe (SRC: 0.25) Coverage 0.06 0.08 0.10 0.12 0.14 0.16 Adjusted coverage 0.54 0.55 0.56 0.57 0.58 0.59 0.60 0.61 0.62
Figure 6Slopes of inequalities resulting from bed net coverage and the ABC for all countries.The markers denote the bed net coverage (green) and ABC (purple) for the five wealth quintiles. The lines give the corresponding regression lines and slopes. The bottom right plot shows a scatterplot of both types of slopes. The statistical significance of the slopes, i.e.p<0.01, is indicated by the filled or open squares inside each panel. A filled square indicates a slope significantly different from 0 for the corresponding statistic.
Discussion
In a world with limited resources, allocating budgets should be done in an informed and justified way [9]. Smith et al. [7] argued that intervention planning should be based on the expected reduction in malaria burden. These authors provide a model of the expected malaria bur-den depending both on the endemicity and the achieved bed net coverage. A similar approach, based on the P. falciparumbasic reproductive number under control, was proposed by Gethinget al. [10]. The ABC statistic can be considered as a simple proxy to these suggestions as it allows taking into account both malaria endemicity and bed net coverage. Indeed, by parameterizing Equation 3 based on the model of Smith et al. [7] (i.e. θ = 34°), the ABC is a linear approximation of the steady-state malaria burden given the current level of bed net coverage. Nevertheless, it can be calculated without resorting to a detailed epidemiological model. Indeed, the ABC only requires the current bed net coverage to be known. The malaria endemicity as used in this paper can be freely and simply obtained from the Malaria Atlas Project. In line
with the suggestions by Smithet al. [7] and Gethinget al. [10], it is proposed here to use the ABC statistic when set-ting priorities for intervention. Indeed, recently Omumbo et al. [9] showed that many sub-Saharan countries have access to at least one type of risk map to support the planning of interventions. However, only very few coun-tries actually used this information to specify tailored sub-national? intervention plans or resource allocation. The ABC could be a simple standardized tool to facili-tate the use of risk data in the planning of interventions thereby increasing the success of investments in malaria control.
Ultimately, the ABC as presented in the paper is a linear function derived from reference 8 (Equation 4). However, introducing the ABC using geometrical functions and providing Equation 3 allows for re-parameterization of the projection of the populations onto the relevant dimension in the endemicity/bed net coverage plane.
Malaria Atlas Project (malaria endemicity) and the DHS (bed net coverage). Therefore, the data for calculating the ABC used here are freely available for a large number of countries.
The ABC measure correlates well with the raw bed net coverage but also deviates from it in many instances. Indeed, at three different levels different priority orders have been shown to arise when using the ABC. The order-ing of countries and regions within countries changes when taking into account malaria endemicity. Moreover, at the level of sub-populations within countries, the exis-tence or the absence of socioeconomic inequalities in the level of bed net coverage are not necessarily confirmed when using the ABC.
Additional file
Additional file 1: Supporting text: Listing of the surveys and countries that were omitted from the study.
Competing interests
The authors declare that they have no competing interests.
Authors’ contributions
DV and NS conceived the study and drafted the manuscript. DV performed the analysis. Both authors read and approved the final manuscript.
Acknowledgements
We thank three anonymous reviewers for their helpful comments on an earlier version of this paper. We are grateful to Herbert Peremans for the engaging discussions about the mathematical formulation of the ABC. Published with support of the Universitaire Stichting van België (‘Met steun van de Universitaire Stichting van België’).
Author details
1University Antwerp Faculty of Applied Economics Prinsstraat 13, Antwerp
2000, Belgium.2Faculté de Santé Publique et Institut de recherche Santé et Société, Universite Catholique de Louvain, Place de l’Université, 1, Louvain-la-Neuve B-1348, Belgium.
Received: 7 February 2013 Accepted: 10 July 2013 Published: 20 December 2013
References
1. Eisen L, Eisen R:Using geographic information systems and decision support systems for the prediction, prevention, and control of vector-borne diseases.Annu Rev Entomol2011,56:41–61.
2. Hay S, Okiro E, Gething P, Patil A, Tatem A, Guerra C, Snow R:Estimating the global clinical burden of Plasmodium falciparum malaria in 2007.PLoS Med2010,7:e1000290.
3. Snow R, Guerra C, Noor A, Myint H, Hay S:The global distribution of clinical episodes of Plasmodium falciparum malaria.Nature2005, 434:214–217.
4. Lengeler C:Insecticide-treated bed nets and curtains for preventing malaria.Cochrane Database Syst Rev2004,2:CD000363.
5. Noor AM, Mutheu JJ, Tatem AJ, Hay SI, Snow RW:Insecticide-treated net coverage in Africa: mapping progress in 2000-07.Lancet2009, 373:58–67.
measure matter?Health Policy Plan2009,24:83–93.
7. Smith D, Hay S, Noor A, Snow R:Predicting changing malaria risk after expanded insecticide-treated net coverage in Africa.Trends Parasitol 2009,25:511–516.
8. Hausser J, Strimmer K:Entropy: Entropy and Mutual Information Estimation; 2013. http://CRAN.R-project.org/package=entropy.
[R package version 1.1.8].
9. Omumbo J, Noor A, Fall I, Snow R:How well are malaria maps used to design and finance malaria control in Africa?PLoS One2013,8:e53198. 10. Gething P, Patil A, Smith D, Guerra C, Elyazar I, Johnston G, Tatem A, Hay S:
A new world malaria map: Plasmodium falciparum endemicity in 2010.Malar J2011,10:378.
doi:10.1186/1475-2875-12-457
Cite this article as: Vanderelst and Speybroeck: An adjusted bed net coverage indicator with estimations for 23 African countries.Malaria Journal 201312:457.
Submit your next manuscript to BioMed Central and take full advantage of:
• Convenient online submission
• Thorough peer review
• No space constraints or color figure charges
• Immediate publication on acceptance
• Inclusion in PubMed, CAS, Scopus and Google Scholar
• Research which is freely available for redistribution