Corresponding author: K. A. T. L Kodikara [email protected]
1 School of Civil Engineering & Built Environment Queensland University of Technology – Brisbane, Australia
Model Updating of Real Structures with Ambient Vibration Data
K.A.T.L. Kodikara1, T.H.T.Chan1, T.Nguyen1, D.P. Thambiratnam1
Abstract
It is important to develop reliable finite element models (FEMs) for real structures not only in the design phase but also for the structural health monitoring and life-cycle management purposes. To do so, model updating is often carried out to minimise the discrepancies between FEMs and real structures. Among existing model updating approaches, sensitivity based model updating methods which can be either manual or automated, have proven to be very effective in the application of real structures and have been widely used on flexible bridge structures. However, very few studies were reported on buildings especially those with medium-rise characteristics which are often associated with complicated initial modelling and different degrees of parameter uncertainties. In addition, even-though a handful of studies has been done on manual model updating for bridge structures, not much research has taken into account the influence of external structural components on manual model updating process. To address these issues, two case studies with real structures are established in this research. One is conducted with a 10 story concrete building to demonstrate the importance of having sufficiently detailed initial FEMs in automated model updating of medium-rise buildings and effective use of boundary limits and parameter groups to maintain the physical relevance of the updated FEMs. Other is an investigation with a single span inflexible foot bridge to highlight the necessity to consider external structural components in manual model updating of inflexible structures to develop reliable FEMs. Both case studies employ actual ambient vibration monitoring data obtained from the test structures for the model updating processes.
Keywords
Model updating, finite element modelling, sensitivity analysis, ambient vibration
1 Introduction
towards the derivation of accurate models of structures. These accurate models are useful in many civil engineering applications such as structural health monitoring, damage detection, structural evaluation and maintenance. During the development of the FEMs there are several assumptions and structural idealizations taken into consideration. When the experimental modal identification is carried out for the real structures it is inevitable to experience differences with the developed FEMs. These differences originate from the uncertainties in the simplifying assumptions of structural geometry, materials and inaccurate boundary conditions in the FEM [2]. The purpose of model updating is to adjust the mechanical and materials properties as well as geometrical properties of structural elements in order to obtain a better agreement between numerical and experimental results.
Among many model updating methods available, sensitivity based model updating has been very popular in real
structure applications for the last two decades. Such methods can be either manual where the tuning parameters
changed manually to improve the initial FEMs or automated which is often conducted in iterative manners.
Several successful studies had been reported in using sensitivity based model updating, mostly on flexible
bridge structures such as long span cable stayed bridges [3-10]. However, very few comprehensive studies have
been carried out on automated model updating of building structures [11,12] especially those with medium rise
characteristics. These types of structures are often associated with complicated initial modelling and different
degrees of parameter uncertainties leading to real challenges for the users to establish satisfactory initial FEMs
as well as appropriate updating parameters and ranges. Another issue arisen from previous studies is that even
though several case studies have been done with manual model updating, they were mostly concerned about
flexible-type bridge structures such as cable-stayed bridges and choosing internal structural elements for model
tuning [4,7,10]. As a result, there has been a shortage of studies on inflexible bridge structures (such as short-
and mid-span concrete bridges) and assessing the influence of external structural components on manual model
updating processes.
In order to address some of the aforementioned issues, two case studies of model updating with real structures
are established in this research. The first case study considers a 10 storey building located at Queensland University of Technology (QUT) premises. Due to its low height/width ratio, the structure is considered to be
non-slender and demanding to be calibrated by means of ambient vibration measurements. Further, the structure
is rather complex in terms of internal structural variation such as slab thicknesses and elemental orientations
which are often found in medium-rise buildings. The aim of this case study is, firstly, to demonstrate the
updating. Secondly, it is intended to show how boundary limits and parameter groups based on element types
can be defined for tuning parameters for such types of building structures in order to maintain the physical
relevance of the updated FEM. To expedite the updating process, FEM tools which is a multi-functional
computer-aided engineering program for FEM updating will be used in conducting the automated model updating [13].
The second case study treats a single span foot bridge which is considered to be an in-flexible planar structure with challenging boundary conditions at one of its supports (see Section 3.2 for more details). Manual model updating coupled with systematic sensitivity analysis is used in this study to obtain the high sensitivity elements for each response of every parameter. This case study highlights the importance of taking into account the external structural components (located in the vicinity of the support of the structure under consideration) in the
manual model updating process.
The dynamic characteristics of interest for the model updating are the first few natural frequencies and the corresponding mode shapes. The experimental modal analysis results obtained from the ambient vibration measurements are used to update the FEMs of these two structures.. The experimental output-only modal analysis (OMA) procedure and modal properties obtained for the two case studies are described in the previous research work at QUT [14,15]. It is worth noting that OMA has gained more popularity in comparison to the input-output counterpart in recent years as it is more applicable for monitoring in-service civil structures [16,17]. The details of the two case studies are discussed in the next two succeeding sections before conclusions along with summary of the findings are made.
2 Case Study 1: QUT-SHM Benchmark Building
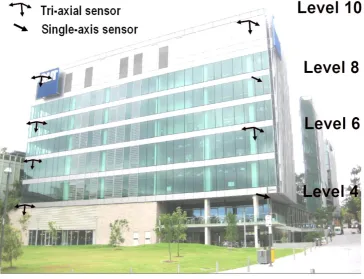
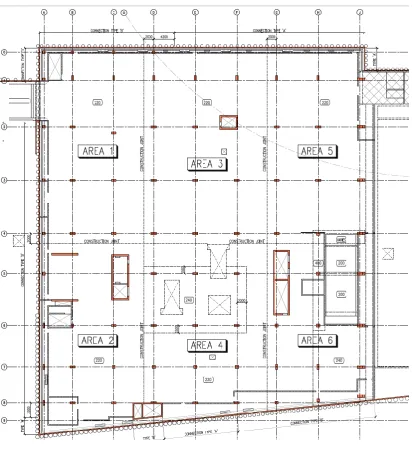
potential wind, lateral seismic loads and torsional forces. An overview of the P block and level 4 layout which can be considered as a typical floor level are presented in Fig. 1 and Fig. 2 respectively.
[image:4.595.116.481.144.423.2]Fig. 2 Level 4 layout of the building
The P block contains a vibration sensing system employing a software-based synchronization method and operating in a continuous monitoring manner. As illustrated in Fig. 1, there are six analog tri-axial accelerometers and two single-axis accelerometers installed to capture the vibration responses of the structure. The sensors were located on the upper part of the building which is globally more sensitive to the ambient excitation sources such as wind loads and human activities. Acceleration data of the sensors were sampled at a frequency of 2000Hz and then split into 30-minute subsets to allow sufficient undisrupted data acquisition
length for modal analysis purposes. Data driven Stochastic Subspace Identification (SSI-data) with unweighted
principal component estimator was selected as the main OMA technique for this case study. For illustration
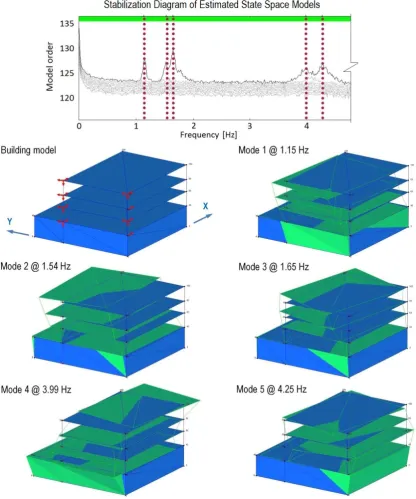
purposes, a typical SSI-data stabilization diagram for OMA of the building is shown in Fig. 3 (upper diagram).
[image:5.595.94.507.67.520.2]frequently excited modes of the building were extracted with high confidence [14]. First five global modes extracted from OMA are illustrated in Fig. 3 (lower diagram) (Table 2 in section 2.1.2 provides more detailed description about the mode shapes). Further details regarding the vibration sensors and data synchronization solutions of P block can be found in Nguyen et al. [15].
Fig. 3 Stabilization diagram and typical animation views of first five modes
[image:6.595.89.506.197.697.2]2.1.1 Initial Finite Element modelling
To study the importance of the initial finite element modelling in medium rise inflexible building structures, a
simple FEM developed during the design process was trialed for the model updating. In this model, the level of
detailing is low in-terms of modelling shear cores and columns. The results were not satisfactory as the original
error for the frequencies of first three global modes is close to 50%. The model updating resulted in over 100%
change to the selected updating parameters, which caused losing the physical relevance of the updated FEM.
Hence, a more detailed FEM was developed using the commercially available software package SAP2000
nonlinear version 15.2.0 [19]. Maximum error of the frequencies for first five global modes is reduced to 17%
which highlights the importance of initial finite element modelling in relatively inflexible structures for model
updating purposes (See Table 1 for more details). The particular considerations taken during the development of
initial FEM are summarized below;
Detailed modelling is considered when modelling the shear cores taking into account major and minor
openings and internal thin walls to make the torsional behaviour of the structure as close as possible to
the real structure
The spandrel beams are modelled as shell elements instead of frame elements
Floor diaphragms are assigned to each floor level to maintain rigid behaviour of floor levels
Since the building cladding fully glazed and all the partitions are light-weight initial investigations
revealed that the effect of mass and stiffness of non-structural elements is negligible, hence not
included in the FEM
The building consists of complex interior slab configurations which makes it impossible to model the
floor slabs in detail. Therefore average slab thicknesses are considered in the initial FEM. This can be
justified since in the automated model updating floor slab thickness can be used as a updating
parameter to account for the simplifying assumption used in initial FEM
The developed initial FEM consists of 9400 local elements (1400 frame elements and 8000 shell elements).
Since the floor system of the building consists of only post-tensioned slabs all the frame elements are
representing columns in the building. Amongst 8000 shell elements 2320 are shear walls and 5680 shell
elements are floor slabs.
To correlate the results between initial FEM and OMA results, the FEM data generated in SAP2000 and test
data were imported into the updating software FEMtools. The Modal Assurance Criterion (MAC) which is a
correlation criterion in statistics used for this purpose.
}) { } })({ { } ({ } { } ({ , ( 2 e T e a T a T e T a e a MAC (1)
Where a and e are analytical and experimental mode shape vectors, respectively. The correlations of
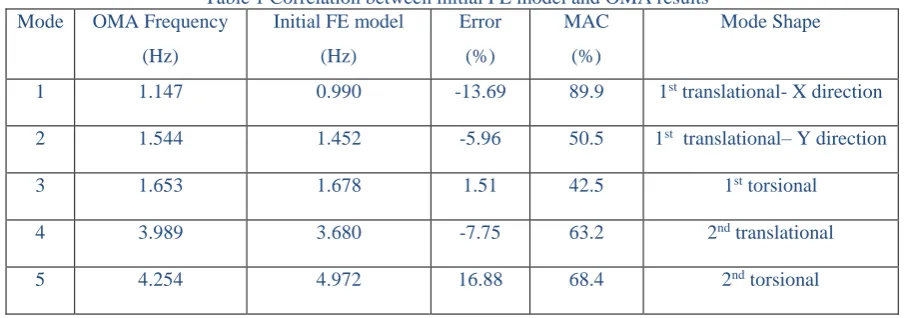
dynamic properties for the first five global modes are tabulated in Table 1. Table 1 show that the correlation was
good in-terms of frequency except for the 1st and 5th mode where the error exceeds 10%. The correlation of
[image:8.595.69.522.339.498.2]mode shapes expressed in-terms of MAC values was not good except for the 1st mode.
Table 1 Correlation between initial FE model and OMA results Mode OMA Frequency
(Hz)
Initial FE model
(Hz) Error (%) MAC (%) Mode Shape
1 1.147 0.990 -13.69 89.9 1st translational- X direction
2 1.544 1.452 -5.96 50.5 1st translational– Y direction
3 1.653 1.678 1.51 42.5 1st torsional
4 3.989 3.680 -7.75 63.2 2nd translational
5 4.254 4.972 16.88 68.4 2nd torsional
2.1.3 Model Updating
Even though the initial FEM developed produce good correlation compared to the model used by the designers
for static analysis, the correlation is not satisfactory for dynamic analysis purposes. Hence, model updating was
used to improve the FEM.
According to Brownjohn, Xia [20], successful model updating depends on choosing correct number of
responses, appropriate selection of updating parameters. Initial studies carried out on response selection revealed
that selection of OMA frequencies and OMA mode shape ordinates for the first five modes produce good results
in model updating. Hence, the frequencies and associated mode shape pairs of first five modes were selected for
the model updating.
As stated earlier, selection of appropriate updating parameters is vital for a successful model updating. The
in the FEM. Otherwise, the updated model will produce physically meaningless updated parameters. Further, it
is necessary to select the updating parameters that are most sensitive to the selected responses [3]. Sensitivity
analysis is carried out to choose the appropriate parameters for the model updating.
Since the parameters chosen are of different types, normalized relative sensitivities have been used for the
sensitivity analysis.
j j j rP
P
R
S
(2)
S
r = Relative sensitivity matrix;
P
j = A diagonal, square matrix holding parameter valuesThe sensitivity matrix is obtained by finite difference method. Then the relative sensitivities have been
normalized with respect to the response values.
(3)
S
n = Normalized relative sensitivity matrix;
R
i = A diagonal, square matrix holding the response valuesWhen selecting the local elements for the model updating, initially all the possible uncertain parameters can be
used, but through sensitive analysis low sensitivity parameters should be eliminated for more effective updating
process. In structural modelling there are always uncertainties associated with the cross sectional areas of
elements, stiffness of elements and boundary conditions of the structure. However the uncertainties in boundary conditions such as arbitrary structural configurations and variations at the boundary are difficult to deal within automated model updating of large civil engineering structures. Hence in this case study only the parameters that can be systematically coped are considered for sensitivity analysis and later for automated model updating. The uncertain parameters included in the sensitivity analysis are Young’s modulus mass density of all local
elements (9400 local elements each), cross sectional area, torsional stiffness, bending moment of inertia about Y
direction and Z direction of all columns (1400 local elements each) and shell thickness of floor slabs (5680 local
elements). Hence, the total parameter space used for the sensitivity analysis is 30080 local parameters.
Then through normalized sensitivity analysis, sensitive local elements for each response are identified and
selected for the automated model updating. The parameter sets are defined in order to make the model updating
more realistic and meaningful. For an example, for the selected parameters for columns (frame elements), sets
are defined based on individual columns, except for the shell thickness. No sets are used for the shell elements
and in automated model updating allow varying in local shell element basis. As stated in section 2.1.1, since the
actual internal variation of slab thickness is impossible to model, in most cases average slab thicknesses are used
in the initial FEM. Hence, it is justifiable to allow variation of slab thickness in shell element level. Summary of
all the sets defined for the identified high sensitive elements are presented in Table 2.
After selection of responses and parameters, automated model updating is carried out. The selected parameters
are estimated by an iterative process in the updating procedure. Sensitivity-based parameter estimation coupled
with pseudo-inverse parameter estimation is used as the updating algorithm. The functional relationship between
the modal characteristics and the structural parameters can be expressed in terms of a Taylor series expansion
limited to linear terms.
})
{
}
]({
[
}
{
R
e
C
S
P
u
P
0(4)
}
]{
[
}
{
R
S
P
(5)}
{
R
e = Experimental data}
{
R
a = Predicted system responses for a given state{
P
0}
of the parameter values}
{
P
u = Updated parameter valuesSince the Taylor’s expansion is truncated after the first term, the neglected higher order terms necessitate several
iterations, especially when
{
R
}
contains large values.Pseudo-inverse of the sensitivity matrix is calculated to determine the desired parameter variation.
}
{
]
[
])
[
]
([
}
{
P
S
tS
1S
t
R
(6)
The least squares solutions obtained from the above equation will minimize the residue:
}
{
}
]{
[
}
{
residue
S
P
R
(7)In order to obtain physically realisable and meaningful values for updating parameters upper and lower bounds
are used in the updating procedure. If a parameter reaches its allowable maximum/minimum value during any
iteration, the parameter will be made inactive for the rest of the model updating. Upper and lower bounds used
for all the parameters are tabulated in Table 2. Higher upper and lower bounds are used for the shell thickness of
The automated updating process will be stopped when a given residue value is achieved, or a given minimum
improvement between two consecutive iterations is achieved or maximum number of iterations achieved. In this
case study the above mentioned values are as follows;
Minimum residue value is 0.1%
Minimum improvement between two consecutive iterations 0.01%
[image:11.595.71.535.294.440.2] Maximum number of iterations 100
Table 2 Parameters selected for the model updating and the implemented limits
Parameter Group Minimum Limit Maximum Limit
Young’s Modulus (E) Element-Shell type -15% +15%
Mass Density () Element-Shell type -15% +15%
Cross Sectional Area (AX) Element type -15% +15%
Torsional Siffness (IX) Element type -15% +15%
Bending Moment of Inertia about Y (IY) Element type -15% +15%
Bending Moment of Inertia about Z (IZ) Element type -15% +15%
Shell Thickness (H) Individual shell elements -30% +30%
2.2 Model Updating Results
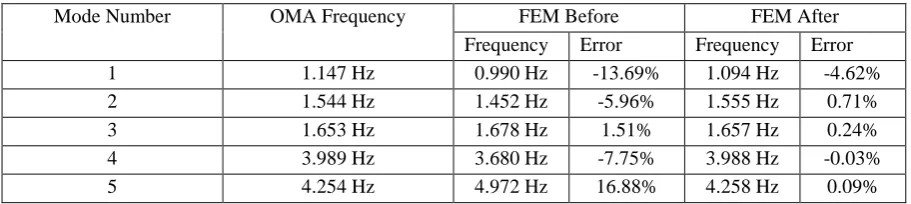
The automated procedure stops after 39 iterations due to the minimum improvement between two consecutive improvements falls below the established value of 0.01%. The updated model results are summarized in Table 3. The table shows the OMA frequencies and the FEM frequencies for both before and after updating for the first five natural modes. From the table it can be seen that four FEM modes match the corresponding OMA modes with 1.3% or less error which is considered to be an excellent match. The largest error is 4.6% for the first mode which is still a very good match for practical purposes considering the scale of the structure.
Table 3 Comparison of first five natural frequencies of the P block before and after model updating
Mode Number OMA Frequency FEM Before FEM After
Frequency Error Frequency Error
1 1.147 Hz 0.990 Hz -13.69% 1.094 Hz -4.62%
2 1.544 Hz 1.452 Hz -5.96% 1.555 Hz 0.71%
3 1.653 Hz 1.678 Hz 1.51% 1.657 Hz 0.24%
4 3.989 Hz 3.680 Hz -7.75% 3.988 Hz -0.03%
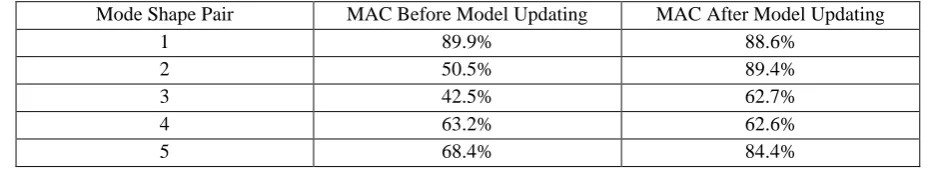
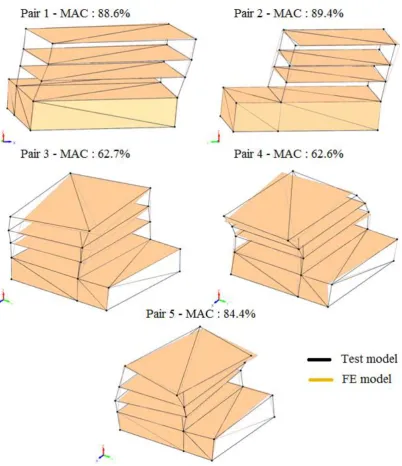
[image:11.595.71.527.667.769.2]The Modal Assurance Criterion (MAC) values for the mode shapes are also considered in the model updating. Table 3 shows the MAC values for each mode shape pair before and after updating the model. A graphical comparison of mode shapes of FEM and OMA is shown in Fig. 4. From Table 4 it can be seen that there are three pairs matching with 84% or higher MAC values. The other two modes also have a reasonable match with over 60% MAC values. This can be considered as an acceptable result considering the complexities of the structure’s details and boundary conditions as previously mentioned as well as the limited number of sensors used for measurement.
Table 4 Comparison of MAC values for mode shape pairs before and after model updating Mode Shape Pair MAC Before Model Updating MAC After Model Updating
1 89.9% 88.6%
2 50.5% 89.4%
3 42.5% 62.7%
4 63.2% 62.6%
5 68.4% 84.4%
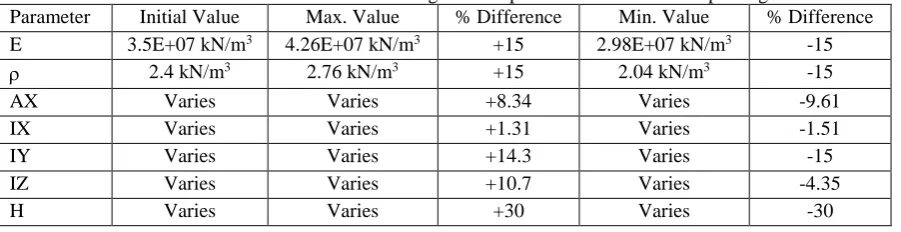
Table 5 summarises the parameter changes after updating the FEM. Since the upper and lower limits are introduced to each parameter, the outcomes are realistic and meaningful. A variation of 15% for material properties such as the E value and value can be allowed for certain elements of a structure from the design values due to various reasons such as changes of concrete batches etc. Considering the maximum and minimum changes to the above mentioned parameters, the results are physically realisable. In the updated model there are two aspects to justify for the shell thickness of the floor slab elements which are the variation limit for the thickness and the choice of no grouping for shell elements. The rationale of no grouping for shell element thicknesses is that according to the as built drawings the slab thicknesses vary significantly in small portions so this type of grouping is impractical. The reason for choosing 30% variation limit is that in some areas actual
thickness is 30% higher or lower from the average values used in the initial FEM. while according to the as
built drawings the slab thicknesses vary significantly in small portions. Hence these two setups for the shell
element level is justifiable for this particular case study.
To highlight the importance of the model updating procedure adopted in this research, it is worth comparing the
results of this study with the results of similar cases reported in literature. Previously mentioned (In section 1)
Pair 4 @ MAC Value 62.6%
modes. The largest error in terms of frequency and maximum MAC value for the mode shape pairs is 13.3% and
85% respectively as opposed to the 4.6% and 89.4% in this case study. Further, in the aforementioned case
study most tuning parameters achieved higher variation from the initial values such as E values of floor slabs
70% and I values of columns 50% which tend to cause the loss in physical relevance of the updated FEMs.
However, in this research most of the parameter variations were limited to 15% (including E values of floor
slabs and I values of columns) except the shell thickness of the slabs a higher variation (30%) is used for
[image:13.595.75.526.243.359.2]legitimate reasons.
Table 5 Maximum and minimum changes to the parameters after model updating
Parameter Initial Value Max. Value % Difference Min. Value % Difference
E 3.5E+07 kN/m3 4.26E+07 kN/m3 +15 2.98E+07 kN/m3 -15
2.4 kN/m3 2.76 kN/m3 +15 2.04 kN/m3 -15
AX Varies Varies +8.34 Varies -9.61
IX Varies Varies +1.31 Varies -1.51
IY Varies Varies +14.3 Varies -15
IZ Varies Varies +10.7 Varies -4.35
H Varies Varies +30 Varies -30
Pair 2 @ MAC Value 89.4% Pair 3 @ MAC Value 62.7%
Fig. 4 Comparison of FEM mode shapes of updated model and OMA mode shapes of P Block
3. Case Study 2: QUT-SHM Benchmark Foot Bridge
[image:14.595.85.488.69.536.2]Fig. 5 Overview (left) and layout (right) of the Foot Bridge
Even though the structure is inflexible, the number of sensors is limited and the ambient vibration conditions are quite challenging, the first two modes of the footbridge are identified (with the computer program ARTeMIS ) which serves the purpose of model updating application presented in this paper. .As illustrated in Fig. 6, the first mode is a first order bending mode while the second one is a first order torsional mode.
Fig. 6 First two mode shapes of the foot bridge
3.1 Model Updating Procedure
As with the case study of the benchmark building structure, a FEM was developed using SAP2000. The as-built drawings have been used in order to represent the real structure as accurately as possible.
[image:15.595.74.514.81.290.2] [image:15.595.72.523.421.518.2]directions (26 X 3 = 78), rotational stiffness of spring elements in X, Y and Z directions (26 X 3 = 78), young’s
modulus of concrete deck shell elements (361), mass density of concrete deck shell elements (361) and shell
thickness of concrete deck elements (361) The sensitivity of each local element for each local parameter is
tested against the target responses. Since only the first two natural frequencies and the associated mode shapes are available for model updating only four target responses are chosen for the sensitivity analysis purpose. They are:
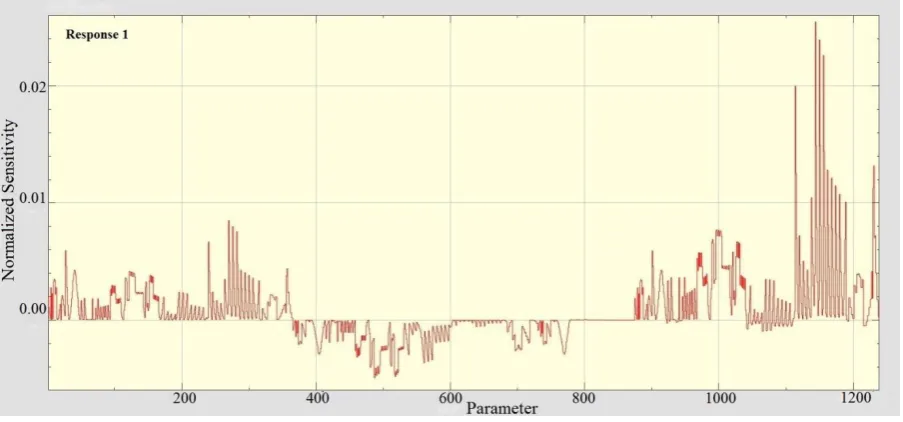
Frequency of mode number 1 (Response 1)
Frequency of mode number 2 (Response 2)
Mode shape of mode 1 (Response 3)
Mode shape of mode 2 (Response 4)
Following this, the highest sensitive elements are figured out and tabulated for each parameter. The outcomes of the sensitivity analysis are then analysed against the likelihood of occurrence. Finally the respective parameters of the selected elements are changed and the response of the FEM is observed. This procedure is repeated until there is a good match between the FEM and OMA results.
3.2 Model Updating Results
Fig. 7 Normalized sensitivities vs. uncertain parameters (Response 1)
[image:17.595.73.525.72.283.2] [image:17.595.73.526.326.536.2]Fig. 9 Normalized sensitivities vs. uncertain parameters (Response 3)
Fig. 10 Normalized sensitivities vs. uncertain parameters (Response 4)
A trial and error process is then carried out by changing the slab thicknesses of those local elements and observing the changes to the responses. Table 6 summarises the frequencies and MAC values for the first two modes before and after performing several trial and error processes
.
Table 6 Comparison of the first two natural frequencies before and after model updating Mode
Number
OMA Frequency
FEM Before FEM After MAC
Before
MAC After Frequency Error Frequency Error
1 14.88 Hz 13.1 Hz -11.96 % 14.30 Hz -3.90 % 86.4 % 83.4 %
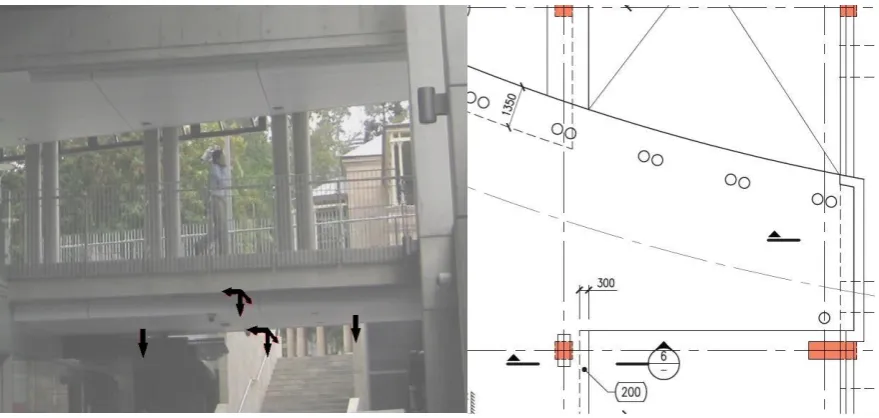
[image:18.595.71.524.324.535.2] [image:18.595.73.529.672.730.2]Table 6 provides the resultant change for the shell thickness of each local element considered in the model updating of the foot bridge. The table shows a significant change with an increase in shell thickness of 166.67% for 10 local elements and 300% increase for 5 local elements. However, interestingly in the real structure very close to the strip of local elements considered for model updating there is a beam at the boundary of the footbridge with a 1000mm depth for 2/3rd of the span and 1500mm depth for remaining 1/3rd of the span. Since
the beam is not part of the original foot bridge, this was not considered in the initial FEM. However, by using the sensitivity analysis of the structure it is found that such an adjacent structural component is crucial for the FEM to represent the actual structure in terms of modal behaviours and that the model updating process has successfully resolved this. For illustration purposes, the view at the particular boundary is shown in Fig. 11(left) while Fig. 11 (right) shows an extruded view of SAP2000 model after updating the foot bridge. It is also noted that there is no improvement to the MAC values for both the modes. As discussed in the previous case study the MAC values can be seen as acceptable considering the complexities of the structure’s boundary conditions and the limited number of sensors used for measurement. A reason for the lack of improvement of MAC values is that even though the shell thickness has a higher sensitivity for the first 2 natural frequencies, some of the local elements have a positive correlation and some elements have a negative correlation (refer Fig. 9 and Fig. 10) for the mode shapes. The results can be further improved by conducting automated model updating after successful manual model tuning of the initial FEM [4,10,7]. However, since the main purpose of this case is to focus only
on some aspects of manual model updating, further improvement of the FEM through automated model
[image:19.595.74.521.547.769.2]updating is beyond the scope of the case study.
Table 7 Parameter changes before and after model updating Local Element Number Initial Shell Thickness
mm
Final Shell Thickness mm
Percentage Difference %
367 375 1000 166.67
307 375 1000 166.67
301 375 1000 166.67
295 375 1000 166.67
289 375 1000 166.67
355 375 1000 166.67
349 375 1000 166.67
343 375 1000 166.67
337 375 1000 166.67
283 375 1000 166.67
331 375 1500 300
325 375 1500 300
319 375 1500 300
405 375 1500 300
Fig. 11 View at the boundary and the extruded view of the updated SAP model
4. Conclusions
The model updating procedure has been successfully carried out for two case studies, the P block and the foot bridge. These case studies show that it is possible to accomplish effective model updating techniques for real civil engineering structures but greater care needs to be taken when dealing with complex concrete structures not only in automated model updating but also in manual model updating applications. On one hand, even
though automated model updating is efficient in real civil structure applications, the first case study herein
showed that it is necessary to develop sufficiently detailed initial FEMs to obtain satisfactory correlation using
automated model updating of medium-rise inflexible building structures. In addition, it was shown that how
parameter groups based on element types (such as columns) and reasonable upper/lower limits based on
engineering judgement (such as 30% for slab thickness and 15% for other tuning factors herein) should be
introduced onto the tuning parameters to maintain the physical relevance of the updated FEMs. On the other
hand, the second case study highlighted the importance of considering the external structural components in the
vicinity of the main structure when conducting manual model updating of inflexible structures such as
short-span concrete bridges. The advantage of manual model updating is that a significant change can be made for
certain elements if it is physically meaningful and justifiable, which is very useful in dealing with complex local conditions as demonstrated in the second case study.
REFERENCES
1. Liu Y, Li Y, Wang D, Zhang S (2014) Model Updating of Complex Structures Using the Combination of Component Mode Synthesis and Kriging Predictor. The Scientific World Journal 2014:476219
2. Jaishi B, Ren WX (2005) Structural finite element model updating using ambient vibration test results. Journal of Structural Engineering 131 (4):617-628
3. Brownjohn JM, Xia P-Q (2000) Dynamic assessment of curved cable-stayed bridge by model updating. Journal of Structural Engineering 126 (2):252-260
4. Živanović S, Pavic A, Reynolds P (2007) Finite element modelling and updating of a lively footbridge: The complete process. Journal of Sound and Vibration 301 (1):126-145
5. Zhang Q, Chang T, Chang C (2001) Finite-element model updating for the Kap Shui Mun cable-stayed bridge. Journal of Bridge Engineering 6 (4):285-293
6. Brownjohn JMW, Moyo P, Omenzetter P, Lu Y (2003) Assessment of highway bridge upgrading by dynamic testing and finite-element model updating. Journal of Bridge Engineering 8 (3):162-172
7. Park W, Kim H-K, Jongchil P (2012) Finite element model updating for a cable-stayed bridge using manual tuning and sensitivity-based optimization. Structural Engineering International 22 (1):14-19
8. Kim J-T, Ho D-D, Nguyen K-D, Hong D-S, Shin SW, Yun C-B, Shinozuka M (2013) System identification of a cable-stayed bridge using vibration responses measured by a wireless sensor network. Smart Struct Syst 11 (5):533-553
9. Cismaşiu C, Narciso AC, Amarante dos Santos FP (2015) Experimental Dynamic Characterization and Finite-Element Updating of a Footbridge Structure. Journal of Performance of Constructed Facilities 29 (4):04014116. doi:10.1061/(asce)cf.1943-5509.0000615
10. Daniell WE, Macdonald JH (2007) Improved finite element modelling of a cable-stayed bridge through systematic manual tuning. Engineering Structures 29 (3):358-371
11. Lord J-Fo (2003) Model updating of a 48-storey building in Vancouver using ambient vibration measurements.
12. Ventura C, Lord J, Turek M, Brincker R, Andersen P, Dascotte E FEM updating of tall buildings using ambient vibration data. In: Proceedings of the Sixth European Conference on Structural Dynamics (EURODYN), 2005. pp 4-7
14. Nguyen T, Chan THT, Thambiratnam DP (2014) Field validation of controlled Monte Carlo data generation for statistical damage identification employing Mahalanobis squared distance. Structural Health Monitoring 13 (4):473-488
15. Nguyen T, Chan THT, Thambiratnam DP, King L (2015) Development of a cost-effective and flexible vibration DAQ system for long-term continuous structural health monitoring. Mechanical Systems and Signal Processing Vol 64-65, 2015 (December 2015):313-324
16. Nguyen T, Chan THT, Thambiratnam DP (2014) Effects of wireless sensor network uncertainties on output-only modal-based damage identification. Australian Journal of Structural Engineering 15 (1):15
17. Nguyen T, Chan THT, Thambiratnam DP (2014) Effects of wireless sensor network uncertainties on output-only modal analysis employing merged data of multiple tests. Advances in Structural Engineering 17 (3):319-330
18. Structural Vibration Solutions A/S (2011) SVS-ARTeMIS Extractor-Release 5.3, User's manual. Aalborg-Denmark,
19. Computers & structures Inc. (2014) Integrated software for Structural analysis & design, Computers & structures, Inc., Berkeley, California, USA, V. 15.2.0.