BEHIND WEDGES AT ANGLE OF ATTACK
Thesis by Jiunn-Jenq Wu
In Partial Fulfillll1ent of the Requirell1ents For the Degree of
Aeronautical Engineer
California Institute of Technology Pasadena, California
1971
ACKNOWLEDGEMENTS
The author wishes to express his sincere appreciation to
Professor WilhelITl Behrens for his helpful guidance during the course of this research prograITl and to Professors Toshi Kubota and Lester Lees for their interest, suggestions and support of this research
program. The author is also grateful to Messrs. P. Baloga, S. Roman, J. Van Dijk, G. Van Halewyn and H. Mazurowski of the GALCIT
hypersonic wind tunnel for their assistance during the experimental tests; to Mr. G. Carlson and the staff of the GALCIT Aeronautics Shop for constructing the experimental equipITlent; to Mrs. Truus Van Harreveld for her assistance in data reduction; and to Mrs. Virginia Conner for the excellent typing of the manus cript.
The author wishes to tha,nk his wife Janice for her encourage-ment and her participation in the processing and reduction of the experimental ITleasureITlents.
ABSTRACT
Experimental measurements of mean flow properties of hypersonic wakes behind wedges of 20° included angle were conducted for angles of attack up to' 25° at Mach number 6, with Reynolds number
based on wedge base height ranging from 7000 to 55000. The near and
far wake structures were determined, including streamlines and velocity
profiles, over a downstream distance of 60 base heights. The base
pressure is insensitive to angle of attack within about 17°. At higher
incidence, flow separation occurs on the leeward surface. The far
vis cous wake (x/H :2: 4) changes with increasing angle of attack mainly
because of the increasing differences of the invis cid flow pa rameters
at the leeward and windward edges of the viscous wake. Transition
TABLE OF CONTENTS
Part Title Page
Acknow ledg ements ii
Abstract iii
Table of Contents iv
List of Tables Vi
List of Figures vii
List of Symbols xii
I. INTRODUC TION 1
II. EXPERIMENTAL APPARATUS AND TECHNIQUES 4
II. 1. GAL CIT Hypersonic Wind Tunnel 4
II. 2. Models 4
II. 3. Static Pressure Measurements 6
II. 4. Pitot Pressure Measurements 7
II. 5. Flow Visualization 7
III. DATA REDUCTION AND ACCURACY ESTIMATE 9
III. 1. Discussion of the Measured Data 9
III. 2. Base Pressure 10
III. 3. Static Pres sure 10
III. 4. Pitot Pres sure 12
III. 5. Location of Flow Separation on Leeward
Surface 16
Ill. 6. Data Reduction Procedure 16
IV. RESULTS AND DISCUSSION 21
IV. 1. Far Wake Flowfield 21
IV. 1. 1. Pressure Field and Viscous Wake
Table of Contents (Cont'd)
Part Title
V.
IV. 1. 2. Viscous Wake Width and Minimum and Maximum Properties
IV. 1. 3. Transition
IV. 1. 4. Far Wake Profiles and Streamlines IV.2. Laminar Near Wake Flow
IV. 2.1. Base and Surface Pressures IV. 2. 2. Near Wake Velocity Profiles IV. 2. 3. Flow Separation and Near Wake
Flowfie1d SUMMARY OF RESULTS
V.1. Far Wake F10wfield
V.2. Laminar Near Wake Flow REFERENCES
APPENDIX. An Invariant Along a Far Wake Streamline
TABLES FIGURES
Page
25 27 28
29
30
31
32 34 34 36
37
Number
I
II III
LIST OF TABLES Title
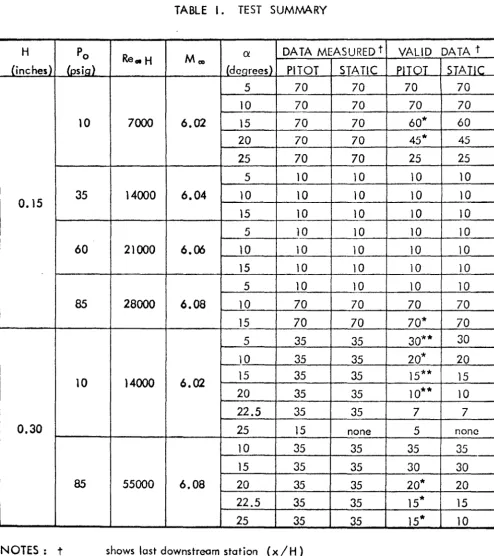
Test Summary
Summary of Leading Edge Shock Angles Location of Flow Separation on Leeward Side Surface of 20° Wedges Determined by Flow Visualization
Page 42 43
LIST OF FIGURES
Number Title
1 Typical Results from Inviscid Flow Model
(Shock-Expansion Theory) 2 2b 3 4 5 6 7a 7b 7c 7d 7e 8 9 lOa lOb 10c 10d 11 a lIb
Model Design H
=
0.3 in.Model Design H = O. 15 in.
Coordinate System Typical Raw Data
Sketch of Two-Dimensional Region of Test . Shock Waves Inside the Tunnel
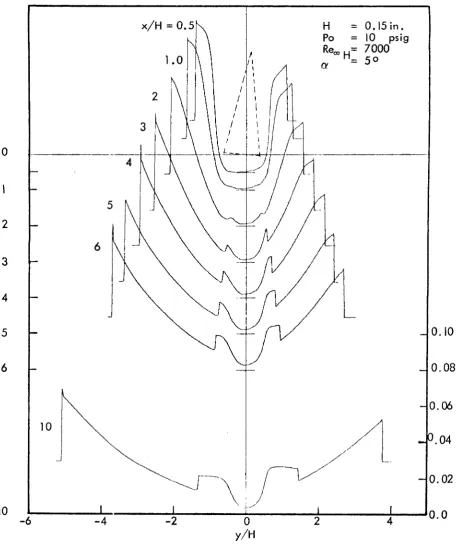
Pitot Pres sure Traces, Re = 7000, a
=
5°oo,H
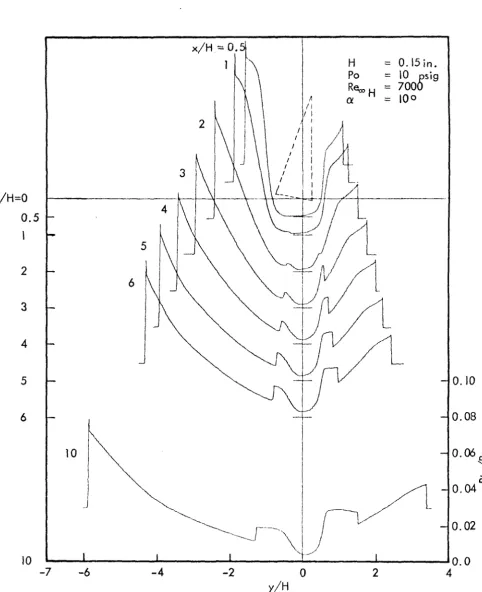
Pitot Pres sure Traces, Re = 7000, a
=
10°oo,H
Pitot Pressure Traces, Re
=
7000, a = 15°oo,H
Pitot P res sure Traces, Re = 7000, a
=
20°oo,H
Pitot Pres sure Traces, Re
=
oo,H 7000, a
=
25° Variation of Pitot Pres sure and Total Pres sure Across Oblique Shock Waves with Normal Com-ponent of Upstream Mach NumberTypical Near Wake Profiles (No Reverse Flow)
Streamwis e Static Pres sure Traces, H = O. 15 in.,
Re H = 7000
00,
Streamwise Static Pressure Traces, H = 0.15 in.,
Re H = 28000
00,
Streamwise Static Pressure Traces, H = 0.15 in.,
Re H = 14000
00,
Streamwise Static Pres sure Traces, H = O. 15 in.,
Re H = 21000
00,
Streamwise Static Pres sure Traces, H = O. 3 in.,
Re
oo
,
H=
140~0Streamwise Static Pres sure Traces, H = O. 3 in. ,
Re H
=
55000List of Figures (Cont'd)
Nurn.ber Title
12a Strearn.wise Static Pressure Traces, H = 0.3 in.,
Re H
=
1400000, 12b
13a
13b
13c
14a
14b
14c
14d
14e
15a 15b 15c 16
17
18
19
Streamwise Static Pressure Traces, H = 0.3 in.,
Re H = 55000
00,
Streamwise Static Pressure Traces at Various
Reynolds Nurn.bers,H
=
0.15 in., a=
5°Streamwise Static Pressure Traces at Various
Reynolds Nurn.bers, H
=
O. 15 in., a=
10°Strearn.wise Static Pres sure Traces at Various
Reynolds Nurn.bers, H
=
O. 15 in., a=
15°Streamwise Flow Cha racteristics, Re
=
7000,a
=
5° oo,HStreamwise Flow Characteristics, Re
=
7000,a
=
10° oo,HStreamwise Flow Characteristics, Re = 7000,
a
=
15° oo,HStreamwise Flow Characteristics, Re
=
7000,a
=
20° oo,HStreamwise Flow Characteristics, Re H = 7000,
a = 25° 00,
Viscous Wake Edge Velocities, x/H = 10
Viscous Wake Edge Mach Numbers, x/H = 10
Viscous Wake Edge Temperatures, x/H = 10
Far Wake Static Pressure Compared to Results of Inviscid Estimate
Normalized Velocity Difference between the Two Vis cous Wake Edges
Normalized Mach Number Difference between the Two Vis cous Wake Edges
Normalized Temperature Difference between the Two Vis cous Wake Edges
Page
62
62
63
63
64
65
66
67
68
69
70 71 72
73
74
75
Number 20 2Ia 2Ib 2Ic 2Id 22a 22b 22c 22d 23a 23b 23c 23d 24a 24b 24c 24d 25 26a
List of Figures (Cont'd) Title
Far Wake Slipstream Inclination
Wake Thickness, H = 0.15 in., Re H = 7000
00,
Wake Thickness, H
=
0.3 in., Re H=
1400000,
Wake Thickness, H
=
0.15 in., Re H=
2800000,
Wake Thickness, H
=
0.3 in., Re H=
5500000,
Variation of Minimum Velocity, H = 0.15 in.,
Re H = 7000
00,
Variation of Minimum Velocity, H = 0.3 in.,
Re H = 14000 '
00,
Variation of Minimum Velocity, H = O. 15 in .•
Re H
=
2800000,
Variation of Minimum Velocity, H
=
0.3 in.,Re H =: 55000
00,
Variation of Minimum Mach Number, H = 0.15 in.,
Re H =: 7000
00,
Variation of Minimum Mach Number, H
=
0.3 in.,Re H =: 14000
00,
Variation of Minimum Mach Number, H = O. 15 in.,
Re H:: 28000
00,
Variation of Minimum Mach Number, H:: O. 3 in.,
Re H =: 55000
00,
Variation of Maximum Temperature, H:: 0.15 in.,
Re H =: 7000
00,
Variation of Maximum Temperature, H =: O. 3 in.,
Re H =: 14000
00,
Variation of Maximum Temperature, H = O. IS in.,
Re H =: 28000
00,
Variation of Maximum Temperature, H
=
O. 3 in. ,Re H =: 55000
00,
Transition Analysis
Normalized Velocity Defects (Laminar Wake),
Re 00, H:: 7000 , a = 15°
List of Figures (Cont'd)
Number Title Page
26b Normalized Mach Number Defects (Laminar Wake)
Re H = 7000, a = 15° 96
00,
26c Normalized Temperature Excesses (Laminar Wake)
Re H = 7000, 0' == 15° 97
00,
27a Normalized Velocity Defects, Re H = 28000
a = 15°, xTR/H = 16.5 00, 98
27b
27c
28a
28b
29a 29b 30a 30b 3Ia 3Ib 32a
32b
32c
32d
Normalized Mach Number Defects, Re H= 28000
a = 15°, xTR/H = 16.5 00,
Normalized Temperature Exces ses, Re H = 28000
a = 15°, xTR/H = 16.5 00,
Velocity Defects Plotted in Transformed y-ScaIe, Re H = 7000, a ::: 15°
00,
Velocity Defects Plotted in Transformed y-Scale, Re H = 28000, a = 15°
00,
Far Wake Streamlines, Re H = 7000, a = 15°
00,
Far Wake Streamlines, Re H = 28000, a = 15°
00,
Base Pressure, H = 0.15 in. Base Pressure, H = 0.3 in.
Correlation of Base Pressure, Re H = 14000
00,
Correlation of Base Pressure, Re H = 28000
00,
Near Wake Velocity Profiles, Re H = 55000
a ::: 10° 00,
Near Wake Velocity Profiles, Re H = 55000
a = 15° 00,
Near Wake Velocity Profiles, Re H = 55000
a
=
20° 00,Near Wake Velocity Profiles, Re H = 55000,
a = 250 00,
99
100
101
102 103 104 105 106 107 108
109
110
I I I
Number 33a 33b 33c 33d
List of Figures (Cont'd) Title
Near Wake Flowfield, Re H:: 55000, a :: 10° 00,
Near Wake Flowfield, Re H::: 55000, a :: 15°, 00,
Near Wake Flowfield, Near Wake Flowfield,
Re H:: 55000, a :: 20°
00,
Re H:: 55000, a :: 25°
00,
LIST OF SYMBOLS
H total bas e height
I an invariant along a far wake streamline
(=
~
H[lY
pU(UeZ-U)dy+
lYe
1 PU(Ue1-U)dy])Pe e
YeZ
yM Mach number
P=p Pressure
P
tZ Pitot pressure
Po =P
too free stream total pressure
Re ' Reynolds number
T temperature
U streamwise velocity
V transverse velocity
x streamwise coordinate
y transverse coordinate
y
U Y/H
transformed transverse coordinate
~
U e(R
....
-e-00-,-H-1o
f
d(i'I»)
00 00
a angle of attack
P density
,.
shear stressx
hypersonic viscous interaction parameter(=
streamline
(=
f:
P U dy )Subscripts
b base
leeward edge of vis cous wake windward edge of viscous wake
List of Symbols (Cont'd) o initial condition
t local stagnation quantity TR transition
1 upstream of shock 2 downstream of shock
3 downstream of second shock
INTRODUCTION
Great efforts have been made in the last decade trying to under-stand hypersonic wakes. The problems encountered in hypersonic wakes and progress made up to 1964 were discussed in a paper by Lees.(l) A review of later developments was given by Lykoudis.(2) Because of the complex nature of this subject, most of the detailed flow field studies were limited to wakes of non-lifting, two-dimension-al (fo r example, refs. 3 -6) and axisymmetric (for example, refs. 7, 8) bodies. Theoretical studies were naturally carried out at the same time (for example, refs. 9-11). In many cases reentry bodies are nonsymmetric or are flying at angles of attack.(12) Relatively little is known about hypersonic wakes of lifting bodies, for example sym-metrically shaped bodies at angle of attack, even though studies have been made. (13)
There is still a lack of understanding of how sensitive the near wake is to small angles of attack, when the changes occurring in the base region affect the flow on the leeward side of the body, what effect a "large" angle of attack has on the near wake (base pressure, wake neck and rear stagnation point location, shearflow profiles), the far wake flowfield (invis cid flow, static pressure distributions, vis cous wake growth and velocity profiles) and on transition from laminar to turbulent flow.
These are questions which were studied in the present experi-mental investigation of the flow at Mach 6 over 20 degree -wedges at
o
careful near and far wake flowfield results for the same wedges at
zero angle of attack were available (Batt and Kubota (6
».
In order to find out what effect an angle of attack has on the overall flowfield, a simple shock expansion model was employed to
estimate the inviscid flowfield. In 1948, Kahane and
Lee~14)
calculatedthe invis cid flowfield about a two -dimensional flat plate at small
angle of attack, moving at supersonic speeds. They found, somewhat
surprisingly, that there was an upwash directly behind the trailing edge of the airfoil. For flows over wedges the inviscid flow is
un-determined unless the base pressure is specified. Thus, for given
base pressures the inviscid flow, consisting of oblique shocks and Prandtl-Meyer expansions was calculated. A typical example of the resulting inviscid flowfield is given in Figure 1 for the flow over a
200 wedge at Mach number 6 and at angle of attack of 150.
As in the case of the flat plate at angle of attack there is an upwash, as indicated by the angle the slip line makes with the free-stream direction (6 I"
s Ip = in this example, for
Pb
Ip
00 = O. Z5 -0. 5). Since in this model the flow direction behindthe wake shocks is found by matching the pressures and the flow directions for the flows corning from both sides of the wedge, there is one wake pressure and one flow direction but a slip line across which velocity and temperature jump considerably (ueZ/u
e 1
<
1,T e2 /T e 1
>
1). It is expected therefore that the viscous wake beyondat the leeward and windward edges of the viscous flow. In the near wake the situation is more complicated.
Because of vis cous -invis cid flow interaction near the leading edge of the models, a shock wave was observed on the leeward side even when the leeward side was inclined away from the free streaITl and the inviscid flow model would predict an expansion (see Figure 1).
The flow on the leeward side of the wedge and in the near wake region is obviously dominated by vis cous -invis cid flow interactions. At "large" angles of attack separation occurs on the leeward side.
A des cription of the measurements and experimental techniques is given in Section II. Section III discusses the data reduction and
unce rtainties in the measurements. Results are presented
II. EXPERIMENTAL APPARATUS AND TECHNIQUES
II. 1. GALCIT HyPersonic Wind Tunnel
The experimental work reported herein was conducted in the GALCIT Hypersonic Wind Tunnel, Leg 1. A more complete
descrip-tion of this facility was given by Baloga and Nagamatsu.(l5) This tunnel is a continuous flow, clos ed return device with a 5 in. X 5 in. test section and a nominal Mach number of 6. Models were placed at the center of the third port which was about 23 in. downstream of the nozzle throat. This arrangement permitted wake measurements to approximately 10 in. downstream of the model.
Reservoir pressures of 10, 35, 60 and 85 psig, with corre-sponding free stream Reynolds number of 0.465, O. 94, 1. 42 and 1. 9 X 10⁵/in. were selected for tests. A reservoir stagnation tem-perature of 2750 F and a dew point of _400 F (the specific humidity is
smaller than 5 x 10⁻⁵) was maintained for the present investigation, which satisfactorily eliminated condensation effects. The tunnel was warmed up for approximately two hours before any data were taken.
Static pressure and Pitot pressure surveys in the empty wind tunnel have been conducted by many investigators. (4,5,6, 16) Good agreement between these surveys was observed. The static pressure variations along the centerline of the tunnel conducted by Batt( 6 ) were adopted to normalize the static pressure survey in the present tests.
n.
2. Modelsby Batt ( 6 ) in his surveys of hypersonic wake behind wedges at zero angle of attack were used for the present test. These two models were fabricated from solid pieces of Ketos steel and had base heights
of 0.15 in. and 0.3 in. respectively. The leading edges of these two
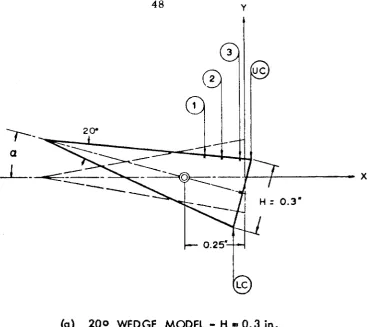
models were carefully ITlachined to a thickness of less than 0.002 in. The wedge model with a base height of O. 3 in. is shown in
Figure 2a. Four surface pres sure taps and one base pres sure tap
all of O. 0135 in. in diameter were installed on it, and were
joined by stainless steel tubing pressure leads, 0.042 in. in
diam-eter, flu s h - rna u n ted in surface grooves and led out of the side
port of the tunnel. Three of the surface pres sure taps were installed
at one side of the wedge surface with respective distances of 0.050
in., O. 130 in. and O. 195 in. from the trailing corner. The fourth
surface pressure tap was on the other side of the wedge surface
and was 0.195 in. from the trailing corner. The base pressure tap
was at the center of the wedge base. A metal arm, approximately 4 in. in length, with a needle on its end, was clamped on the model's shaft outside the tunnel to serve as an indicator of incidence.
The other model used was a wedge with O. 15 in. base height. This model had two base pressure taps, 0.0135 in. in diameter, in-stalled on the centerline of the wedge base. A base pressure lead, 0.042 in. stainless steel tubing, was flush-mounted in the base groove and brought out of one of the side ports of the tunnel as shown in
Models were installed at an incidence of 10° when the upper surface was leveled. Alignment of the models with the free stream flow was checked by the symmetric property of Pitot p res sure traces
in the wake at zero incidence. For the larger wedge (H = 0.3 in. ),
alignment at zero incidence was further checked by connecting the corresponding lower and upper surface pressure taps to each side of
a silicon "UII tube, to make sure that the pres sures were equal.
II. 3. Static Pres sure Measurements
A conventional cone -cylinder static pres sure probe was
em-ployed to measure the static pres sure distribution in the wake. This
probe was fabricated from a O. 032 in. stainles s steel tubing with three pressure orifices being located ten diameters behind its
shoulder and with a 20° cone tip. The length between tip and orifices
of the static pressure probe prevented measurements in the near
wake up to approximately x/H
=
1. 5 for the larger wedge (H=
O. 3 in.)and x/H = 3. 0 fo r the smaller wedge (H = O. 15 in.). A similar probe
of O. 042 in. in diameter was designed and calibrated by Behrens. (17) Thot;le results were applied to correct the data measured by the
present probe.
A silicon micromanometer was connected to the probe to
measure the static pressure. The reference pressure was maintained at about a half micron of mercury by using a diffusion pump in series with a mechanical vacuum pump. All joints were carefully sealed by
using vacuum grease and glyptol to prevent possible leakage. This
measuring system, it was necessary to wait for a few minutes before a measurement was taken. Figure 4 shows a typical vertical static pressure trace in the proximity of minimum Pitot pressure point. II. 4. Pitot Pressure Measurements
A stainless steel tube, 0.032 in. in diameter, flattened to approximately 0.040 in. X 0.010 in. at the forward end, with a front opening of about O. 030 in. X O. 003 in. was used as a Pitot pressure probe. A 0 - 5 psi Statham pressure transducer which was calibrated against a mercury manometer to be 922 microvolts per psi per one volt excitation was used to convert pressure measurements to elec-trical signals. The reference pres sure us ed was the same as that for the static pres sure measurements (Section II. 3). In practice, the output signal from the pressure transducer was amplified to the desired voltage level, and at the same time, the position of probe was converted to an electrical signal by employing a Helipot potentio-meter which was being activated by the probe positioning mechanism. A Moseley XY recorder was used to record the pressure and position sig:qals simultaneously on a piece of 15 in. X 10 in. graph paper. The data obtained in this manner were then "read II by a digitizer
which converted the data from graphical form to digital form and punched their coordinates into data cards for computer calculation.
This digitizer could accurately subdivide 1 in. into about 800 units. The number of data points taken at each streamwise station ranged
approximately from 100 to 300. II. 5. Flow Visualization
of light machine oil on the leeward surface of the model. Normally, after starting the tunnel, the wind swept the oil and caused an oil film to accumulate in the reverse flow region, therefore clearly marked the boundary of dividing streamline. For cases with higher incidences, the model tended to block the tunnel and caused difficulty in starting the tunnel. However, this difficulty was overcome by first setting the model at a lower incidence (i. e., 10° or 15°), then gradually turning the model to the desired higher incidence. This process caused oil first to be swept to the base of the wedge, and then to travel upstream until it reached the separation point.
III. DATA REDUCTION AND ACCURACY ESTIMATE
III. 1. Dis cus sion of the Measured Data
The validity of the measured data depends on the
two-dimensionality of the flow, and the wake flow being free from shock
waves reflecting from the tunnel walls. The problem of
two-dimensionality of the flow primarily depends on the strength of the interaction caused by the existence of the sidewall boundary layer, the model and its leading edge shock waves. Similar problems were encountered by McCarthy (3 ) and Behrens (5 ) in their expe ri-ments of hypersonic wakes behind cylinders. The flow is sketched in Figure 5 which is qualitatively similar to the one given by
McCarthy.( 3) It is worth noting that the region of flow without
interference is a function of free stream Reynolds number, model size and its angle of attack.
During the present investigation, no base fence was installed on the models, yet the measured base pressure compared favorably with those given by Batt(6 ) which were measured using the same
models but with base fences. The agreement of the base pressures
is an indication that reasonably two -dimensional flow was established in the near wake.
The wall boundary layer-model interference spreads to the center of the wake 3 to 4 inches downstream of the model (Figure 5).
It becomes noticeable only at large angles of attack. Besides this
This interference could be detected by both static pres sure measure-ments and Pitot pressure measuremeasure-ments. Only data without notice-able interferences were used. A summary of all data obtained in this study is given in Table 1.
Ill. 2. Base Pressure
All base pressures were measured by using the base pressure tap installed on the models and connected to the same silicon micro-manometer as that used for the static pressure measurements. Even at this low pressure, a leak correction to the measured data was estimated to be unimportant for the present pressure measuring system. No correction was made. Close agreement was found between the present data and the corresponding measurements of Batt.( 6 )
For the larger wedge model (H = O. 3 in.), measurements were made for both positive and negative angles of attack. The results for the same positive and negative angles of attack compare with each other within ± 3%.
III.~. Static Pressure
The viscous -invis cid interaction phenoITIenon for this type of probe was investigated by Behrens as ITIentioned in Section II. 3.
The pressure excess (i. e., ~p ::: ITIeasured pressure - actual pres-sure) introduced due to this type of probe was expressed in terITIS of the interaction paraITIeter X. and is given by the following rela-tIon. ' (I 7)
where,
~n - -2
=- :::
o.
065 X+
O. 04 X pX :::
C:::
(11;)
(J )
w x ::: distance ITIeasured froITI the tip
All ITIeasured static pressure data were properly corrected by this equation before being used in the ITIean flow calculations. It is a well-known fact that the static pressure probe is sensitive to its
"ITIisalignITIent" with respect to the streaITI; in other words, the angle of attack of the probe has significant influence on its ITIeasureITIent. McCarthy< 3 ) ITIade a quantitative investigation of a probe siITIilar to the one used in the present tests, but his results were liITIited to
*
very sITIall angles (± 20 ). Recently, 19awa did a systeITIatic study
.of cone-cylinder static pressure probes with angles of attack as high as ± 25°. The priITIary difference between the probes 19awa used and the present probe is that the present probe had three pressure orifices located at 1200 intervals while 19awa's probes had two or four pressure orifices installed at various angular locations. One
of 19awa's important findings is that the deviation in the pressure caused by angle of attack is less than ± 4;t for 5° incidence, and les s than ± 10;t for 10° incidence for all probes he investigated. Taking the misalignment of the probe into consideration, the
un-certainty for most of the static pressure measurements was
esti-mated to be of the order of ± 5%. or smaller for the lower angles of attack. But for the larger angles of attack and at lower free
stream Reynolds number (for instance, H = O. 3, Re H= 1. 4 00,
ex = 20°, 22. 5°), the uncertainty might be as high as ± 10%.
X 104
In the near wake, no static pressure measurements were
,
taken due to the length of the probe. For the purpose of data reduc-tion, the static pressures in this region were interpolated from the measured wake pressure and base pressure data.
After being corrected for the viscous -inviscid interaction, the static pressures were normalized with the free stream pressure, using the free stream data given by Batt.
Ill. 4. Pitot Pressure
parallel to the windward side surface of the wedge. Therefore, the sum of angle of attack and wedge half angle (l 0° ) yields the flow inclination. Knowing the free stream conditions and the angle of the windward surface with respect to the free stream, the flow behind
the oblique shock may be calculated. For the highest angle of attack
(25°), with a flow inclination of 35°, and a downstream Mach number of about 2, the measured Pitot pressure is about 8'% less than the value calculated by the above mentioned procedure. Since most of the flow inclinations encountered in the present tests are far below
35°, the error in the Pitot pres sure measurements due to misalign-ment of the probe is small.
Pitot pres sure behind leading edge shocks
Knowing the free stream conditions and the Pitot pres sure jump across an oblique shock, the shock angle and the conditions behind the shock may be calculated, including the stagnation pres-sure which is necessary for the calculation of the static pres pres-sure in the inviscid flow at the edge of the viscous wake (see Section III.6). Pro,hlems arise when the shock angle becomes of the order of 30°, as shown in Figure 8, where the theoretical inviscid Pitot pressure
(P
t 3
tP
t 1 ) and total pressure (Pt 2IP
t 1 ) downstream of an obliqueshock wave are shown. These pressures for three free stream Mach numbers of 5. 9, 6. 0 and 6. 1 are shown to demonstrate the effect of upstream Mach number on the downstream Pitot pressure. This figure indicates that the Pitot pres sure (P
t 3
IP )
t 1 for these40°, evaluation of downstream total pressure from the measured Pitot pressure jump may lead to a considerable error even if the downstream Pitot pressure measurement is in error by only a few percent. A second problem occurs when the shock angle is large.
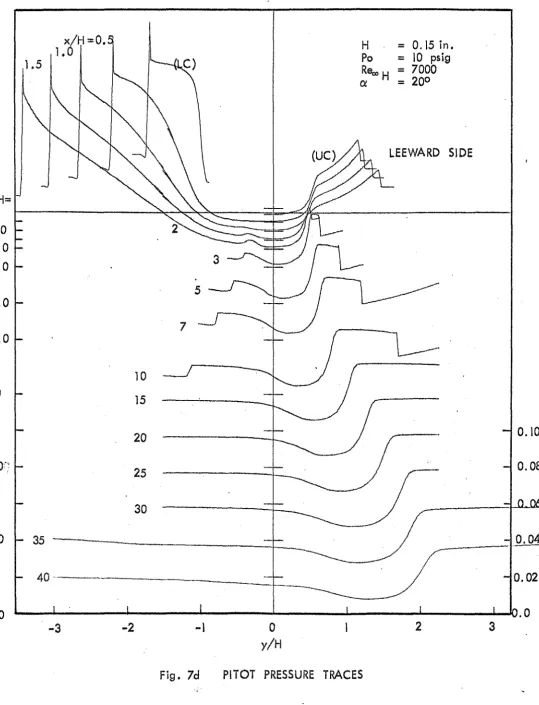
The Pitot pressure measurement across the windward side leading
edge shock wave near the wedge generally experiences an overshoot on the high pressure (downstream) side of the shock wave, as shown for example in Figure 7d. For the highest angles of attack addition on undershoot occurred on the lower pressure side ahead of the shock wave. The reason for these overshoot and undershoot phe ... nomena is not known but is believed to be caused by the interaction of the oblique shock wave and the detached shock wave of the Pitot probe.
The edge shock wave on the leeward side is very weak, there-fore the downstream flow conditions can be accurately evaluated from the Pitot pressure jump across these shocks. Table II sum-marizes the leading edge shock wave angles near the wedge for the present tests. This table was obtained by measuring the shock wave inclination which was constructed by connecting the shock wave loca-tions and the model's leading edge as shown in Figure 6, and checked by the jump relations of the Pitot pressure where possible. The accuracy of the shock angles determined in this way is estimated to
o be ± 1 .
that the shear layer thicknes s encountered in the present wake flow measurements is at least three times larger than the present probe dimension, and according to Dewey's (4) results, the dis-placement effects are negligible.
In the interpretation of wake geometry from the Pitot pressure trace, a pressure level half the measured jump is
considered as the location of the shock wave. Bannink and Nebbeling( 18) indicated that the error introduced by the displace-ment effect is of the order of one tenth of the probe's outer dimension and is directed towards the region of highe r pres sure. Accordingly, the uncertainty of the location of shock wave intro-duced by the displacement effect in the present experiment is estimated to be less than one percent of the wedge base height, and therefore, is a negligible source of error.
Another error of Pitot pressure measurement comes from rarefaction and viscous effects. According to the data given by Sherman, (19) this source of error is in the present tests confined to the base flow regions with subsonic speeds and low Reynolds numbers. No effort was made to correct for these errors. The estimated error may become as high as 20~, however detailed measurements were not made in the low density low speed base
III. 5. Location of Flow Separation on Leeward Surface
The method of obtaining the location of flow separation on the leeward surface was described in Section II. 5. The data obtained by reading the photographs and further confirmed with visual estimation are presented in Table III. The reliability of the data is not well known because of a potential error from the distortion caused by taking the photographs through a plexiglass window, especially when the closeup lens was used. No correc-tion was made for the final results of flow separacorrec-tion shown in
Table III.
While conducting oil-film experiments in separated and reattaching flows, Chapman et. al.,(20) in turbulent boundary layer separation found a simultaneous occurrence of two thread-like lines which were stable, repeatable, and normal to the stream direction and which were displaced streamwise a distance equivalent to several boundary layer thicknesses. The downstream oil line was l~cated at separation. In the present experiments, the
sepa-ration is laminar, and only one oil line was observed and believed to be at separation.
III. 6. Data Reduction Procedure
Flow variables
pres sure or stagnation pres sure determined from the slope of the shock wave, a.nd (c) estimate of stagnation temperature. Two dif-ferent procedures were employed to accomplish the data reduction; one in the viscous wake, and the other in the inviscid wake.
Total teITlperature surveys in the wake behind a syITlITletric
wedge of H = O. 3 in. base height were made by Batt. ( 6) The results indicated that, for the adiabatic wedge, the ratio of total temperature along the wake center line to its free stream value varied from 87% on the base to 95% at X/H = 30 for the same Reynolds number range as in the present test. These results suggested that the assumption of isoenergetic flow with T
t
=
Tt,oo is a good firstapproximation. This assumption was used throughout the data reduc-tion.
Reduction of viscous wake data was executed by assuming a constant static pressure across the viscous wake. (A discussion of the validity of this assumption follows below.) By combining static and Pitot pres sures and taking the total temperature as a constant
equ~l to its free stream value, other flow quantities were calculated, applying compres sible flow relations.
considered here on the windward side consisted of the flow along the streamline which passed the straight portion of the windward side leading edge shock wave, the same argument as for the leeward flow applies. The total pres sure los ses could be dete rmined, know-ing the angle of the leadknow-ing edge shock waves and the free stream conditions. Consequently, at each point in the inviscid wake the Pitot pres sure, stagnation pres sure and stagnation temperature were known. These quantities provide enough information to deter-mine all flowfield variables.
In the near wake flows, the viscous regions extend beyond the wake shock waves; Pitot pressure jumps across these shock waves were used to evaluate the static pressure jumps. Since the static pressure is known inside the wake shocks, it could be calcula-ted ahead of the shock. The boundary of application between the two data reduction procedures in the viscous and inviscid wake was determined by the fact that P
t lnVlS Cl " " "d ~ Pt VlS cous " ; in other words, the constant pressure data reduction procedure was applied in the viscous region toward the inviscid region until it reached a point where the total pres sure had a magnitude just below the magnitude of the total pres sure calculated for the invis cid flow. A typical
As mentioned, constant static pressure acros s the wake was assumed for the far wake data reduction. To check this assumption the inviscid data reduction scheme was used to obtain the static pres sure downstream of the wake shocks. Typical results of this
calculation showed that the static pres sure obtained in this manner was up to 20% less than measured inside the viscous wake. Even with this discrepancy in static pressure, the final results, such as velocity, are not changed significantly. (At M = 6, an error in P of 20% results in an error in velocity of O. 5%. )
stat
Most of the data reduction calculations were carried out on an IBM 360/75 computer. Some of the graphs were plotted by a Calcomp Plotter,
Streamlines
Near wake streamlines were constructed by integrating the mass flux from. the leeward side leading edge shock wave towards and across the viscous wake. Since the mass flux in the recircula-tion region is very small (see Batt( 6 \ the effect of the reverse flow was neglected in the present investigation and was considered as a region of zero m.as s flux.
Far wake streamlines were constructed in a different fashion, because no reference starting point could be reached. (The leading edge shock was outside the range of measurement.) However, the following quantity is a constant along a streamline (See Appendix):
I
=
12
[sy pU(U - U)dy+
SYe 1 pU(Ue - U)dY] (1)p U H Y eZ Y 1 ·
This invariant along a streamline served as a principal tool for the construction of far wake streamlines. The dividing stream-line could not be determined by simply examining the far wake data.
The minimum velocity point at x/H = 5 was taken as the starting point to evaluate a streamline close to the dividing streamline. The far wake "dividing streamline" was then deternlined, using relation
(1). Judging from the results of the near wake flowfield, the dividing streamline obtained from this assumption was somewhat lower
IV. RESULTS AND DISCUSSION IV.1. Far Wake Flowfield
The portion of the wake upstream and including the wake neck is defined as the near wake, while the wake downstream of the neck in the region where the wake shocks are formed and the pressure is constant acros s the wake is considered the far wake (x/H ~ 4).
IV.!.!. Pressure Field and Vis cous Wake Edge Flow Parameters
Pres sure Field
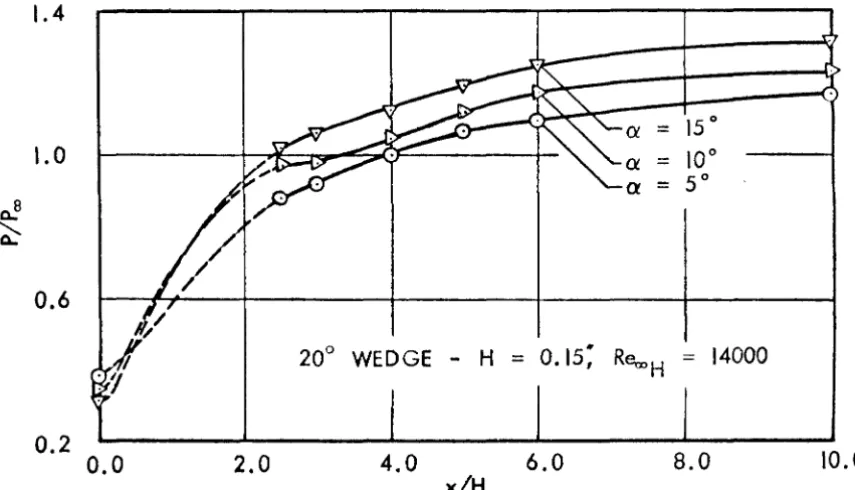
The static pressure measurements at the location of minimum Pitot pressure are shown in Figures 10a-lOd (H
=
.15 " ) and Figureslla, b (H = • 30") as functions of distance from the wedges (x/H) and as function of angle of attack for a series of Reynolds numbers
3 4
(Re
H
=
7 X 10 to 5. 5 X 10 ). The results fo r the large wedge (H=
O. 3") are replotted on an enlarged scale in Figures l2a, b to show some details in the near wake. As discussed in Section III, the static pressure is reasonably constant acro ss the vis cous wake, so that the measurements presented here are the proper viscous wake static pressures.In all cases tested the streamwise static pressure data indicate an initial overshoot followed by a gradual decay back to free stream
conditions. Beyond x/H ~ 50, especially at the larger angles of attack, interference effects are visible (Fig. lOa for example). The overshoot depends very strongly on angle of attack, the higher the angle of attack, the larger the overshoot.
results were found in the present tests as shown in Figures 13 a-c, where the pressure data are replotted as functions of x/H and Reynolds number for a given angle of attack.
These Figures show that also at angle of attack the 'eenterline"
pressure is the higher the smaller the Reynolds number. However at
the smallest Reynolds number (Re
H
=
7000) at which the wake remainslaminar, the pressure does not rise as fast beyond x/H
=
4 as at thehigher Reynolds numbers. This somewhat faster rise of static
pres-sure at the higher Reynolds numbers is attributed to instabilities in the near wake (see Section IV.!. 3. on transition).
The overshoot in static pressure as function of angle of attack may be explained by a simple inviscid shock-expansion model as
a1-ready discussed in the introduction. First, however, the viscous
wake edge results will be presented, since they also may be calculated using the same model.
Vis cous Wake Edge Properties
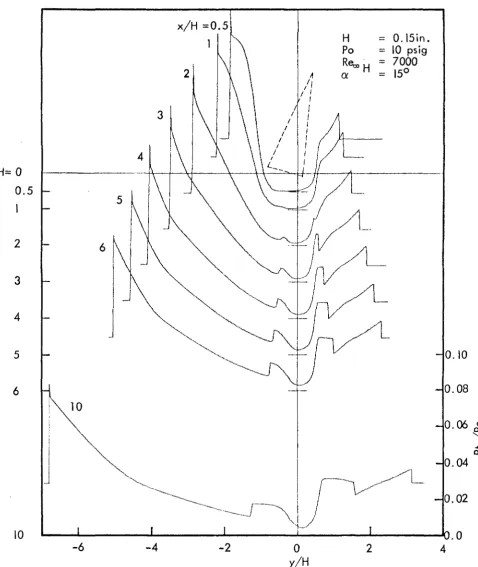
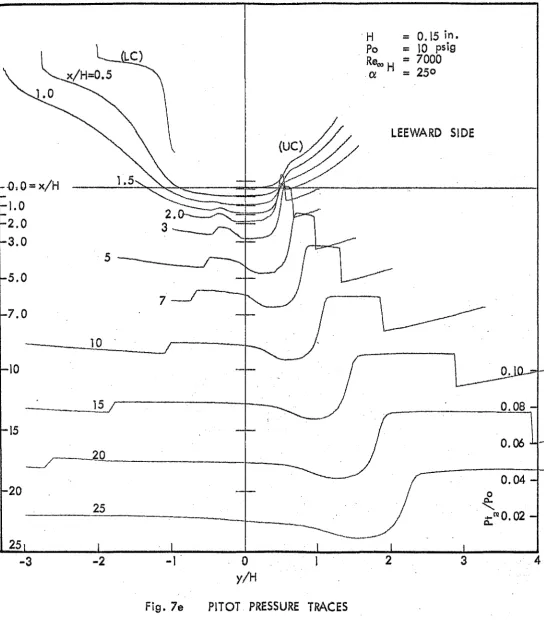
In the far wake (xfH ~ 5) where the wake shocks are well
formed, the Pitot pressures are at two distinct levels on each side
of the viscous wake (see Figures 7 a -e). The Pitot pressure levels
together with the measured static pres sures (and T
=
T ) yieldo 0, 0()
the vis cous wake edge quantities, such as velocities, tempe ratures
and Mach numbers. Representative results of the edge quantities as
*
function of x/H are given in Figures 14a to 14e for angles of attack
of 5 to 250 at one Reynolds number (Re
H = 7000).
*
The minimum velocities and Mach numbers and maximumThe edge values of velocity, Mach num.ber and temperature on the leeward side for all angles of attack are very close to the free
stream. values. However on the windward side thes e quantities
change considerably with angle of attack. The velocity and Mach
num.ber decrease and the tem.perature increases with angle of attack. At all angles of attack the edge velocity and Mach num.ber increase slightly and the tem.perature decreases as the flow m.oves downstream., indicating a slow expansion of the wake flow in the region behind the
wake shocks. Com.pared to the changes ta king place inside the vis co us
wake these slight gradients at the edges of the viscous wake are very sm.all.
To better illustrate the changes of the wake edge quantities
as function of angle of attack, the values measured at x/H = 10 are
plotted versus angle of attack (Figs. 15 a -c). As shown in these figures the effect of Reynolds num.ber is very sm.all, yet a system.atic decrease of windward velocity and Mach num.ber with decreasing Reynolds num.-ber is perceptible.
Com.parison of Experim.ental Wake Edge Flow Quantities with Inviscid Flow Calculations
Even though the real flow over the wedge is quite different, the sim.ple invis cid shock expansion m.odel, m.entioned in the introduction, has been used to calculate the wake static pressure and the velocities
and tem.perature levels outside the vis cous wake. The base pres sures
of Pb/P 00 = 0.25 and 0.5 are chosen as two guide lines of the present
found to be nearly constant acros s the vis cous wake, the measured wake pres sure levels (maximum values found in the wake) are
com-pared with the calculated values in Figure 16. The calculated
pres-sures certainly show the proper trend. At high Mach numbers the
static pressure is the mo st sensitive quantity. The wake pres sure
level is quite insensitive to the base pres sure level and also Reynolds
number. The measured wake pressure level for the case ReB = 7000,
a = 25° appears high. Side wall interference might have been of
im-portance. The difference between the edge velocities is plotted as function of angle of attack and compared with the invis cid calculation
in Figure 17. Close agreement between measured and calculated
velocities was found. Figures 18 and 19 present the findings of
in-viscid calculation and the far wake measurements of Mach number and temperature levels at the two edges. The inviscid edge Mach numbers and temperatures are again quantitatively quite close to the measured values at the edges of the viscous wake.
From this invis cid calculation, the inclination of far wake dividing streamlines may be obtained and is summarized in Figure 20 as function of angle of attack. This figure also includes the results inferred from the measurements (see also Section IV. 1. 4.). Again, good agreement between experiment and theoretical model is demon-strated. Note that the wake flow inclination is directed towards the leeward side.
The close correspondence between the simple inviscid shock expansion model and the real wake flow outside the vis cous wake for
M
=
6, a ~ 25° indicates that the invis cid "far wake" flow is determinedmainly by the relative strengths of the leading edge shocks and the fact that the flows at the edges of the vis cous wake have to be nea rly parallel to each other, with a very weak dependence on the base flow,
1. e. on base pressure and Reynolds number. Because of separation on the leeward model surface and substantive changes of the "effective
body!! associ~ted with separation, this simple inviscid model might not be as good at angles larger than 25° .
IV. 1. 2. Vis cous Wake Width and Minimum and Maximum Properties The location of wake edges were determined by the intersection of the maximum transverse gradients and the wake edge levels of the Pitot pres sure traces. The wake thicknes s was obtained by ITleasuring the distance between these intersections on the leeward side and wind-ward side. Figures 2Ia to 2Id show wake thicknesses for four Reynolds nUITlbers and two wedge base heights. At the two lowest Reynolds
num-3 4
bers Re
H = 7 X 10 (H = O. l5!!) and 1. 4 X 10 (H = 0.30") the wake widths grow nearly linearly and indicate only a very sITlall effect of
°
*
angle of attack up to a
=
15. However, at the two larger Reynolds4
4
nUITlbers, Re
H = 2.8 X 10 and 5.5 X 10, froITl a certain point on the wake growth is ITluch faster than ahead of this point. This "breakaway" phenoITlenon has been observed before by Sato and Kuriki,(Zl) BehrenJ 5)
and Batt and Kubota.( 6) It is interpreted as the onset of a nonlinear instability which is also called the onset of transition, where because of the finite fluctuations the Reynolds stres ses start to become impor-tant and the mean flow starts to grow faster than a laminar steady wake flow (a wake flow where the growing disturbances are still in-finitesimal and therefore do not yet have an effect on the mean flow).
From these results it is concluded that in the present experi-ments the wakes at the two lower Reynolds numbers (Figures 21a, b) are laminar within the region shown in the graphs and that at the two larger Reynolds numbers (Figures 21c,d) at some station in the wake the onset of a nonlinear instability (transition) occurs. This onset of transition moves towards the wedge model as angle of attack is in-creased. A discussion of this phenomenon is given in Section IV. 1. 3. Minimum Velocities and Mach Numbers and Maximum Temperatures
The minimum velocities and Mach numbers and maximum temperatures which are the properties on the wake centerline for the wake without angle of attack exhibit similar trends as the wake widths.
They are shown in Figures 22a to 22d (velocity), 23a to 23d (Mach number) and 24a to 24d (temperature). These quantities are of course not independent from each other but are related because the total temperature was taken to be constant (equal to T ).
0,00
Therefore, only the minimum velocities will be discussed. 3 At the tWQ lowest Reynolds numbers (Re
in connection with the growth of the wake widths. )
At the larger Reynolds numbers the deviation from the mini-mum velocity growth rate of a laminar steady wake occurs sooner
than would be predicted by the growth of the wake widths. This earlier
rise of the wake centerline quantities compared to the growth rate of the wake widths was already observed by Batt and Kubota in their
studies of symmetric wakes. Thus, at the Reynolds numbers of
2.8 X 10⁴ and 5.5 X 10⁴ also the minimum velocities exhibit growth
rates from a certain point on that are faster than the growth rates of
3
laminar wakes as found at the Reynolds numbers of 7 X 10 and
4
1.4xIO.
IV. I. 3. Transition
The location of transition was determined from the sudden
increase of growth rate of wake thickness (Figures 21c and 2Id). For
the case of zero angle of attack and with Reynolds number of 55, 000, Batt (6) found that the point of onset of transition occur red at x/H "'" 15, which seemed to be in good agreement with the results of hot-wire
. (22)
measurements by Demetnades and Behrens. Reexamining Batt's
data yielded a transition point of x/H = 13. 6.
Figure 25 presents the location of transition as function of angle
of attack for two Reynolds numbers, namely, Re H= 28, 000 and 55,000.
00,
The results indicate that, for the same Reynolds number, transition moves upstream as the angle of attack is increased. As will be shown
in the next section (IV. 1. 4), the velocity gradient on the leeward side
density vorticity product (p
~i
)
increases. Because the differences of the wake edge quantities increase with increasing angle of attack, and the wake thickness changes little, the quantity p~~
increases sub-stantially with angle of attack, thus making the wake the more unstable the larger the angle of attack.IV. 1. 4. Far Wake Profiles and Streamlines
Mean wake profiles were calculated from the measured data. Two cases were selected for discus sion: (1) Re H = 7 X 1 0 , 3 Q' = 1 5 , 0
4
0H
=
O. 1511; and (2) Re
H
=
2.8 X 10 , Q'=
15 , H=
O. IS". In the first case the wake is laminar within the whole region of measurement(60 base heights). In the second case the onset of transition as defined in the last section occurs at x/H = 16. 5.
The results of velocity profiles, Mach numbers and static 3 temperatures are shown in Figures 26a, b, c (Re
H = 7 X 10 ) and
4
27a, b, c (Re
H = 2. 8 X 10 ).
In the wake regions (x/H
<
16.5) where both wakes are laminar the profiles at the higher Reynolds number have much steeper gradients than in the lower Reynolds number case. Also, the gradients aresteeper on the leeward side than on the windward side. A comparison with the measurements of Batt and Kubota indicates that the gradients on the leeward side are not only larger than those on the windward side but are also larger than those of the symmetric wake.
These profiles also show that the nonsymmetric viscous wake is qualitatively composed of a "wake"- component and a "free shearl l
are quite close to the profile shapes of a free shear layer.
Kubota (23) and Gold (24) showed that for two -dimensional linear symmetric wake theory of laminar compressible flow the proper
transverse coordinate is
y =
Figures 28a, b show the velocity profiles of the two cases which were discussed in this section in this transformed y-scale, since any theory also for the nonsymmetric wakes should give results in these trans-formed coordinates.
Far wake streamlines were obtained by the ITlethod described earlier in Section III. 6. The quantity "I" follows the notation given by Equation (1), and is an invariant along a far wake streamline as discus sed in the Appendix. The initial station for the far wake stream-line calculculation is x/H
=
5. At this station, minimum velocity point is taken as the starting point of the approximate dividing streamline, and the values of "I" are equall y divided into ten intervals between two maximum velocity points outside the vis cous wake and within the wake shocks, for eleven streamlines.Typical results of the far wake streaITlline calculation are presented in Figures 29a and 29h, in which the line of miniITlum
velocity and the wake shocks are also included. The dividing stream-line has a larger slope than that of the stream-line of minimum velocity.
IV.2. Laminar Near Wake Flow
However, an approximation of static pressure in the small base flow region could be obtained by interpolating the base pres sure and the downstream static pressure which were measured with the present
static pressure probe.
IV. 2.1. Base and Surface Pressures
The base pressure measurements for both wedges are presented in Figures 30a and 30b as functions of angle of attack. When the model was at small incidence, the base pressure dropped slightly with in-creasing angle of attack, and decreased slightly with inin-creasing
Reynolds number. But when the model was subjected to higher angles of attack, the base pressure rose noticeably, except at the lowest Reynolds numbe r (Re H = 7000). At Reynolds numbers above 28,000,
00,
the effect of Reynolds number seemed to disappear. At these higher angles of attack (> 17. So) flow separation on the leeward surface started to appear, and the surface pressure in the separated region became almost identical to the base pressure.
Figures 3la and 3lb show the correlation of base pressures
4
4
for the same Reynolds number, i.e., Re H = 1.4 X 10 and 2.8 X 10 ,
00,
but different models. The correlation is good for the case with higher
4
Reynolds number (Re H
=
2.8 X 10 ), and for the lower Reynolds00,
IV. 2. 2. Near Wake Velocity Profiles
The near wake of the larger wedge model (H
=
O. 3 in. ) waschosen for the experiments in the near wake flow because of the larger size of this region and because surface pressure taps were installed on the surface of the large wedge, which made a more detailed study possible on the leeward surface. Near wake shear layer profiles were obtained by the data reduction method des cribed in Section III.
Figures 32a, b, c, d show the near wake velocity profiles 4
for the wedge with a Reynolds number of 5. 5 X 10 and at angles of
attack of 1 O~ l5~ 200
and 25~ In these figures, velocity profiles
down-stream of the leeward side trailing edge describe the velocity profiles between the leeward sid.e leading edge shock and a point inside the windward side leading edge shock, and those upstream of the leeward
side corner are for velocity profiles between the model surface and
the leading edge shocks. The large increase of velocity gradients on
the leeward side of the vis cous wake with angle of attack is evident. The wake shocks are relatively weak on both sides of the stream. On the leeward side the velocity acceleration caused by the expansion waves is small, the velocity profiles have a relatively flat level in the inviscid region followed by a sharp drop in the viscous region, and the
turning points clearly mark the location of shear layer edges. But on
the windward side, although the velocity discontinuities across the
fan toward the viscous wake, then decelerated due to shear stresses in the viscous wake and compression waves as the flow turns back towards nearly free stream direction.
IV. 2. 3. Flow Separation and Near Wake Flowfield
At small angles of attack, the structure of the near wake flow
is very similar to that of the symmetric wake. The boundary layers
separate at both trailing edges of the wedge and coales ce at about three -quarters of a base height downstream. As the angle of attack increases, the recirculation region moves toward the leeward side. When the angle of attack was increased beyond 17.5°, flow separation on the leeward surface was observed (Table III), and the recirculation region extended from the base to the leeward surface. Even though the oil flow technique does not yield very accurate results, a distinct tendency of increase in the separated flow region was observed with
increasing Reynolds numbers. This last result is in agreement with
trends found in the laminar boundary layer separation experiments by.
Lewis et. a f5) and is also predicted theoretically by Lees and Reeves
~2
6)The structure of typical near wake flow fields at angles of
attack of 10°, 15°, 20° and 25° is shown in Figures 33a -d. These
figures show some important features of the wake geometry, such as
*
shock wave location, shear layer edges, sonic line, contour of zero
*
velocity and streamline s. The contour of zero velocity is constructed
from the points where Pitot pressure is equal to static pres sure.
*
These quantities are only estimates in the region x/H<
1 sinceV. SUMMARY OF RESULTS
Experimental measurements of mean flow properties of hyper-sonic wakes behind wedges of 20° included angle were conducted at angles of attack up to 25° at Mach number 6, with free stream Reynolds number based on wedge base height ranging from 7000 to 55000. The near and far wake flowfields were determined up to a downstream distance of 60 base height.
V.I. Far Wake Flowfield
1. The overshoot in wake static pressure depends strongly on angle of attack; the higher the angle of attack, the larger the overshoot. The effect of Reynolds number on the overshoot follows the same trend as that for the symmetric wake; the lower the Reynolds number, the higher the overshoot. The effect of Reynolds number is ve ry much smaller than that of angle of attack.
2. The viscous wake edge values of velocity, Mach number and temperature are very close to the free stream conditions for all angles of attack on the leeward side, and change considerably with angle of attack on the windward side. A weak expansion of the wake flow in the region behind the wake shocks changes the vis cous wake edge conditions only very slowly as the flow moves downstream.
3. The inviscid wake flow parameters: wake static pressure, edge velocities, edge Mach numbers, edge temperatures and flow
edge shocks and the fact that the flows at the edges of the viscous wake have to be nearly parallel to each other, with a weak dependence on the base flow. The viscous wake is accordingly affected by the
differences in the inviscid flow on the windward and leeward sides. 4. In the laminar wake flows the wake widths, minimum veloc-ities, minimum Mach numbers and maximum temperatures change very little with angle of attack. In the transitional wake flows, the "break-away" phenomenon which is similar to that in the symmetric wake flow is observed, and indicates the onset of a nonlinear instability or tran-sition.
5. The location of transition determined from the sudden in-crease of growth rate of wake thicknes s indicates that, for the same Reynolds number, transition moves upstream as the angle of attack is increas ed.
6. When wake flows are laminar, the velocity profiles at higher Reynolds number have much steeper gradients than those at the
lower Reynolds number. Also, the maximum gradients of the flow profiles are steeper on the leeward side than on the windward side.
The gradients increas e with increasing angle of attack, explaining the upstream motion of transition. The fa s t dec a y 0 f "wake component" in the transitional wake makes the profiles at x/H = 60 quite close to the profile shapes of a free shear layer.
V.2. Laminar Near Wake Flow
1. In general, the base pressure is quite insensitive to angle of attack within about 17. So, especially for those cases with higher Reynolds number. But when the model is subjected to higher angles of attack, the base pressure rises noticeably, except at the lowest Reynolds number (Re
H = 7000). At Reynolds numbers above 28000, the effect of Reynolds number seems to disappear. At these higher angles of attack (> 17. So) flow separation on the leeward surface starts to appear, and the surface pressure in the separated region becomes almost identical to the base pressure.
2. When the wedge is at small angle of attack, the structure of the near wake flow is very similar to that of the symmetric wake. The boundary layers separated at both trailing edges of the wedge and coales ce at about three quarters of a base height downstream. As the angle of attack increases, the recirculation region moves toward the leeward side of the wedge. When the angle of attack is increased beyond 17. So, flow separation on the leeward surface is observed, and the recirculation region extends from the base to the leeward
surface. Even though the oil flow technique does not yield very accurate results, a distinct tendency of upstream motion of the
REFERENCES
1. Lees, L.: "Hypersonic Wakes and Trails," AIAA J. 2 :3,
417-428 (1964).
2. Lykoudis, P. S.: "A Review of Hypersonic Wake Studies, "
AIAA J. 4:4, 577-590 (1966).
3. McCarthy, J. F., Jr. and Kubota, T.: "A Study of Wakes behind
a Circular Cylinder at M = 5.7," AlAA J. 2:4, 626-629 (1964).
Also McCarthy, J. F., Jr.: "Hypersonic Wakes," Ph. D. Thesis, 1962, California Institute of Technology, Pasadena, California.
4. Dewey, C. F., Jr.: "Near Wake of a Blunt Body at Hypersonic
Sp e e d s, II AIAA J. 3: 6, 1 0 0 1 - 1 0 1 0 (1 96 5 ).
Also Dewey, C. F., Jr.: "Measurements in Highly Dissipative
Regions of Hypersonic Flows. Part II. The Near Wake of a
Blunt Body at Hypersonic Speeds," Ph. D. Thesis, California
Institute of Technology, Pasadena, California (1963).
5. Behrens, W.: "Far Wake behind Cylinders at Hypersonic Speeds:
1. Flowfield," AIAA J. 5:12, 2135-2141 (1967); also "Far Wake
behind Cylinders at Hypersonic Speeds: II. Stability," AIAA J.
6 :2, 225 -232 (1968).
Also Behrens, W.: "Flow Field and Stability of the Far Wake behind Cylinders at Hypersonic Speeds," Ph. D. Thesis,
Cali-fornia Institute of Technology, Pasadena, CaliCali-fornia (1966).
6. Batt, R. G. and Kubota, T.: "Experimental Investigation of
Laminar Near Wakes behind 20° Wedges at Moo = 6," AIAA J.
6: 11, 2077 -2083 (1968); also "Experimental Investigation of Far
Wakes behind Two -Dimensional Slender Bodies at Moo = 6, "
AIAA J. 7:11, 2064-2071 (1969).
Also Batt, R. G.: "Experimental Investigation of Wakes behind Two -Dimensional Slender Bodies at Mach Number Six, " Ph. D. Thesis, California Institute of Technology, Pasadena, California (1967).
7. Murman, E. M.: "Experimental Studies of a Laminar Hypersonic
Cone Wake," AIAA J. 7:9, 1724-1730 (1969).
8. McLaughlin, D. K.: "Experimental Investigation of the Mean Flow and Stability of the Laminar Supersonic Cone Wake, "
M.1. T. Aerophysics Lab. Technical Report 169, Jan. 1970.
9. Pallone, A., Erdos, J. and Eckerman, J.: "Hypersonic Laminar
References (Cont'd)
10. Reeves, B. L. and Lees, L.: "Theory of Laminar Near Wake of Blunt Bodies in Hypersonic Flow," AIAA J. 3: 11, 2061-2074
(1965 ).
11. Weiss, R. F.: "A New Theoretical Solution of the Laminar, Hypersonic Near Wake," AIAA J. 5:12, 2142-2149 (1967).
12. Henderson, A., Jr.: "Shuttle Technology for Aerothermodynamics:' Astronautics and Aeronautics, Feb. 1971.
13. Schmidt, E. M. and Cres ci, R. J.: "Near Wake of a Slender Cone at Large Angle of Attack," PIBAL Report No. 68-23, Polytechnic Institute of Brooklyn, July 1968.
14. Kahane, A. and Lees, L.: "The Flow at the Rear of a
Two-Dimensional Supersonic Airfoil," J. of Aero. Sci. 15:3, 167-170 (1948).
15. Baloga, P. E. and Nagamatsu, H. T.: "Instrumentation of GALCIT Hypersonic Wind Twmels, " GALCIT Memorandum No. 29
(July 31, 1955).
16. Herzog, R. R.: "Nitrogen Injection into the Base Region of a Hypersonic Body," GALCIT Hypersonic Research Project, Memorandum No. 71 (Aug. 1964).
17. Behrens, W.: "Viscous Interaction Effects on a Static Pressure Probe at M
=
6," AIAA J. 1: 12. 2364-2366 (1963).18. Bannink. W. J. and Nebbeling, C.: "Deterrnination of the Position of a Shock Wave frorn Pitot Tube Experiments," AIAA J. 7:4,
796-797 (1969).
19. Sherman, F. S.: "New Experiments on Impact-Pres sure Inter-pretation in Supersonic and Subsonic Rarefied Air Streams, " NACA TN 2995 (1953).
20. Chapman, D. R., Kuehn, D. M. and Larson, H. K.: "Investigation of Separated Flows in Supersonic and Subsonic Streams with Em-phasis on the Effect of Transition," NACA Report 1356 (1958).
References (Cont'd)
22. DeITletriades, A. and Behrens, W.: "Hot Wire MeasureITlents in the Hypersonic Wakes of Slender Bodies," GALCIT Internal MeITlo No. 14, California Institute of Technology, Pasadena,
California, May 1963; also DeITletriades, A.: "Hot Wire Measure-ITlents in the Hypersonic Wakes of Slender Bodies," AIAA J. 2:2, 245-250 (1964).
23. Kubota, T.: "LaITlinar Wake with StreaITlwise Pressure Gradient-II," GAL