City, University of London Institutional Repository
Citation
:
Edwards, B. I., Khougali, N. H. O. and Cheok, A. D. ORCID: 0000-0001-6316-2339 (2017). Trends in Computer-Aided Diagnosis Using Deep 2 Learning Techniques: A Review of Recent Studies on 3 Algorithm Development 4. Preprints, 2017, doi:10.20944/preprints201710.0117.v1
This is the draft version of the paper.
This version of the publication may differ from the final published
version.
Permanent repository link: http://openaccess.city.ac.uk/19443/
Link to published version
:
10.20944/preprints201710.0117.v1Copyright and reuse:
City Research Online aims to make research
outputs of City, University of London available to a wider audience.
Copyright and Moral Rights remain with the author(s) and/or copyright
holders. URLs from City Research Online may be freely distributed and
linked to.
Review
1
Trends in Computer-Aided Diagnosis Using Deep
2
Learning Techniques: A Review of Recent Studies on
3
Algorithm Development
4
Bosede Iyiade Edwards 1,2*, Nosiba Hisham Osman Khougali 1,3 and Adrian David Cheok 1,2
5
1 Imagineering Institute, Nusajaya, Johor. Malaysia; bosede, nosiba, [email protected]
6
2 City, University of London. United Kingdom
7
3 Universiti Teknologi Malaysia, Skudai, Johor. Malaysia
8
* Correspondence: [email protected]; Tel.: +601-8769-9318
9
Academic Editor: name
10
Received: date; Accepted: date; Published: date
11
Abstract: With recent focus on deep neural network architectures for development of algorithms
12
for computer-aided diagnosis (CAD), we provide a review of studies within the last 3 years
(2015-13
2017) reported in selected top journals and conferences. 29 studies that met our inclusion criteria
14
were reviewed to identify trends in this field and to inform future development. Studies have
15
focused mostly on cancer-related diseases within internal medicine while diseases within
gender-16
/age-focused fields like gynaecology/pediatrics have not received much focus. All reviewed studies
17
employed image datasets, mostly sourced from publicly available databases (55.2%) and few based
18
on data from human subjects (31%) and non-medical datasets (13.8%), while CNN architecture was
19
employed in most (70%) of the studies. Confirmation of the effect of data manipulation on quality
20
of output and adoption of multi-class rather than binary classification also require more focus.
21
Future studies should leverage collaborations with medical experts to aid future with actual clinical
22
testing with reporting based on some generally applicable index to enable comparison. Our next
23
steps on plans for CAD development for osteoarthritis (OA), with plans to consider multi-class
24
classification and comparison across deep learning approaches and unsupervised architectures
25
were also highlighted.
26
Keywords: computer-aided diagnosis; CAD algorithms; deep neural networks; medical diagnosis;
27
review
28
29
1. Introduction and Background
30
Growth in advanced computational techniques, including machine learning, has lent great
31
support to predictive modelling which supports pattern recognition, with application in several
32
fields including medicine, sales and marketing, etc. Algorithms modelled after human neural
33
architecture, that is, Artificial Neural Networks (ANN), later emerged, with Deep Neural Network
34
(DNN)-based algorithms gaining popularity in recent times across several fields including medicine
35
where developments in disease diagnosis is on the rise [1]. Deep learning algorithms are adaptive
36
systems that have shown great effectiveness in feature classification for low- to high-level features.
37
They have found application in many popular systems like Google, Instagram, Pinterest, and
38
Facebook. Their effectiveness lies in the multiple layers hidden between the input and output layers,
39
which enables the modeling of complex, non-linear relationships. Their application in medical
40
diagnosis supports the development of several diagnostic algorithms in the last couple of years and
41
within various medical fields [2,3]. Considering that such systems are relatively new and there are
42
already several studies done within the short period of its emergence, identify trends in the field is
43
crucial to future works. Though some studies have reported on review of studies within deep
44
learning [1,4], extensive work is scarce on trends within the medical field and so are those that
45
highlight important gaps or employ systematic approaches. We focus on the most recent work to
46
identify areas requiring attention in terms of development and other key issues for future
47
consideration and to assist us and other researchers and/or developers in the proper channeling of
48
future efforts in useful projects.
49
2. Significance of the Review
50
The future of every job, including medical diagnosis, will be depending a lot on algorithm-based
51
solutions. Thus, the faster the progress in various fields of medicine, the earlier we can arrive at
52
solving the problems of easy access, on-time attention and more affordable medical services,
53
especially among poor populations. This review focus on areas where work on development of CAD
54
had been focused, and highlights areas where such is lacking, so that neglected fields can benefit
55
from similar developments in the future. Other than this, the review highlights effective
56
methodologies to aid in the design of such algorithms with higher accuracy and precision. Future
57
systems can then address the limitations of existing ones. In addition, when properly focused,
58
reviews can bring together related studies conducted in various domains, across global regions and
59
by different groups of researchers who otherwise may not have any contact, thereby helping to
60
highlight state-of-the art, as well as address frivolous claims that may not be totally true.
61
3. Objectives of the Review
62
Availability of equipment and dearth of medical experts indicated by as low as a 1:3500
63
physician-patient ratio in some countries [5] are among key healthcare issues in many developing
64
nations. With poverty level complicating these issues, CAD underscores the potential benefits of
65
technology-mediated medical services and efforts at developing more CAD algorithms can ensure
66
that global health goals are achieved quickly. In addition to supporting early detection, accurate and
67
efficient diagnosis, CAD algorithms can also serve as effective instructional systems. This review
68
therefore focuses on identifying i) trends within this field, by capturing the fields of medicine focused
69
by work on CAD development and those that have received less focus; types of data employed in the
70
CAD developments; and deep learning architectures or methodologies engaged in these works and
71
their significance; ii) main findings/results reported, their significance, suggestions regarding
72
limitations and future work and iii) conclusions regarding trends within DNN-based development.
73
These conclusions are intended to guide our fourth objective, to be captured in iv) next steps.
74
4. Related Work
75
Machine Learning (ML) refers to the ability of machines to take data as input, and teach
76
themselves how to make decisions based on these data through defined procedures or processes
77
referred to as algorithms. These algorithms are often categorized as being supervised (learning based
78
on a definite or known goal or output), or unsupervised (no output is defined). ML is based on pattern
79
recognition and has been employed in many fields including fraud detection, translation, information
80
retrieval, facial recognition, classification of DNA sequences, handwriting recognition, and many
81
others. In medicine, ML has been applied for various purposes including image annotation,
82
registration, computer-aided diagnosis (CAD), and guided therapy. In recent times, new algorithms
83
like deep learning are beginning to gain popularity in disease diagnosis by medical imaging and
84
developments have been reported in several studies [6–8].
85
4.1. Artificial Neural Networks
86
ANNs are artificial models of human brain decision-making power [9]. The general scheme is
87
composed of three main parts: the input layer and the output layer, with one or many hidden layers
88
between them. The number of neurons in a layer being a function of system complexity. The input
89
layer provides information on the conditions for which the network is being trained and each neuron
90
represents an independent variable related to the expected output. The number of neurons in the
91
output layer is a function of the intended use of the output. Data fed to the neurons in the input layer
is transferred to the hidden layer where they undergo some complex mathematical computation and
93
then transferred to neurons in the next layer, and the next, until the result is finally transferred to the
94
output layer. Several complex mathematical computations go into determining the optimum network
95
architecture for a system.
96
In ANNs, learning is based on the training algorithm, a computational rule that forms the basis
97
on which the network learns to approximate the transfer function, f, between an input and a
98
corresponding output vector. The network ‘learns’ from ‘examples’ provided by a combination of
99
inputs and outputs in a training database, that is, the information or features that indicates what the
100
network learns; for example, symptoms/results of laboratory analysis and the diagnostic decisions
101
(outputs) in medical diagnosis. Between these layers are the hidden layers responsible for the
102
complex processing of the input data, the basis on which the ANN architecture is regarded as a black
103
box [10]. With linear problems, one hidden layer is sufficient to address the required processing; but,
104
with complex problems, more layers will be required [9] and the number of neurons in each layer
105
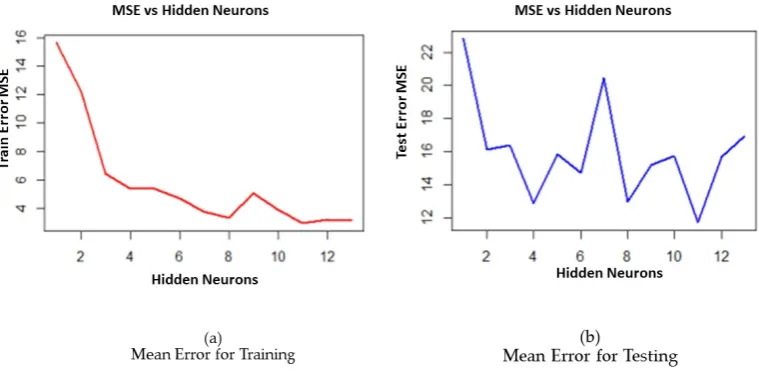
must be estimated to achieve optimum network architecture. This ‘best fit’ value is determined by
106
several methods; one method uses estimates of a regression plot of the training stopping/error
107
function (MSE) and the number of nodes in the hidden layer, the optimal value being the lowest error
108
(MSE) value achieved as shown in the ‘MSE vs hidden layers’ plot for training (a) and testing (b) in
109
Figure 1 [11).
[image:4.595.100.480.364.551.2]110
Figure 1: Mean Error of Training (a) and Testing (b).
111
4.2. Deep Neural Networks
112
Deep Neural Networks (DNN) are based on deep learning, which has gained popularity in
113
general data analysis and was listed among the top technology breakthroughs of 2013 [12]. Neural
114
networks have great applicability in the handling of noisy datasets or those with missing variables.
115
One disadvantage however lies in their longer training times requirement. Deep architectures are
116
generally based on neural networks with multiple layers of stacked neurons that allows the
back-117
propagation of a signal. Convolutional Neural Networks (CNN) have been exceptionally prevalent
118
and have gained more popularity than others. Two of the commonest deep learning architectures [1]
119
include systems based on unsupervised training and those based on supervised training.
120
Unsupervised systems use layer-by-layer pre-training of DNNs, with supervised finetuning of the
121
network; Deep Belief Networks (DBNs), Stacked Auto-Encoders (SAEs) and Restricted Boltzmann
122
Machines (RBMs) which are essentially SAEs in nature are examples. Supervised systems are based
123
on supervised end-to-end training of an entire DNN. Examples are Recurrent Neural Networks
124
(RNNs) and Convolutional Neural Networks (CNNs); CNNs being, in recent times, the most
known architecture within image processing. AlexNet [13,14] is the most well-known, general
126
classification CNN architecture.
127
CNNs are ANN models of human visual cortex [15]. They are among the commonest deep
128
learning architectures, in the same group as RNNs and DBNs and are state-of-the-art within the field
129
of computer vision. CNNs can learn both local and global structures in images, hence, their usefulness
130
as demonstrated in real world applications and in big data tasks related to pattern recognition. CNNs
131
have shown exceptional performance in difficult image classification problems, displaying
132
capabilities that surpassed those of human experts in some domains [16]. They have proven useful
133
in CAD and have been applied in feature extraction from diverse image datasets. It applies equal
134
weights in the convolutional layers and thus require less memory and attains higher processing
135
speed. CNNs do not depend on prior knowledge because they learn the features which are then
136
applied for object classification. They are also less dependent on hand-engineered features. CNNs
137
consists of four layers including the sub-sampling layer (max-pooling), Rectified Linear Unit Layer
138
(ReLU), spatial convolutional layer, and a fully-connected layer. Considering the challenge of manual
139
image interpretation, human limitations and large inter-grader variability, medical diagnosis can
140
benefit immensely from CAD approaches like CNN.
141
4.3. Computer-Aided Diagnosis
142
CAD underscores the benefits of technology-aided disease detection in delivering accuracy that
143
compares with or surpasses those by human professionals. While the target of CAD may not be to
144
replace human doctors, its capabilities can extend those of humans by assisting them to make more
145
accurate diagnostic decisions in addition to addressing expert scarcity in various world regions or
146
medical fields. Several algorithms already exist within CAD; popular ones include Support Vector
147
Machines (SVMs), Fuzzy Logic (FL), Decision Trees (DT), k-Nearest Neighbors (k-NN), Neural
148
Networks (NN) and more recently, the deep learning algorithms. SVMs are clustering, supervised
149
learning algorithms. FL operates within the domain of ‘computer understanding of natural language’
150
is based on ‘degrees of truth’ rather than the true-false or zero-one (0, 1) binary/Boolean logic of
151
modern computing, thereby, being a closer representation of human cognitive abilities. DTs are
non-152
linear classifiers; they employ flow-chart or tree-like model of decisions and their possible outcomes,
153
they attempt to capture important factors including unexpected consequences. In k-NN, classification
154
is based on closest training cases; estimations of the probability of an event is based on information
155
regarding such occurrence in a similar case based on the training data.
156
5. Methodology
157
We employed a systematic approach in our study based on its ability to support reproducibility
158
and focus on a specific area for in-depth review rather than just the general overview approach in
159
unsystematic reviews. Systematic reviews focus on a definite approach to selection, review and
160
evaluation of studies for answering specific research questions. Considering the vast amount of work
161
that have been done in the development of CAD algorithms, it is impractical to conduct a review that
162
captures every study there is. In addition, other studies have considered general reviews; for example,
163
see [1) provided a comprehensive review of studies that employed deep learning in medical image
164
analysis, identifying studies per application area within image classification, object detection,
165
segmentation, registration, and other related tasks. For our study, we considered a tighter selection
166
of articles that reflects the focus of our study, which includes: i) most recent studies, ii) employed
167
DNN, and iii) focused on CAD development. We applied the search strings ‘diagnosis medical
168
algorithm’, ‘deep neural network diagnosis medical algorithm, ‘diagnosis algorithm’, ‘diagnosis
169
algorithm medical’, ‘diagnosis medical algorithm deep neural network’ and ‘deep neural network
170
algorithm diagnosis medical’ for identifying relevant articles in selected databases. Final samples for
171
our study were selected based on three inclusion/exclusion criteria including being published within
172
2015-2017 (based on popularization of deep learning in 2015), study reports on deep learning
173
approaches for CAD algorithm development and reports information on procedure, training and
174
methodology, with findings clearly laid out.
Noting that research articles are deposited in several repositories, some of which are not
well-176
known, and the impracticality of reviewing every possible study that falls within the group in focus,
177
we sampled articles from top medical journals/conferences related to neural network and medicine
178
with purposeful selection of few articles that meet the first and second criteria. Based on these criteria,
179
we sampled from top 10 databases as provided by OMICS International (2017) in April-May, 2017
180
(Note: OMICS’ lists are updated regularly). The full list of articles reviewed is provided in Appendix
181
A (Table A1). Over 600 articles were returned from our initial search; however, only 67 met our basic
182
criteria on abstract screening. Further screening and full content filtering based on the inclusion
183
criteria and objectives yielded a total of 29 papers which were reviewed and the findings reported in
184
this paper.
185
For this study, we focused on identifying among other things: (i) the field of medicine covered,
186
including the type of patient (gender, age-group, etc.) where applicable, while noting that a study
187
can hardly be focused on a single field (e.g. a study on breast cancer, with ultrasound data combines
188
oncology, mammography, and radiology). (ii) Data information; including the type and size of data
189
employed and for which part of the work (feature extraction, training, etc.) where possible, as well
190
as the source (simulated, real clinical data, medical/non-medical data). (iii) Methodology employed,
191
including the procedure for CAD development; we aim to identify what architecture(s) is/are used
192
in the different stages of the work. (iv) Key issues noted in the results of the study; including
193
accuracy/precision reported, and limitations of the techniques used. (v) Suggestions for future work
194
noted; for integration with our findings to draw conclusions that can inform future developments,
195
system upgrade, and research studies.
196
6. Results and Discussion
197
In this section, we address each of the six objectives identified regarding the study. Each
sub-198
section addresses an objective while sections address separate concepts captured in the
sub-199
section.
200
6.1. Distribution of Studies, the fields of medicine focused and those that have received less focus
201
In this sub-section, we address the first objective, hence, we focus on the distribution of studies
202
to capture the year of publication, the medical field or disease focused, the type and source(s) of data
203
employed in the CAD developments and the methodologies engaged in the studies, with a focus on
204
the deep learning architecture and their significance.
205
6.1.1. Distribution of studies by year
206
Based on the year of publication, studies were distributed across the years 2014-2017 (2014
207
studies are among the few purposely selected ones) with most studies (40%) in 2016 as shown in
208
Figure 2. This distribution reflects the recent focus within this area and the popularization of deep
209
learning techniques from 2015 seeing many articles published in 2016. There is however, indication
210
that several studies may become available before the end of 2017.
212
Figure 2: Distribution of Studies by Year
213
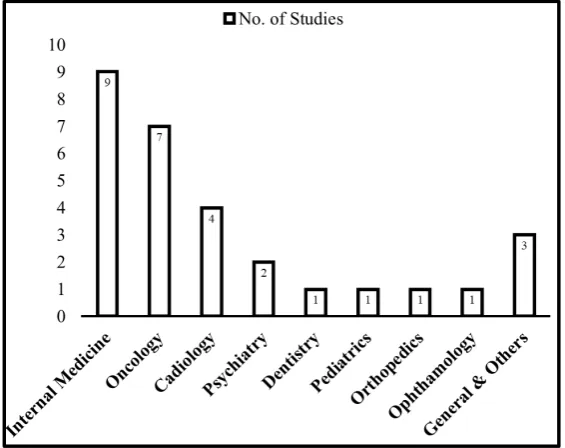
6.1.2. Distribution of studies by Medical Field
214
In terms of disease or field of medicine focused, we identified studies summarized into 9,
215
including 8 specified medical fields and others (including unspecified diseases and general
216
applications) as shown in Figure 3. The studies were focused within 3 main areas including
217
cardiology [4], internal medicine [9], and oncology [7]. Cancer-related diseases (skin, breast, etc.) and
218
fields captured within internal medicine have the highest number of studies, with the latter covering
219
mostly interstitial lung disease and lymph node diseases.
220
221
Figure 3: Distribution of Studies by Disease or Medical Field Focused
222
While it is almost impossible to capture every disease specialty within medicine due to diverse
223
classification approaches across global regions, we considered classifications that capture patient’s
224
age and gender as central issues in medicine and thus, worthy of attention. We therefore examined
225
studies for focus on paediatrics, internal medicine, and geriatrics as sub-specialities within age-based
226
classifications, and obstetrics, gynaecology and mid-wifery for gender-based classifications. Based on
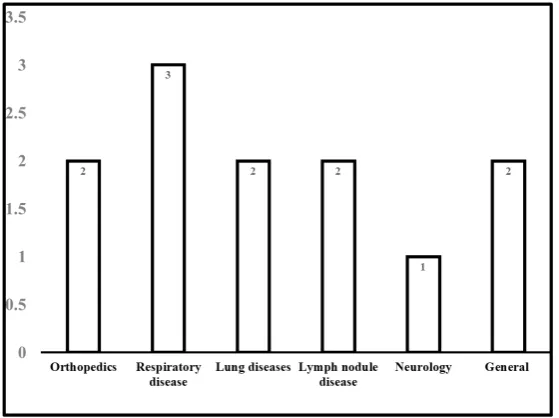
[image:7.595.157.440.445.669.2]this, we noted that most of the studies reported fall within internal medicine, that is, diseases of
228
younger adults as opposed to those of older adults, whose ailments, are usually complicated by
229
sarcopenia and frailty [17] as shown in Figure 3. Development that focuses on populations of younger
230
persons (pediatrics) was only one and none for older adults (geriatrics), in the reviewed studies,
231
highlighting a huge gap within two major global populations. Further details on fields captured
232
within internal medicine is shown in Figure 4.
233
[image:8.595.158.438.163.372.2]234
Figure 4: Distribution of Studies within Internal Medicine
235
There is obviously no specialized field of medicine that focuses on men’s diseases; whereas
236
obstetrics and gynaecology are devoted to the diseases of women, indicating their importance to
237
global medical practice. In our review, apart from cancer-related fields like mammography, diseases
238
of women have not been the focus of CAD algorithm developments. In addition, apart from heart-
239
and lung-related diseases, diseases of other internal organs, including male and female reproductive
240
organs, the digestive system, circulatory system, and bones and joints have not received extensive
241
focus in terms of algorithm developments.
242
6.1.3. Types and Sources of data employed in the CAD developments
243
One of the most striking things noted in the review is that only image datasets (MRIs, x-rays,
244
CT-scans, HRCT images, and ultrasound) were employed in the studies; highlighting the current
245
focus of deep learning applications within medical imaging. This necessitated the use of imaging
246
techniques in the studies. We also noted that three types of data sources were employed in the
247
projects as shown in Figure 5. Data from human subjects [18] were small while public medical
248
datasets [19–22] were relatively larger in size. Some of the studies [23–25] also engaged non-medical
249
image datasets for algorithm training. This appears to be a recent approach to system training that
250
attempts to by-pass the limitation caused by non-availability or inaccessibility of medical data,
251
especially by researcher-developers who in many cases are not health professionals. However, fine
252
details on how this works were not provided in the studies, though it was suggested that this might
253
be a novel attempt that could yield great benefits, but it requires further validation.
254
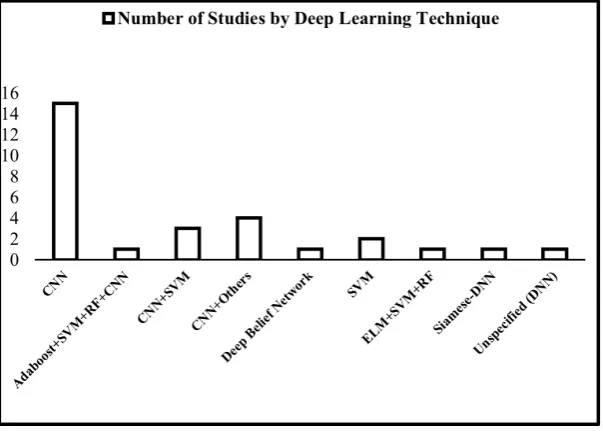
6.1.4. Deep learning architectures or methodologies engaged in the studies and their significance
255
We noted the use of CNN techniques [19] either alone or in combination with other approaches
256
like least squares-SVM [26], ELM [27], random forests [28], adaboost [29], etc. This is not very
257
surprising, since data are mostly image datasets. Distribution of studies by deep learning technique
258
is shown in Figure 6. In some of the studies, the same datasets were divided into training and testing
datasets, while in some, one dataset is used for training and another for testing. This is the case in
260
studies that employed non-medical image datasets [24,30–32]. In such cases, methodologies are
261
mostly domain-transfer CNN.
[image:9.595.134.431.120.323.2]262
Figure 6: Distribution of Studies by Deep Learning Architecture Employed
263
6.2. Main findings noted in the studies reported and the significance for future works
264
We were interested in a general overview of the quality of results in terms of the data size, type
265
or quality, hence, we mapped deep learning techniques employed with the dataset used and the
266
quality of result. We also identified the quality indicator employed for reporting in each study.
267
Though it is difficult to make a conclusion on the comparative effectiveness of different methods (or
[image:9.595.139.441.459.680.2]268
a combination of methods) due to different reporting indices, we made the following general
269
observations which might help in future studies.
270
6.2.1. Methodology
271
A total of 12 different techniques were identifiable in the studies, with nine [9] being CNN or in
272
combination with CNN. They include CNNs, Deep CNN, Customized CNN; domain-transfer CNN
273
(DT-CNN), CNN + Support Vector Machines (SVM); DT-CNN + Sparse Spatial Pyramid; CNN + GIST
274
(Generalized Search Tree), CNN + Adaboost + SVM + Random Forests (RFs); Extreme Learning
275
Machines (ELM); SVM + RF; Least-squares SVM; CNN + Pattern Histogram; Lib linear SVM
276
Classifier; Siamese DNN; and Deep Belief Network (DBN). In most of the studies, CNN, was
277
employed either as the only approach, or in combination with other techniques.
278
6.2.2. Quality Indicators
279
Quality indicators noted in the articles reviewed were diverse: accuracy, mean class accuracy,
280
performance accuracy, margin accuracy, average time for network computation, average absolute
281
error [33], sensitivity and specificity [34], error rate, Jaccard index [32], error score [19], Area Under
282
Curve, precision, percent performance [35], and F1 score [36] among others. It appears there are no
283
fixed standard or agreed upon indices for reporting these types of studies. It may help for all work
284
to report quality achieved based on some fixed standard to aid comparison across approaches. This
285
might offer a lot of leverage for future works in deciding on methods. Quality metrics employed in
286
the reviewed studies are described below [37,38].
287
• Diagnostic Accuracy describes how close a measure is to the true /standard value and it can be
288
described using other indicators like sensitivity, AUC, specificity, etc.
289
• Sensitivity and specificity refers to how well a system or test accurately classifies a
290
healthy/disease condition. It is measured based on how many disease conditions are classified
291
as healthy (False Positives) and how many healthy conditions are classified as disease (False
292
Negatives). It can also be reported as correct classification of healthy conditions as healthy (True
293
Positives) and diseased as diseased (True Negatives).
294
• Area Under Curve (AUC) is the area under the ROC curve which is a plot of specificity (x-axis)
295
against specificity (y-axis). The AUC can take values up to 1.0 (best). Values <0.5 are not
296
acceptable. The closer the AUC is to 1.0, the better the specificity and sensitivity.
297
• Precision is a class agreement between the positive labels and the data labels provided by the
298
classifier to give estimation of the predicted value of the class label based on the desired class
299
calculated.
300
• F1 Score describes a relationship between the test data positive labels and those provided by the
301
classifier. It provides a measure of the accuracy of the test considering the recall (r) “sensitivity”
302
and the precision (p) values to calculate the score.
303
• Jaccard Index is a statistical measure to compare the sample set similarity and diversity; it is
304
used to identify the similarity between procedures’ pairs.
305
• Error Score/Rate is the average of the classification error per-class; it refers to as the False
306
Acceptance Rate or the False Rejection Rate.
307
• Performance evaluates the performance of the system or the classification task based on the
308
overall matrix measurements results by testing the classes which are recognized correctly.
309
310
6.2.3. Effect of Different Metrics Employed
311
The type of image, (2D/3D) appears to influence quality achieved; for example, we noted that
312
70,000 3D images achieved a higher accuracy (99.9%) than 215,000 2D images [25]. We also noted that
313
authors reported generally higher quality metrics for hybrid approaches than single ones. Ahn et al.
314
[19] employed a combination of DT-CNN and Sparse Spatial Pyramid and reported an error score
that ranked second among 13 techniques. Bar et al. [24] also achieved AUC up 0.94 with their
CNN-316
GIST combination. Similarly, Saraf and Tofighi [18] achieved an accuracy of up to 96.85% by
317
combining SVM and CNN. Single method approaches (CNN and DBN) like Miki et al. [39], Sharma
318
et al. [30] and Alcantara [31], reported comparatively lower metrics.
319
6.2.4. Classification Approaches
320
Many of the algorithms focused on binary classification which appears to support higher
321
accuracy and precision than multi-stage classification. For example, 89.60% vs 62.07% for binary vs
322
multi-class approach was reported by Alcantara et al [31]. However, real-life medical diagnosis is not
323
a mere identification of the presence or absence (binary classification) of a disease, but, a multi-stage
324
classification that can identify levels of severity to support proper treatment. Hence, multi-class
325
approaches are more accurate simulations of real-life medical diagnosis, suggesting the need for
326
future studies to focus on improving the accuracy of these types of classifications.
327
6.2.5. Effect of Data Manipulation
328
Data cleaning (e.g. de-noising) is a standard practice in pre-processing of data prior to
data-329
mining procedures. It assumes ‘dirtiness’ of raw data and its inability to provide useful or accurate
330
information. The findings of Acharya, Fujita, and Shu Lih, et al. [34] appear to negate this; they
331
reported an average accuracy of 93.53% with noise removal and 95.22% without noise removal. Miki,
332
Muramatsu and Hayashi et al. [39] on their part noted an increased accuracy of 5% with data
333
augmentation. These observations suggest the need for more studies to highlight issues within data
334
manipulation.
335
6.2.6. Significance of Data Type/Source
336
Real patient data, image data from public databases and non-medical or natural image data were
337
the 3 types of data noted. The use of non-medical/natural image datasets was noted by the users as a
338
novel approach that can address the challenge of data scarcity while at the same time yielding useful
339
results in terms of classification accuracy [24]. However, we noted that the use of real patient datasets
340
yielded good results despite the small sizes employed [18,29,40,41]. The implication is that better
341
results are possible with larger data sizes compared with the use of public medical datasets or natural
342
image datasets.
343
6.2.7. Training Mode
344
We consider it worthy of note that every article reviewed employed supervised learning
345
techniques for training the algorithms. At a time when the greater benefits of unsupervised learning
346
is being highlighted, it is noteworthy that none of the studies employed unsupervised learning.
347
Vaidhya’s presentation [42] highlights the advantages of unsupervised learning in medical imaging
348
especially when compared with the need and cost of ‘strong, pixel-level annotations’ for several
349
images that may run into millions required for very accurate image-based classifications. He
350
described the application of ‘Stacked De-noising Auto-Encoders’ (SDAEs) for brain tumor
351
segmentation from MRI which achieved results comparable to that based on 100% supervised CNNs.
352
Though we did not find studies that reported results based on separate supervised and/or
semi-353
supervised and/or unsupervised deep learning in the same project and on the same datasets, we
354
believe that such studies might shed the much-needed light on the comparative effectiveness of these
355
techniques.
356
6.2.8. Suggestions regarding limitations of the studies and future work
357
Several limitations including the use of retrospective and non-clinical data in about 70% of the
358
studies, trial with only one type of data, one disease, and testing by developers in simulated settings
359
in most cases, are some of the limitations reported in the studies. The necessity of assessing the
360
usefulness of the algorithms for applications in point-of-care solutions was suggested by Luong et al
(2016) while trial with other techniques, data and diseases are recommended in studies employing
362
novel approaches (Miki et al., 2017b; Wang et al., 2015). The need to establish generalizability of
363
findings across different diseases was also noted, though, [21] and [43] reported the greater
364
effectiveness of dedicated systems over multi-purpose ones. [31] noted deployment on mobiles as a
365
means that might represent the ultimate usefulness of these systems for supporting self-diagnosis
366
and timely access, especially, in poor populations. Other suggestions include the use of DT-CNNs
367
with lower layers pre-trained on generic data and deeper (semantic) layers fine-tuned for specific
368
image types and further tuning of algorithm trained with non-medical data with real data. [22] also
369
suggested the use of ensemble teacher for labeling unlabelled samples to augment training set of
370
student model to address the problem of limited annotated data. Overall, the need for larger datasets
371
with more real patients, better features and more robust classifiers, and datasets and results made
372
available to serve as public assets and reference point for future studies [29] cannot be
over-373
emphasized.
374
6.3. Conclusions regarding the general trend within DNN-based development of CAD algorithms, and
375
directions for future work
376
The review highlighted important issues that require focus in future works including the scarcity
377
of studies within some fields of medicine, like obstetrics, gynaecology, paediatrics geriatrics,
378
psychiatry, and musculoskeletal disorders. Images datasets employed in all the studies, informed the
379
focus on CNN approaches with supervised learning. Future studies should examine the efficacy of
380
non-image data, for the development of useful applications within fields like mental health where
381
clinical diagnosis remains an almost uncertain procedure complicated by comorbidity. Quality
382
indicators reported are diverse, making comparison across studies difficult; we suggest that some
383
generally applicable index, should always be reported. More focus should be placed on multi-class
384
approaches while efforts are made to improve quality of results. More studies to confirm the effect of
385
data manipulation on quality of output are required in addition to availability of large, real clinical
386
data and direct collaboration between medical experts, hospitals, relevant researchers and machine
387
learning experts to achieve better results. Finally, regarding our submission on the significance of
388
reviews to clarify claims that may not be completely true, we noted that Suzuki et al. [32], in their
389
report claimed that their ‘study is the first demonstration of DCNNs for detecting the masses in
390
mammographic images’; however, we found a similar work by [44], in which they also employed
391
deep CNN and which was reported in a MICCAI conference paper in October, 2015.
392
6.4. Next Steps
393
In our follow-up work, we will be addressing some of the findings reported in this paper. Due
394
to the complications of working within paediatrics field and the certification requirements of medical
395
data handling, we will be focusing on a CAD development project for a common geriatric ailment,
396
osteoarthritis (OA), associated with ageing. We will be considering focus on multi-class classification
397
and a comparison of various deep learning approaches using the same data in addition to the
398
possibilities of comparison across supervised and unsupervised learning approaches.
399
400
Conflicts of Interest: The authors declare no conflict of interest.
401
402
403
404
405
406
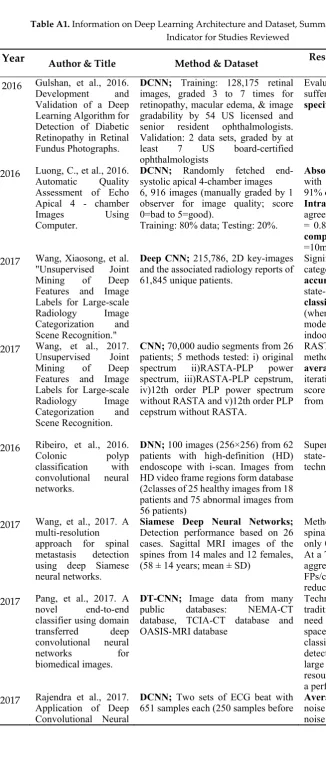
Table A1. Information on Deep Learning Architecture and Dataset, Summary of Result and Quality
408
Indicator for Studies Reviewed
409
Year Author & Title Method & Dataset Result Reported with Precision
Metric
2016 Gulshan, et al., 2016.
Development and Validation of a Deep Learning Algorithm for Detection of Diabetic Retinopathy in Retinal Fundus Photographs.
DCNN; Training: 128,175 retinal
images, graded 3 to 7 times for retinopathy, macular edema, & image gradability by 54 US licensed and senior resident ophthalmologists. Validation: 2 data sets, graded by at least 7 US board-certified ophthalmologists
Evaluation of algorithm with adult sufferers shows high sensitivity and specificity
2016 Luong, C., et al., 2016.
Automatic Quality Assessment of Echo Apical 4 - chamber Images Using Computer.
DCNN; Randomly fetched
end-systolic apical 4-chamber images 6, 916 images (manually graded by 1 observer for image quality; score 0=bad to 5=good).
Training: 80% data; Testing: 20%.
Absolute error of model compared
with manual scoring was 0.68±0.58; 91% of images obtain a score diff <1.
Intra-obs variability show high
agreement; within subject SD=0.65 (κ
= 0.80). Average time for network
computation of image quality score
=10ms.
2017 Wang, Xiaosong, et al.
"Unsupervised Joint Mining of Deep Features and Image Labels for Large-scale Radiology Image Categorization and Scene Recognition."
Deep CNN; 215,786, 2D key-images
and the associated radiology reports of 61,845 unique patients.
Significantly better image categorization with model; clustering
accuracy=75.3%, compared to the
state-of-the-art supervised
classification accuracy of 81.0%
(when both are based on the VGG-VD model and categorized on the MIT indoor scene dataset)
2017 Wang, et al., 2017.
Unsupervised Joint Mining of Deep Features and Image Labels for Large-scale Radiology Image Categorization and Scene Recognition.
CNN; 70,000 audio segments from 26
patients; 5 methods tested: i) original spectrum ii)RASTA-PLP power spectrum, iii)RASTA-PLP cepstrum, iv)12th order PLP power spectrum without RASTA and v)12th order PLP cepstrum without RASTA.
RASTA-PLP spectrum is the best method to encode audio signals;
average accuracy=0.9965 in 200
iterations on test batches and a Fl-score = 0.9768 on samples re-sampled from the test set
2016 Ribeiro, et al., 2016.
Colonic polyp classification with convolutional neural networks.
DNN; 100 images (256×256) from 62
patients with high-definition (HD) endoscope with i-scan. Images from HD video frame regions form database (2classes of 25 healthy images from 18 patients and 75 abnormal images from 56 patients)
Superior performance compared to
state-of-the-art feature extraction techniques
2017 Wang, et al., 2017. A
multi-resolution
approach for spinal metastasis detection using deep Siamese neural networks.
Siamese Deep Neural Networks; Detection performance based on 26 cases. Sagittal MRI images of the spines from 14 males and 12 females, (58 ± 14 years; mean ± SD)
Method correctly detected 100%
spinal metastatic lesions; produced only 0.40 False Positives (FPs)/case. At a True Positive (TP) rate of 90%, aggregation reduces FPs from 0.375 FPs/case to 0.207 FPs/case (44.8% reduction)
2017 Pang, et al., 2017. A
novel end-to-end classifier using domain transferred deep convolutional neural networks for biomedical images.
DT-CNN; Image data from many
public databases: NEMA-CT database, TCIA-CT database and OASIS-MRI database
Technique overrides limitations of traditional approaches including: the need for manual design of feature space; effective feature vector classifier or segment specific detection object and image patches, large training datasets, computing resources and waiting time for training a perfect deep model
2017 Rajendra et al., 2017.
Application of Deep Convolutional Neural
DCNN; Two sets of ECG beat with
651 samples each (250 samples before Average accuracynoise removal) & 95.22% (without of 93.53% (with
Network for Automated Detection
of Myocardial Infarction Using ECG
Signals.
R-peaks detection and 400 samples
after R-peaks detection) sensitivity & specificity93.71%, & 92.83% respectively for of 93.53%, ECG beats with noise
2017 Miki, Yuma, et al.
2017. "Classification of teeth in cone-beam CT
using deep convolutional neural
network."
DCNN; 52 CT volumes randomly
divided into 42 training and 10 test cases, ROIs obtained from training cases used for training the CNN. To
examine sampling effect, 3 cycles of
sampling was done with training and testing repeated
AlexNet network architecture provided in the Caffe framework used
for study. Average classification
accuracy =88.8%; with data
augmentation, classification accuracy increased by 5%.
2017 Sharma, et al. "Deep
convolutional neural networks for automatic classification of gastric carcinoma using whole slide images in digital histopathology."
DCNN; Cancer detection: 21,000
images from each slide (AlexNet), resulting in 231,000 images. Necrosis detection: 47,130 images
Classification accuracy= 0.6990
(cancer classification); =0.8144 for necrosis detection
2014 Li, et al. "Identifying
informative risk factors and predicting bone disease progression via deep belief networks."
Deep Belief Networks (DBNs);
Variety of well-trained DBN models
applied; they inherit the ability to pinpoint underlying causes of disease to assess risk of a patient developing a target disease; discriminating between patients with & without the disease for the purpose of selecting risk factors of the disease.
Proposed method can be efficiently used to select the informative RFs and can successfully predict the progression of osteoporosis.
2017 Alcantara, et al., 2017.
Improving Tuberculosis
Diagnostics Using Deep Learning and Mobile Health Technologies among Resource-Poor
Communities in Peru. Smart Heal.
DCNN; 4701 images (453
normal-patients without TB & 4248 abnormal (patients with diff types of TB). Training data from ImageNet. Expt 1: binary categorization of X-ray into normal/abnormal by GoogleNet model room caffe. 4701 images from dataset for finetuning & testing.
89.6% accuracy for binary
classification (normal/abnormal) and 62.07% of accuracy for multi-class classification
2016 Ahn, et al., 2016.
"X-ray image classification
using domain transferred
convolutional neural networks and local sparse spatial pyramid."
DT-CNN+Sparse Spatial Pyramid Training:12677 images; Testing: 1733 images; Public dataset from (IRMA) database
Error score ranked 2nd out of 13
methods
2015 Bar, et al., 2015. "Chest
pathology detection using deep learning with non-medical training."
CNN AND GIST; Training:
non-medical dataset; Testing: 433 (443) frontal chest x-ray images
AUC 0.87-0.94 for pathologies; 1st
demo DL with ImageNet (non-medical image database)
2015 Carneiro, et al. 2015
"Automatic detection of necrosis, normoxia and hypoxia in tumors from multimodal cytological images."
Adaboost, SVM, RF, CNN; 16
images; Training=8, Validation=4 Testing=4; allowing a 4-fold cross validation testing of methodology
87% precision; best result
(validation) with Adaboost
2015 Chen, et al. "Standard
plane localization in fetal ultrasound via domain transferred deep neural networks."
DT-CNN; Training: ImageNet
(non-medical) data; 11942 expert-annotated fetal images from 300 videos; TESTING: 219 videos with 8718 images on 219 pregnant women
DT-CNN outperformed R-CNN;
AUC (DT-CNN) =0.93, R-CNN=0.9,
2017 Christodoulidis,
Stergios, et al. "Multisource Transfer Learning With Convolutional Neural Networks for Lung Pattern Analysis."
DT-CNN; Training: 40, 872 images;
Testing: 109 HRCT scans of ILDs; Manual annotations of 17 lung patterns with clinical parameters from ILD patients; 26 HRCT scans of ILDs
Performance increase above
previous system=2%;
Multitask learning =0.8631, Compressed 8-layer CNN 0.8751, Ensemble of CNNs =0.8817
2015 Chyzhyk, Darya,
Alexandre Savio, and Manuel Graña. "Computer aided diagnosis of schizophrenia on resting state fMRI data by ensembles of ELM."
ELM for CAD; SVM+RFfor feature
extraction; 72 patient images and 75 healthy controls (ages: 18-65) from COBRE’s raw anatomical & fMRI data
Classification cross-validation results
achieved near 90% accuracy
2015 van Ginneken, et al.,
2015. "Off-the-shelf convolutional neural network features for pulmonary nodule detection in computed tomography scans."
DT-CNN; 865 scans (public LIDC
dataset); 865 CT scans with 1,147 pulmonary nodules, & 3,271 excluded doubtful lesions; 4096 features from 2D sagittal, coronal & axial patches for each nodule candidate classified linear SVM
CAD: Max sensitivity=78%; CAD +
OverFeat: Av. sensitivity=71%; Off-the-shelf CNN performance less than for dedicated systems; combined approach perform better than either approach alone
2016 Bhattacharyya, et al.
"A novel approach for automated detection of focal EEG signals using empirical wavelet transform."
Least-squares-SVMclassifier
50 pairs of focal and non-focal EEG signals
Max. Accuracy=90%,
sensitivity=88%; specificity=92%
compared with previous system (750 pairs of signals): Max. Accuracy=2.53%, sensitivity=81.60% &specificity=83.46%
2016 Li, et al. "HEp-2
specimen classification via deep CNNs and pattern histogram."
CNNs + pattern histogram
2 public datasets: ICPR 2014 Task-2 (252 specimens of 1388×1040 pixels each in greyscale, categorised into seven patterns) and ICPR 2012 (28
specimens of immunofluorescence
images categorised into five patterns
a)Leave-1-specimen-out: Mean class
accuracy, MCA = 93.87% (1st 6
classes); =80.46% (all classes) b)Linear-SVM for training & testing; MCA =85.62%; Accuracy (MS) =53.33%. Compared with state-of-the-art (93.87% vs 96.03% for a). 53.33% vs 53.33% for b)
2014 Li, et al. "Medical
image classification with convolutional neural network."
Customized CNN; 16,220 image
patches from 92 HRCT image sets from 113 HRCT images, with 2062 2D annotated ROIs, TRAINING: 10 groups; TESTING: 1 of the 10 groups for testing with 9 for training data. 10 testing sessions
Customized CNN: best classification performance; Comparison with 3 approaches: (i) SIFT feature +SVM; (ii) rotation-invariant LBP feature with three resolutions + SVM; and (iii) unsupervised feature learning with RBM +SVM.
2016 Shin, et al. "Deep
convolutional neural networks for computer-aided detection: CNN architectures, dataset characteristics and transfer learning."
CNN architectures; 388 mediastinal
LNs (public dataset) labelled by radiologists in 90 patient CT scans; 595 abdominal LNs in 86 patient CT scans; 905 image slices from 120 patients, with 6 lung tissue type annotations; randomly-sampled 2.5D views in CT for LN detection; 2D CT slices for ILD detection
First 5-fold cross-validation classification results on predicting axial CT slices with ILD categories
2016 Meng, et al. "A deep
tongue image features analysis model for medical application."
Unsupervised feature learning for
training a weighted LIB LINEAR
SVM classifier
315 raw tongue image samples (48 normal, 267 abnormal) diagnosed by clinicians
Training: Unbiased convolutional kernels with randomly selected 40 normal and 44 abnormal samples
More accurate model of classification but lower precision compared with
single features; Performance
accuracy (LL-SVM)=91.14% (5.6%
above best models); precision:
8-20%; Sensitivity =4.8% (below best
performances), specificity =15%
(superior to other methods)
2016 Moradi, et al. "A hybrid
semantic labeling of cardiac CT slices and recognition of body position."
2D axial slices, slice spacing ranging 0.8-2mm). Experienced radiologist (PP) labeled 1 slice for each patient as the best representative of each level, when that level was available in the series. Total 595 labeled 2D images generated.
feature: margin1 accuracy=98.8%, and margin0 accuracy =91.7%; hybrid approach shows higher accuracy
2017 Lopez, et al. "Skin
lesion classification from dermoscopic images using deep learning techniques."
CNN + pattern histogram; Benign/malignant images pre-partitioned into sets of 900 training images and 379 test images; Dermofit Image dataset of 1,300 high quality skin lesion images collected across 10 different classes. Dermnet skin disease atlas with website support that contains over 23,000 skin images separated into 23 classes
Existing CNN architecture used to: (i) train CNN from scratch; (ii) DT-CNN for features extraction (iii) Fine-tuning of CNNs
i. Training vs testing; Loss/
Accuracy/ Sensitivity/Precision
i)Training from scratch: 0.5637/71.87%/0.7087/0.6990 vs 0.6743/66.00%/0.5799/0.6777
ii) ConvNet as feature extractor: 0.120/95.95%/0.9621/ 0.9560 vs 1.0306/68.67%/ 0.3311/0.4958
iii) Fine-tuning the ConvNet: 0.4891/76.88%/0.6903/ 0.8259 vs 0.4337/81.33%/ 0.7866/ 0.7974
Summary: 78.66% sensitivity & 79.74% precision are significantly higher than the current state of the art on this dataset (50.7% and 63.7%, respectively)
2016 Sabouri and Hamid,
2016. "Lesion border detection using deep learning."
3-layer CNN; Training dataset: 480 lesion & 1200 background images; divided into 50×50 patches & labelled as lesion or background
Best testing accuracy obtained with 52 most challenging images in the dataset rather than all images. Jaccard index (similarity coefficient score) compared for similarity & diversity in data samples; useful for calculating accuracy by measuring similarity between segmented image (obtained through algorithm) & the ground truth image
2016 Sarraf, and Ghassem.
2016. "Deep learning-based pipeline to recognize Alzheimer's disease using fMRI data."
3-layer CNN; 28 Alzheimer sufferers, 15 normal subjects (24 female and 19 male); mean age 74.9 5.7 years selected from the ADNI dbase, data divided into: training (60%), validation (20%), &testing (20%); epochs set to 30, batch size 64, total 126,990 iterations. LeNet trained by 270,900 samples and validated & tested by 90,300 images in 5-fold cross-validations on NVIDIA GPU Cloud Computing
Training and testing;
Accuracies of CNN on the 5 runs:
Run1=96.858; Run2=96.857 Run3=96.854 Run4-96.863 Run-5=96.8588;
Overall Mean or Summary Accuracy of testing data: up to 96.85%
2016 Suzuki, et al. 2016.
"Mass detection using deep convolutional neural network for mammographic
computer-aided diagnosis."
CNN + SVM; Initial Training: 1.2 million non-medical images, (ImageNet) to classify1,000 classes; subsequent training: 1,656 regions of interest (ROI) in mammographic image; Testing: 198 mammographic images including 99 mass images and 99 normal images.
Sensitivityof the mass detection was
89.9% and the false positive was
19.2%.
References
411
1. Litjens G, Kooi T, Bejnordi BE, Setio AAA, Ciompi F, Ghafoorian M, et al. A Survey on Deep Learning
412
in Medical Image Analysis. arXiv. 2017;1702.05747(February):1–34.
413
2. Kantarjian H, Yu PP. Artificial Intelligence, Big Data, and Cancer. JAMA Oncol. 2015;1(5):573.
414
3. Wang Z, Qu Q, Yu G, Kang Y. Breast tumor detection in double views mammography based on extreme
415
learning machine. Neural Comput Appl. 2016;27(1):227–40.
416
4. Lee J-G, Jun S, Cho Y-W, Lee H, Kim GB, Seo JB, et al. Deep Learning in Medical Imaging: General
417
Overview. Korean J Radiol. 2017;18(4):570.
418
5. Vo A, Brooks B, Farr R, Raimer B. Benefits of Telemedicine inRemote Communities & Use of mobile and
419
Wireless Platforms in Healthcare. University of Texas Medical Branch. Texas: University of Texas
420
Medical Branch (UTMB Health); 2011.
421
6. Ding S, Zhang N, Zhang X, Wu F. Twin support vector machine: theory, algorithm and applications.
422
Neural Comput Appl. 2016;(March):1–12.
423
7. Campbell JP, Ataer-Cansizoglu E, Bolon-Canedo V, Bozkurt A, Erdogmus D, Kalpathy-Cramer J, et al.
424
Expert Diagnosis of Plus Disease in Retinopathy of Prematurity From Computer-Based Image Analysis.
425
JAMA Ophthalmol. 2016;134(6):651.
426
8. Lu L, Shin H, Roth HR, Gao M, Lu L, Member S, et al. Deep Convolutional Neural Networks for
427
Computer-Aided Detection : CNN Architectures , Dataset Characteristics and Transfer Learning Deep
428
Convolutional Neural Networks for Computer-Aided Detection : CNN Architectures , Dataset
429
Characteristics and Transfer. IEEE Trans Med Imaging. 2016;35(5):1285–98.
430
9. Karsoliya S. Approximating Number of Hidden layer neurons in Multiple Hidden Layer BPNN
431
Architecture. Int J Eng Trends Technol. 2012;3(6):714–7.
432
10. Sussillo D, Barak O. Opening the black box: low-dimensional dynamics in high-dimensional recurrent
433
neural networks. Neural Comput. 2013;25(3):626–49.
434
11. Alice M. Selecting the number of neurons in the hidden layer of a neural network. R-Bloggers. 2017.
435
12. Greenspan H, Ginneken B van, Summers RM. Guest Editorial Deep Learning in Medical Imaging:
436
Overview and Future Promise of an Exciting New Technique. IEEE Trans Med Imaging. 2016;35(5):1153–
437
9.
438
13. Yu W, Yang K, Bai Y, Xiao T, Yao H, Rui Y. Visualizing and Comparing AlexNet and VGG using
439
Deconvolutional Layers. Int Conf Mach Learn. 2016;48.
440
14. Ballester P, Araujo RM. On the Performance of GoogLeNet and AlexNet Applied to Sketches. Proc 30th
441
Conf Artif Intell (AAAI 2016). 2016;1124–8.
442
15. Li Q, Cai W, Wang X, Zhou Y, Feng DD, Chen M. Medical Image Classification with Convolutional
443
Neural Network. 13th Int Conf Control Autom Robot Vis. 2014;2014(December):844–8.
444
16. Sermanet P, LeCun Y. Traffic sign recognition with multi-scale Convolutional Networks. 2011 Int Jt Conf
445
Neural Networks. 2011;2809–13.
446
17. Finucane TE. How is geriatrics different from general internal medicine? Geriatr Gerontol Int. 2004;4(4).
447
18. Sarraf S, Tofighi G. Deep Learning-based Pipeline to Recognize Alzheimer ’ s Disease using fMRI Data.
448
In: Future Technologies Conference (FTC) 2016 6-7 December, San Franscisco, United States. San Franscisco:
449
IEEE; 2016. p. 816–20.
450
19. Ahn E, Kumar A, Kim J, Li C, Feng D, Fulham M. X-ray Image Classification Using Domain Transferred
451
Convolutional Neural Networks and Local Sparse Spatial Pyramid. In: IEEE 13th International Symposium
452
on Biomedical Imaging (ISBI), 13-16 April 2016. Prague, Czech Republic: IEEE; 2016. p. 855–8.
20. Li H, Huang H, Zheng W, Xie X, Zhang J. HEp-2 Specimen Classification via Deep CNNs and Pattern
454
Histogram. In: 2016 23rd International Conference on Pattern Recognition (ICPR) Cancún Center, Cancún,
455
México, December 4-8, 2016. Cancún, México: IEEE; 2016. p. 2145–9.
456
21. Ginneken B van, Setio AAA, Jacobs C, Ciompi F. Off-the-Shelf Convolutional Neural Network Features
457
for Pulmonary Nodule Detection in Computed Tomography Scans. IEEE 12th International Symposium
458
on Biomedical Imaging (ISBI), New York, NY, 2015, pp. 286-9.
459
doi: 10.1109/ISBI.2015.7163869.
460
22. Christodoulidis S, Anthimopoulos M, Ebner L, Christe A, Mougiakakou S. Multisource Transfer
461
Learning with Convolutional Neural Networks for Lung Pattern Analysis. IEEE J Biomed Heal Informatics.
462
2017;21(1):76–84.
463
23. Krizhevsky A, Sutskever I, Hinton GE. ImageNet Classification with Deep Convolutional Neural
464
Networks. Adv Neural Inf Process Syst. 2012;1–9.
465
24. Bar Y, Diamant I, Wolf L, Greenspan H. Chest Pathology Detection using Deep Learning with
Non-466
Medical Training. In: 2015 IEEE 12th International Symposium on Biomedical Imaging (ISBI), 16-19 April
467
2015. Tel Aviv: IEEE; 2015. p. 1–8.
468
25. Wang X, Lu L, Shin H, Kim L, Bagheri M, Nogues I, et al. Unsupervised Joint Mining of Deep Features
469
and Image Labels for Large-scale Radiology Image Categorization and Scene Recognition. In: 2017 IEEE
470
Winter Conference on Applications of Computer Vision. IEEE Computer Society; 2017. p. 998–1007.
471
26. Bhattacharyya A, Sharma M, Pachori RB, Sircar P, Acharya UR. A novel approach for automated
472
detection of focal EEG signals using empirical wavelet transform. Neural Comput Appl. 2016;1–11.
473
27. Chyzhyk D, Savio A, Graña M. Computer aided diagnosis of schizophrenia on resting state fMRI data
474
by ensembles of ELM. Neural Networks. 2015;68:23–33.
475
28. Narula S, Shameer K, Salem Omar AM, Dudley JT, Sengupta PP. Machine-Learning Algorithms to
476
Automate Morphological and Functional Assessments in 2D Echocardiography. J Am Coll Cardiol.
477
2016;68(21):2287–95.
478
29. Carneiro G, Peng T, Bayer C. Automatic Detection of Necrosis , Normoxia and Hypoxia in Tumors from
479
Multimodal Cytological Images. Int Conf Image Process. 2015;2:2–6.
480
30. Sharma H, Zerbeb N, Klempert I, Hellwich O, Hufnagl P. Deep convolutional neural networks for
481
automatic classification of gastric carcinoma using whole slide images in digital histopathology. Comput
482
Med Imaging Graph. 2017;In Press.
483
31. Alcantara MF, Cao Y, Liu C, Liu B, Brunette MJ, Zhang N, et al. Improving Tuberculosis Diagnostics
484
Using Deep Learning and Mobile Health Technologies among Resource-Poor Communities in Peru.
485
Smart Heal. 2017;(April).
486
32. Suzuki S, Zhang X, Homma N, Ichiji K, Sugita N, Kawasumi Y, et al. Mass Detection Using Deep
487
Convolutional Neural Network for Mammographic Computer-Aided Diagnosis. In: Proceedings of the
488
SICE Annual Conference 2016 September 20-23, 2016. Tsukuba, Japan: SICE; 2016. p. 1382–6.
489
33. Luong C, Abdi A, Jue J, Gin K, Fleming S, Abolmaesumi P, et al. Automatic Quality Assessment of Echo
490
Apical 4 - chamber Images Using Computer. Circulation. 2016;134(1):5–7.
491
34. Rajendra Acharya U, Fujita H, Shu Lih O, Hagiwara Y, Hong Tan J, Adam M. Application of Deep
492
Convolutional Neural Network for Automated Detection of Myocardial Infarction Using ECG Signals
493
Application of Deep Convolutional Neural Network for Auto- mated Detection of Myocardial Infarction
494
Using ECG Signals. Inf Sci (Ny). 2017;1–18.
495
35. Chen H, Ni D, Qin J, Li S, Yang X, Wang T, et al. Standard Plane Localization in Fetal Ultrasound via