City, University of London Institutional Repository
Citation
: Jianu, R. & Alam, S. S. (2017). A Data Model and Task Space for Data of
Interest (DOI) Eye-Tracking Analyses. IEEE Transactions on Visualization and Computer
Graphics, doi: 10.1109/TVCG.2017.2665498
This is the accepted version of the paper.
This version of the publication may differ from the final published
version.
Permanent repository link:
http://openaccess.city.ac.uk/16941/
Link to published version
: http://dx.doi.org/10.1109/TVCG.2017.2665498
Copyright and reuse:
City Research Online aims to make research
outputs of City, University of London available to a wider audience.
Copyright and Moral Rights remain with the author(s) and/or copyright
holders. URLs from City Research Online may be freely distributed and
linked to.
City Research Online: http://openaccess.city.ac.uk/ [email protected]
A Data Model and Task Space for Data of
Interest (DOI) Eye-Tracking Analyses
Radu Jianu
†,and Sayeed Safayet Alam
∗Abstract—Eye-tracking data is traditionally analyzed by looking at where on a visual stimulus subjects fixate, or, to facilitate more advanced analyses, by using area-of-interests (AOI) defined onto visual stimuli. Recently, there is increasing interest in methods that capture what users are looking at rather than where they are looking. By instrumenting visualization code that transforms a data model into visual content, gaze coordinates reported by an eye-tracker can be mapped directly to granular data shown on the screen, producing temporal sequences of data objects that subjects viewed in an experiment. Such data collection, which is called gaze to object mapping (GTOM) or data-of-interest analysis (DOI), can be done reliably with limited overhead and can facilitate research workflows not previously possible. Our paper contributes to establishing a foundation of DOI analyses by defining a DOI data model and highlighting its differences to AOI data in structure and scale; by defining and exemplifying a space of DOI enabled tasks; by describing three concrete examples of DOI experimentation in three different domains; and by discussing immediate research challenges in creating a framework of visual support for DOI experimentation and analysis.
Index Terms—Eye-tracking, Taxonomies, Visual Analysis Models
F
1
I
NTRODUCTIONE
YE-tracking is invaluable at explaining how people per-ceive, solve visual tasks, and use interfaces [1]. How-ever, much of the technology’s full potential is untapped, as most eye-tracking studies explore key-hole scenarios involving static images, simple tasks, and no interaction.This is at least in part because gazes are traditionally analyzed as pixel coordinates of rendered visual frames. Relating these coordinates to the content of the stimulus (i.e., which visual object does the gaze map to) is generally done manually, by inspecting or annotating each of the stimulus’ frames. This makes eye-tracking evaluations of interactive stimuli (e.g., an interactive data visualization, a visual ana-lytics system) prohibitively time-consuming, since, through interaction, each participant creates their own personalized stimulus which needs to be analyzed individually.
Recently there is increasing interest in analyzing directly what users look at rather than where they look [2], [3], [4]. Such methods are applicable to computer generated visual content: since positions and shapes of objects shown on the screen are known at rendering, gaze coordinates can be mapped automatically, in real time to a visualization’s content. The output is a list of granular data-objects users viewed at any time in an experiment (e.g., individual nodes in a network, 3D objects in a scene). We will refer to these objects as data-of-interest (DOI), a name used by Alam et al. to underline the analogy with areas of interest (AOI) [2].
We argue that the DOI approach can support in-vivo, data-driven eye-tracking experiments not previously possi-ble. First, in-vivo because DOI methods track users’ interest
• ∗R. Jianu is with City University London. E-mail: [email protected]
• †S. S. Alam is with the School of Computing and Information Sciences, Florida International University, Miami, FL, 33199.
E-mail: [email protected]
in DOIs regardless of how their visual representations move or change on the screen as a result of interaction, and they do so automatically, without the need for human annotation. This means that DOI data can be captured effortlessly from many users, exploring interactive content, over extended periods of time [2]. Second, data-driven because DOIs are subsets of data underlying an experiment, and are thus explicitly described by attributes of that data (e.g., label, object type, object function). These attributes can be readily visualized and mined in data-driven analyses, to explain or uncover participants’ data exploration patterns.
This paper introduces the DOI approach, and makes necessary contributions towards applying it in practice. These contributions are:
• Three concrete examples of novel eye-tracking ex-periments enabled by the DOI approach in distinct domains (computer science, architecture instruction, and construction safety) using three different types of interactive visual content (2D, 3D, HTML). We de-scribe the process of DOI instrumentation, the types of collected data, and the broad research questions pursued.
• A formal DOI data model that builds on the generic EAV (entity-attribute-value) model, exemplified in the context of the three applications.
• A formal range of possible and probable questions that can be asked of DOI data. To this end we leveraged existing work on task spaces, frameworks, and taxonomies, in particular those of Roth [5] and Andrienko et al. [6].
• Limitations of existing methods, in particular those targeting AOI data, in supporting the analysis of DOI data, and a discussion on requirements and challenges in creating such support.
development of novel visual encodings and visual analytics designs by formalizing requirements and supporting eval-uation [7], [8]. Such resources have just started to appear even in the context of established AOI experimentation [9], [10], and did not yet exist for DOI data. Moreover, we show that differences between AOIs and DOIs are significant and justify the need for new nomenclature and a framework for analysis. Overall, our work is intended to serve as a baseline for, and motivate, future design studies and systems that will explore the use of DOI analyses in practice.
2
B
ACKGROUND ANDR
ELATEDW
ORKHere we give a brief primer on visual perception, then describe traditional ways in which eye-tracking is used, specific methods we build on, and the paper’s novelty.
2.1 Visual perception
The fovea, a high acuity region in the center of the eye, allows us to perceive small sections of our field of view in great detail. To extract information from a scene, we translate our fovea using rapid movements (e.g., 50ms) called saccades between different of points of interest in the scene. We fixate those points of interest for short periods of time (e.g., 250ms) to extract detail around them.
The movements of the fovea are generally guided by vi-sual cues perceived in the peripheral view (an exception are memory-guided saccades [11]). Often these cues support the task we try to accomplish and are determined by cognitive processes. This type of visual cue selection is referred to as top-down. Other times, our fovea is drawn automatically to features that we evolved to perceive as inherently inter-esting. Examples include movement and sharp edges. This type of cue selection is known as bottom-up.
Visual scanning is the product of an interaction and com-petition between the top-down and bottom-up systems [11], [12]. As such, eye-movement patterns are generally cor-related with peoples’ visual task, as demonstrated early by Yarbus [13], as well as with inherently salient cues in the stimuli. This supports the eye-mind hypothesis which postulates that there is a correlation between what people think and where they look [14]. Despite a few exceptions and limitations (see Section 9), it is generally accepted among eye-tracking practitioners that the eye-mind connec-tion holds [15].
2.2 Conventional eye-tracking experimental methods
Eye tracking, among other uses, can tell us where on a com-puter screen a user is looking. Despite several limitations in technology and predictive power (see Section 9), it is generally considered that eye-tracking can capture people’s specific interests in visual stimuli and provide insight into perceptual and cognitive processes [14], [15], [16], [17].
Eye-tracking is widely used in fields such as psychol-ogy, neuroscience, human-computer interaction, and data visualization to investigate how people perceive and think with visual stimuli [1]. In a traditional eye-tracking study, subjects perform visual tasks while their eyes are moni-tored by an eye-tracker. For example, researchers studied how people recognize faces [18], how students learn from
graphical content [19], or how people interpret graph visu-alizations [20], [21] and tree-drawings [22]. The breadth and scope of eye tracking research is growing as eye-trackers become increasingly accurate, fast, and affordable [23].
Eye-tracking data is generally analyzed using one of two approaches: point-based and area-of-interest (AOI)-based [23]. The first revolves around analyzing users’ gazes as 2D coordinates in the space of visual stimuli. The disad-vantages of this approach are that users need to view the same stimuli in order for their data to be comparable, and that gazes need to be manually related to the semantic con-tent of the stimuli (i.e., match gazes to objects in an image) by viewing gaze heatmaps for instance. The second bins individual gazes into AOIs that analysts define manually and which have semantic meaning. Using AOIs, higher-level analyses that target the content of visual stimuli are possible. The drawback of this second method is the need for defining and reshaping AOIs for each frame viewed during an experiment.
Both approaches are prohibitively time-consuming for long experiments involving many visual stimuli, and dy-namic or interactive stimuli (e.g., videos, real visualization systems). Several solutions have been proposed to address this limitation. If we assume that AOIs correspond to hotspots of viewing activity, then they could be defined au-tomatically using gaze clustering algorithms [24], [25], [26]. However, AOIs defined in this way are not guaranteed to be closely related to the semantic content of viewed stimuli. For 3D stimuli, Stellmach et al. introduced the concept of objects of interests (OOI) where gazes accumulate on surfaces of 3D objects in the scene [27]. Steichen et al. [28], and Kurzhals et al. [29] imply that AOIs could be dynamically defined when the visualization content is computer generated, but do not explicitly pursue this approach.
2.3 Tracking interactive visual content using the DOI approach
Our research builds on recent results that advocate for using eye-tracking to detect what users are viewing rather than where they are looking. For computer generated visual content (e.g., data visualizations, 3D contents, interfaces), code determines when, where, and how data is drawn on the screen at any moment in time. As such, it can be instru-mented to continuously map gaze coordinates supplied by an eye-tracker to visual objects rendered on the screen, and potentially further downstream to the data they represent.
This approach is particularly suited for evaluating the use of interactive visual content (e.g., interactive visual-izations and visual analytic systems, computer games) a focus of increasing interest [30]. Should data enter or exit the screen, or be moved or reshaped through animation or interaction (e.g., a visual object is dragged to a different po-sition), gazes continue to be correctly related to the updated state of the visualization. Moreover, once visualization code instrumented, it will be able to track any data-set that it supports, in any usage scenario, without additional effort.
analyses (DOI) [2]. In the same way that AOIs are image sub-regions with particular semantic meaning, DOIs are subsets of a visualization’s underlying data. For example, in a network visualization, DOIs may be individual nodes or clusters of nodes; in a 3D scene-rendering they may be ob-jects or components of obob-jects. We introduced an algorithm for accurate object detection, showed that mapping gazes to DOIs can be done accurately even for granular DOIs (e.g., individual data-objects such as nodes in a network), and de-scribed how interactive visualizations can be instrumented with relatively low overhead [2].
2.4 Related work
Our first contribution aligns with efforts to categorize vi-sualization tasks and organize them into task-taxonomies. Wehrend and Lewis, and later Shneiderman, were among the first to describe high level taxonomies of typical user tasks in data visualizations [31], [32]. Andrienko et al. and later Roth explored possible tasks in geo-temporal data [6]. Amar et al. proposed more detailed classifications of vi-sualization task types while exploring multidimensional data analysis [7]. More recently, Brehmer et al., Schulz and Nocke, and Rind et al. proposed multi-level task frame-works that can aid in creating complete task descriptions regardless of domain [33], [34], [35]. At the same time, specific task taxonomies were defined for visualizations of graph-data [36], group-level graphs [37], multidimensional data visualization [38], [39], and temporal data [40]. Task taxonomies and frameworks help define visualization re-quirements that drive visualization research [7], and support evaluation by supplying benchmark tasks [8], [41], [42].
Work on such data and task formalisms in the context of AOI or DOI analyses is minimal. Kurzhals et al. [9] and Blascheck et al. [10] only recently structured AOI based analysis into a list of tasks and requirements. Their work however doesn’t capture the semantic aspects specific to DOI data and the questions these facilitate. Raschke et al. [43] proposed to annotate AOIs with semantic informa-tion. This moves AOIs closer to our idea of DOIs. However, the authors don’t consider that such semantics can be gener-ated automatically from a visualization’s data and encoding, and do not explore the range of questions it could facilitate. Bernhard et al. describe data that gaze-to-object mapping produces [4], but define it less generally than we do here, and exclusively in the context of 3D scene stimuli. Our work alleviates these shortcomings.
We also motivate a need for novel DOI visual encodings and analytics techniques. Many visualizations of AOI data have been proposed and are summarized exhaustively by Blascheck et al. [23]. Examples include scan paths, scarf plots, AOI rivers, and AOI transitions matrices. Research also exists on visual analytics principles and systems target-ing AOI data, such as those by Andrienko et al. [44], Weibel et al. [45], Kurzhals et al. [29], and Blascheck et al. [30]. We will show that such methods do not scale to DOI data and are not suited for answering the types of questions that DOI data can answer. Our paper describes immediate challenges in extending existing methods to support DOI analyses, and provides requirements that can inform the design of entirely novel techniques.
3
M
ETHODWe pursued the contributions listed in Section 1 using a parallel two-folded approach. On the one hand, we consid-ered DOI data that can be collected in eye-tracking exper-iments, and questions it can answer, in a purely concep-tual way. We focused our efforts in imagining exhaustive data models that can describe and support a full range of possible eye-tracking experiments, including many users and diverse visual stimuli (e.g., interactive), data (e.g., time varying data), and research goals (e.g., understanding visual perception, understanding higher-level cognitive and data foraging behavior). We then followed guidelines from state of the art generative task-frameworks, in particular those of Andrienko et al. [6] and Roth [5], to consider questions this data can answer. This approach aligns with conceptual efforts at structuring tasks and analytic requirements in various domains [6], [37], [40], [46].
Second, we ground such conceptual work in practice by pursuing our own eye-tracking applications, and by col-laborating with scientists in other domains to further their research. These efforts resulted in pilot studies, preliminary data, and design and requirement discussions. We also drew from our experience with AOI approaches and the questions that researchers typically tried to answer using them. These efforts seeded, guided, and refined our conceptual efforts.
This methodology was determined by a relatively barren research landscape. Other domain-specific task taxonomies could build on and restructure extensive previous knowl-edge from design studies, visualization techniques, and data formalisms (e.g., on graph data [36], temporal data [40], [46]), or on a pool of seasoned practitioners (e.g., in geo-graphical data [5]). Conversely, the idea of DOI analyses is relatively unexplored. Our case studies allowed us to consider a minimal sample of practical applications, while formal tasks frameworks allowed us to extrapolate from them in a rigorous way.
4
T
HREE CONCRETEDOI
APPLICATIONSWe currently explore the use of the DOI methodology in three concrete projects. We report on the instrumentation process, the data collected, and the research goals of these projects as a means of exemplifying the research processes that the DOI approach can facilitate.
4.1 Tracking data consumption in visualization sys-tems
We study the degree to which the DOI approach can enable visualization researchers and analysts to track and under-stand what data users are foraging for, and what types of questions they are trying to answer while using interactive visualization systems. We showed that DOI data can reveal to an analyst, even in real-time, details about the tasks users are pursuing in an interactive visualization [2], [47].
users could select and highlight data, and could change the subset of data shown at any given time.
We instrumented the visualization by inserting instruc-tions that mirrored its modeling and rendering code so as to inform a viewed-object detection module of the shapes, positions, and attributes (e.g., actor name, age, gender) of objects shown on the screen at any given time. We tracked individual data items (e.g., actor). The object-detection mod-ule matched 2D gazes received from an eye-tracker to screen-objects reported by the visualization. We collected data from9subjects using these visualizations interactively for thirty to forty five minutes. The experimentation and instrumentation process is described in detail in [2].
Typical questions we found that we were able to answer from DOI data were: ”Did a user try to solve a given task, or did they focus on specific data?”, ”Did a tracked user switch their analysis focus?”, ”When did a tracked user start solving a specific task?”, ”What data did users focus on when asked to solve a particular task?”. Such analyses can advance the visual analytics agenda by providing un-precedented insight into how users forage for and analyze data naturally, in interactive visual analytics systems and over extended periods of time.
4.2 Understanding student learning
We work with education researchers to understand how stu-dents learn architecture using visual, interactive instruction material. In a preliminary pilot study with six subjects, we found that we can collect detailed DOI data from students learning via an interactive learning environment, to reveal the type of content learners focus on, and the sequences and patterns in which they do so.
We explored an existing learning environment designed to teach architecture concepts related to facades and en-ergy efficient building materials. This learning module was structured as an informational web application (HTML + javascript), contained primarily text and images, and was interactive in that students could navigate between learning concepts, collapse and expand sections, and obtain details on demand.
As described before, we instrumented the HTML and javascript code to allow the learning environment to per-manently communicate (via AJAX protocols) to a viewed-object detection module the shape, position, and nature (i.e., attributes) of the content it showed on the screen at any moment in time. As part of our experimental setup, students interacted with the web-content on a local machine that was equipped with an eye-tracker. The detection module received gaze-data from the eye-tracker and matched it to the visual content reported by the learning environment, to identify and record likely viewing targets.
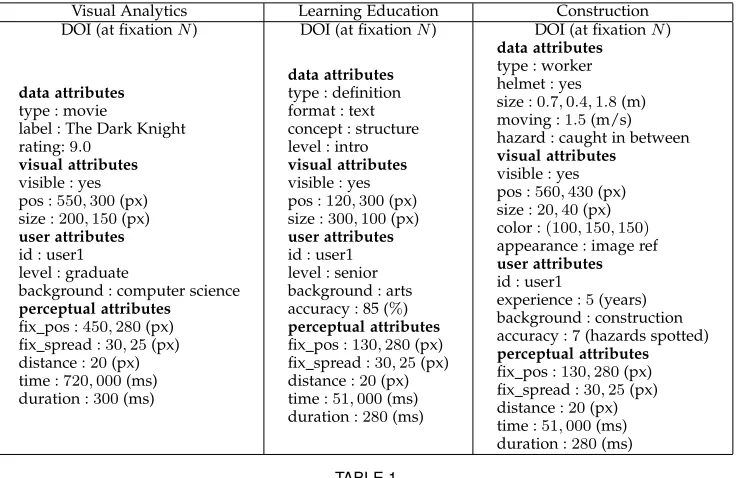
Generally, individual DOM elements with sufficient se-mantic meaning (e.g., paragraphs, images, headers, naviga-tion widgets) formed the basis of DOI elements (Figure 1). However, several images depicted complex schematics or included multiple panels. In such cases, we defined more granular DOIs within those images.
DOIs were annotated with attributes such as which learning concept the DOI was referring to (e.g., facade, heat transmission, material type) and its complexity level (intro-ductory, medium, advanced), the type of visual content it
was depicted with (e.g., text, image, navigation widget), and the type of learning content (e.g., definition, example, exer-cise). These attributes were communicated by the learning environment to the instrumentation library, which in turn stored them as part of the description of viewed objects.
In our pilot experimental setup, six students spent ap-proximately forty five minutes exploring freely and absorb-ing the content illustrated in the learnabsorb-ing module, as their gazes were tracked. At the end, their learning was quanti-fied using a relatively short multiple choice questionnaire. Additionally, we collected information about students’ edu-cational background (e.g., pursued major, career interests), degree progress (softmore, junior, senior), and general de-mographic profile (e.g., age, gender).
[image:5.612.314.564.372.527.2]This experimental setup and data collection process were designed to allow our collaborators to answer several high level research questions expressed at our project’s outset. These include: ”Does a particular type or learning content or viewing pattern correlate with more effective learning?”; ”Does student background (e.g., engineering, science, arts) correlate with the type of content students focus on?”; ”Are there viewing patterns that can predict learning de-ficiencies?”. We hypothesize that the highly granular and annotated DOI data collected over long periods of time from students learning ”in the wild” from interactive visual content will facilitate insight different than that enabled by typical AOI-driven eye-tracking analyses.
Fig. 1. One page of an interactive, HTML environment for learning archi-tecture concepts instrumented using Sayeed and Jianu’s approach [2]. Overlays illustrate defined DOIs.
4.3 Exploring how workers detect and assess haz-ardous situations on construction scenes
We collaborate with civil engineering researchers wishing to understand and model how construction workers identify and respond to safety hazards in construction scenes. Such research is important as the construction industry suffers from the highest number of occupational fatalities among all the industries.
difficult, if not impossible. Moreover, capturing and analyz-ing eye-trackanalyz-ing data for videos is laborious, thus limitanalyz-ing previous experiments to short, constrained scenarios.
Instead, we modeled a 3D construction scene from a real scene, using the Unity 3D framework, and had subjects explore this scene virtually on a computer screen, while an eye-tracker, in lieu with DOI instrumentation, captured which construction elements they observed.
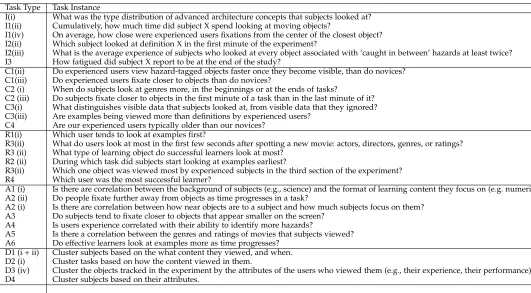
The scene was dynamic and involved multiple unfolding hazardous situations (e.g., a construction worker rushing in front of a vehicle). Subjects were assigned a virtual character which was placed in a truck that moved along a predetermined path through the scene (Figure 2). Subjects had no control over the transition of the camera (i.e., the truck’s path), but they could change their viewing angle by rotating the camera in the horizontal plane. The whole ’trip’ through the construction scene lasted approximately 10minutes.
We instrumented the Unity scene using Bernhards’ GTOM approach [4]. Specifically, in addition to rendering the scene on the screen for subjects to view, we assigned each tracked object a specific color and rendered objects into a color buffer. We then identified colors in the proximity of gaze coordinates supplied by the eye-tracker, and used this information to detect objects subjects potentially viewed. An example of the process is illustrated in Figure 2.
Through the instrumentation process we exported object attributes such as type (e.g., machinery, human, static), hazards associated with each object (e.g., collision, elec-trocution), whether objects were moving or not, and their distance from the subject’s camera. At the same time, we used the color buffers to compute the size of objects and their position (i.e., center of mass) on the screen, and we tracked which of all objects were visible and which not. We note that the latter five types of attributes were time dependent. We also recorded screen captures, and computed the bounds of objects on the screen.
We collected such DOI data from sixteen subjects, half of which had construction training and half which had not. Subjects were asked to complete a post-questionnaire about which hazardous situations they detected. Additionally, we collected subject-specific information such as experience and training levels.
Specific questions that our collaborators expressed in-terest in, and that this experimental setup was designed to answer, included ”Viewing which types of visual items lead workers to identify specific hazards?”, ”How does the interest of experienced and novice construction workers in construction scene elements differ?”, ”Are there any low-level visual patterns that are specific to experienced con-struction workers?”, and ”What types of hazards might go unnoticed at a construction site?”.
In addition to enabling the study of hazardous situations that are not safe to reproduce in vivo, we hypothesize that this DOI approach will eventually facilitate a novel, data-driven experimentation process. Specifically, our collabo-rators will be able to alter the construction scene often, between participant groups and in response to subjects’ actions, or to simulate varied types of hazards and con-struction scene configurations, and record resulting visual behavior. Examples of alterations include removing a virtual
[image:6.612.313.566.159.346.2]worker’s reflective vest, altering the path of a worker to lead through a dangerous area, and removing or adding warning signs. Such experimentation can thus lend significant more data than traditional eye-tracking experimentation and fa-cilitate novel workflows. While it is true that data collected in this way is of less ecological validity than that collected in situ, initial studies have shown that viewing patterns captured in virtual scenes may approximate those captured in real scenes well [50].
Fig. 2. A 3D construction scene model (top) instrumented using Bern-hard et al.’s color-buffer (bottom) approach [4]. Each 3D object tracked in the scene is projected in the color buffer using a distinct color. Gazes are mapped to objects in the 3D space via their colors in the buffer.
5
A
GENERALDOI
DATA MODELAs described in Section 2, peoples’ foveas are guided by visual cues in perceived scenes. To study how people parse a scene, especially from a perceptual (bottom-up) perspective, access to the visual attributes of objects in it (e.g., color, movement) is indispensable. However, visual attributes often encode semantic properties of data (e.g., color may encode disease type in a medical visualization). To hypothesize about cognitive and goal-directed processes that drive visual ones, analysts may wish to investigate directly what data people looked at, as opposed to how the data was shown. This aligns with the top-down theory of visual processing, which implies that it is meaning and significance of content, together with representation, that drives visual scanning. The DOI approach is to capture both visual and semantic data from eye-tracking experiments to support diverse research questions, such as about percep-tion, cognipercep-tion, or data exploration and search.
that captures this idea, and exemplify it in the context of the three case studies (Table 1).
We approximate a visualization’s data using the generic entity-attribute-value (EAV) data model [51], in which enti-ties are described by combinations of attribute-value pairs. We thus define data as the setD, containing a number ofNd
data entitiesd. Each entity is itself defined by multiple pairs of data attributes (da) and data attribute values (dav):
D={di|i= 1..Nd} di={dai,k=davi,k|k= 1..Ndai}
The definition above describes static datasets. In real applications data can change over time as a result of user interaction (e.g., user changes the speed of a vehicle in a 3D simulation; user annotates or deletes data in a visualiza-tion), or as a result of factors external to the visualization (e.g., data is streamed from a simulation). We augment the definition to include a temporal domainT (e.g., the time of the eye-tracking experiment):
Dt={di,t|i= 1..Ndt, t∈T} di,t={dai,t,k=davi,t,k|k= 1..Ndai,t}
Visualizations turn datasets into visual models by defin-ing visual elements to represent data elements. While this mapping is often one to one, this is not necessarily true; multiple data elements might be captured by a single visual representation. As such, we will define a visual model as the set M, containing Nm visual entities m. Each visual entity contains a reference to one or more data entities it depicts, and a collection of visual attributes and values that define it (e.g., position, shape, size, color). As before, our definition accounts for possible changes over time, as users may change a visualization through interaction.
Mt={mi,t|i= 1..Nmt, t∈T} mi,t ={ {dj,t|j = 1..Nmdi,t},
mai,t,k=mavi,t,k|k= 1..Nmai,t}
Finally, models are rendered on the screen via a trans-formation (e.g., dependent on zooming and panning in 2D visualizations) or projection (e.g., dependent on perspective changes in 3D). The mapping between model and screen entities is generally one to one (i.e., one screen entity for each model entity), but attribute values may differ between model and screen entities even when attribute names are similar. For example, an entity’s size in model space is often not the same as in screen space. So, we define our screen visualization as a set of screen entities, same in number as model entities, with one associated model entity, and pairs of screen attributes and values. Screen attributes can include screen-capture cutouts of individual DOIs.
St={si,t|i= 1..Nmt, t∈T}
si,t={mi,t, sai,t,k=savi,t,k|k= 1..Nsai,t}
Eye-trackers report fixations periodically, as time-stamped 2D coordinates with an associated duration. Fix-ations may be described by additional properties such as dispersion or pupil size.So, we define fixations reported during an experiment as:
Ft={x, y, duration, f ak=f avk|k= 1..Nf at}, t∈T
Both Bernhard et al. [4] and Alam et al. [2] compute candidate objects a user is likely to have viewed during a fixation by considering not just the fixation point, but also a small area around it. If multiple DOIs intersect that area, Bernhard et al. report only the object closest to the fixation, while Alam et al. report all viewing candidates. For a more general DOI data model we will consider Alam et al.’s approach. Thus, each fixation may be associated with multiple viewed DOIs and the confidence that a DOI was indeed the locus of a user’s attention is proportional to the proximity of the fixation to the DOI [2]. For maximum flexibility, DOI instrumentations can record the distance of users’ fixations to all DOIs, postponing its interpretation (i.e., should an object be considered viewed or not viewed given a specific distance) until the analysis stage:
d(Ft, si,t) =
pixels f rom F to center or border of s, if s is visible on screen
∞, otherwise
This definition allows us to capture not just DOIs users viewed in an experiment, but also which DOIs were visible and not visible during the experiment and when. This allows analysts to understand not just what viewers chose to view, but also what they chose to ignore.
Finally, a typical eye-tracking experiment captures DOI sequences for multiple users, as well as data describing those users individually. Since through interaction users can change both the data and how it is displayed, all already introduced definitions should be augmented to reflect that they are user specific. User data (U) includes for each user (ui) background and demographic information (e.g.,
educa-tion background, level of expertise, gender), but also user performance data (e.g., answers to questionnaires). Such user attributes could be time dependent (e.g., self-reported fatigue):
Ut={ui,t|i= 1..Nut, t∈T} ui,t={uai,t,k=uavi,t,k|k= 1..Nuai,t}
Using the definitions introduced above, DOI data can be formallly described as:
DOIt,u={St,u(+linked M, D),
d(Ft,u, St,u), Ft,u, uu,t} |t∈T, u= 1..Nu
insight into cognitive processes associated with top-down perception. User attributes can tie perceptual and cognitive patterns to user demographics, abilities, and performance. Moreover, the model can be extended as necessary with additional types of attributes, such as modality (e.g., audio) or interaction annotations (e.g., is an object the target of an interaction).
6
P
OSSIBLE AND PROBABLEDOI
TASKSResearch on task taxonomies and frameworks converged on the need to describe tasks in terms of users’ goals, operands, and objectives [5], [6], [32], [33], [34], [35]. Several frame-works advocate that task descriptions ought to also specify actions or means (i.e., how a task should be achieved) [34], while a few convolute the notions of objectives and actions in a single descriptor [7]. Since DOI visualizations do not yet exist, and our focus was precisely to motivate the need for DOI analytics and define its requirements, our contribution is limited to defining the space of questions that can be asked of DOI data. In other words, we consider DOI task operands and objectives, but not their means.
Using the methods we formalize below, we were able to generate a broad range of questions that DOI data could facilitate in the context of the experiments described previously. Importantly, many of these questions we had not identified in preliminary discussions with the domain experts involved in these projects, but ultimately found to be relevant. Table 2 illustrates a few representative examples.
6.1 Operands
Most task frameworks recommend considering possible candidates for a task’s inputs and outputs as combinations of the different data facets underlying a domain. For exam-ple, Andrienko et al. identifies three principle data facets in spatio-temporal analyses — spatial (where) , temporal (when), and thematic (what) — then exhaustively consider the ways in which these facets can be combined in search tasks (e.g.,where+what→when,when→where+what). Similar approaches were used in a signficant body of subse-quent research [5], [33].
Given the four data facets discussed in Section 5, and the operands underlying a particular cognitive objective, tasks can be imagined exhaustively using the thinking described above. For example, ”When did student A first look at an example?” is a simple instantiation of awho + what→when
search task in our learning application.
However, given the multiple data facets and the fact that each facet can include several independent attributes, the space of possible tasks is rather large. Moreover, while imagining tasks, grounding them in our concrete applica-tions, and validating them with domain experts, we found that some tasks, while possible, are improbable in practice, a conclusion which echoes those of Andrienko et al. [6] and Roth [5]. As such, in Section 6.2 we consider data operands in conjunction with data objectives to lay out a set of probable data questions.
Elementary vs. Synoptic Tasks: Most task frameworks advocate for discriminating between low-level questions targeting single objects, and high-level questions targeting
collections of objects. Andrienko et al. define elementary vs. general tasks, Schulz and Nocke introduce the notion of a task’s cardinality [34], while Rind et al. discuss high- or low-level task compositions [35]. The probable tasks listed in Section 6.2 capture the space of both elementary and general tasks.
Additionally, we encourage practitioners to consider the granularity at which data will be analyzed. For example, time may be analyzed at scales larger than one fixation, such as a few seconds and even minutes, depending on the scale of the experiment. Similarly, analysts may care about groups of subjects (e.g., subjects with the same level or expertise) more than individual subjects, and about cate-gories of data (e.g., definitions, examples, exercises) more than individual data objects. Insight into the granularity at which data should or can be analyzed, can blur the boundary between elementary and general tasks and inform the way a visualization is designed. Moreover, finding the right granule at which to analyze data is often a task in its own right, which visualizations should support. This echoes Aigner et al.’s research on temporal visual analytics [46].
Specifying attribute values: It is intuitive that defining the scope of a task can be done by specifying attribute values or ranges in absolute terms (e.g., user.experience>
5 years). It is also possible to use labels that translate to absolute values [46]. For example, ”the first minute of task two”, defines a time-span under the assumption that task tworesolves to a concrete time.
A more interesting option is to tie an attribute to the value of that attribute in a selection specified through other means. Consider the question ”What types of objects do subjects view after looking at definitions?”. This task defines a set of moments in time as a function of when definitions were viewed. One may argue that this task involves two elementary operations: determine when definitions were viewed; and determine what was viewed immediately after. However, that is not necessarily true: AOI transition matri-ces answer such questions without requiring any temporal search. Similar tasks can be imagined along attributes other than time: ”How often do subjects view data that is similar to what they viewed before?”, ”Which subjects don’t view data that experienced subjects focused on?”.
6.2 Objectives and probable data questions
Visual Analytics Learning Education Construction DOI (at fixationN) DOI (at fixationN) DOI (at fixationN)
data attributes
type : movie
label : The Dark Knight rating:9.0
visual attributes
visible : yes pos :550,300(px) size :200,150(px)
user attributes
id : user1 level : graduate
background : computer science
perceptual attributes
fix pos :450,280(px) fix spread :30,25(px) distance :20(px) time :720,000(ms) duration :300(ms)
data attributes
type : definition format : text concept : structure level : intro
visual attributes
visible : yes pos :120,300(px) size :300,100(px)
user attributes
id : user1 level : senior background : arts accuracy : 85 (%)
perceptual attributes
fix pos :130,280(px) fix spread :30,25(px) distance :20(px) time :51,000(ms) duration :280(ms)
data attributes
type : worker helmet : yes size :0.7,0.4,1.8(m) moving :1.5(m/s) hazard : caught in between
visual attributes
visible : yes pos :560,430(px) size :20,40(px) color :(100,150,150)
appearance : image ref
user attributes
id : user1
experience :5(years) background : construction accuracy :7(hazards spotted)
perceptual attributes
[image:9.612.123.491.39.278.2]fix pos :130,280(px) fix spread :30,25(px) distance :20(px) time :51,000(ms) duration :280(ms) TABLE 1
Example DOIs and attributes collected in each of the three applications described in Section 4.
Identify allows an analyst to extract a data characteristic from a given data target. After considering possible tasks and how they support high-level research goals in our three concrete applications, we distilled the probable types of questions listed below. These essentially boil down to identifying what data a group of subjects viewed and how (e.g., time, gaze properties), which subjects viewed certain data at certain time, and what subjects’ characteristics are. They also account for the fact that analysts may wish to focus their data questions on specific users or groups of users (e.g., students with an engineering background), an experiment’s entire duration or just a temporal subset (e.g., second task, the first minute of each task), and on specific subsets of data (e.g., definitions, fast moving machinery).
I1: During all or part of the experiment, one ore more subjects looked at data or a specific subset of data — (i) with what data or visual attributes; (ii) and/or when, how long; (iii) and/or how often; (iv) and/or in what way?
I2: During all or part of the experiment, what are the attributes of subjects that viewed a specific subset of data — (i) in a particular way; (ii) and/or at a particular time; (iii) and/or particularly often?
I3: During all or part of the experiment, what are the attributes of one or more given subjects?
Compare captures the objective of determining the differ-ences or similarities between two data targets. It is possible for two compared targets to have the same form but a different level of generality: ”Did user A look at different things than everyone else in task one?”. We identified the following probable compare objectives:
C1: Compare individual or groups of subjects, based on all or a subset of data they saw or accessed, during all or a part of the experiment, by — (i) the data or visual attributes of that data; (ii) and/or when, how long, or how often they looked at it or it
was visible; (iii) and/or how they looked at it.
C2: Compare time subsets, based on all or a subset of the data viewed or accessed by one or a group of subjects in those times, by — (i) the data or visual attributes of that data; (ii) or when, how long, or how often the data was viewed or it was visible; (iii) or how the data was viewed; (iv) or the attributes of the users that viewed or accessed it.
C3: Compare subsets of data, viewed or accessed by one or a group of subjects, during all or part of the experiment, by — (i) its data or visual attributes; (ii) or when, how long, how often it was viewed; (iii) or how it was viewed; (iv) or the attributes of the users that viewed or accessed it.
C4: Compare individual or groups of subjects based on their properties, during all or part of the experiment.
Rank allows analysts to determine the order of multiple objects. The space of probable ranking questions is similar to that of comparison questions, only involving more than two operands. It is important to note that ranking operations, by Roth’s definition, will include questions pertaining to the identification of extremums, outliers, and means and centroids. A few examples of concrete ranking tasks are shown in Table 2.
Associate allows analysts to capture the relationship be-tween different attributes, and is synonymous with the correlate objective in other taxonomies. To describe asso-ciate tasks we need to consider the two characteristics to compare, and the data subset that they are sought in. As Andrienko et al. point out [6], and we observed in practice, it is rare that association task would be performed across different targets. As such, we identified the following prob-able associate objectives:
how long, or how often; (iii) how — data or subsets of data those subjects viewed or accessed during all or part of the experiment?
A2: Are there correlations between when, how long, or how often data or subsets of data that one or more subjects viewed or accessed during all or part of the experiment and — (i) data or visual properties of that data; (ii) how that data was viewed?
A3: Ar there correlations between attributes of all or a subset of data and how that data was viewed by one or more subjects during all of part of the experiment?
A4: Are there correlations between the attributes of all or a group of subjects, during all or part of the experiment?
A5: Are there correlations between the attributes of data or subsets of data viewed or accessed by one or more subjects during all or part of the experiment?
A6: Are there correlations between when and how long or how often data or subsets of data were viewed or accessed, by one or more subjects, during all or part of the experiment?
We note that the phrasing ’are there correlations’, which denotes a confirmatory goal, can be changed to ’find corre-lations’, which denotes a more general, exploratory goal.
Delineate tasks capture analysts’ objective of organizing data in logical structures, such as clusters or groups. De-lineate tasks operate on the same operands as compare and rank tasks.
6.3 Enabling tasks
Roth found that in addition to tasks supporting goal ori-ented questions about data, users also identified enabling tasks that center around preparing, cleaning-up, and anno-tating data or visualizations [5]. Roth identifies importing, exporting, saving, editing, and annotating as instances of en-abling tasks. Simmilar ideas can be found in Brehmer and Munzner’s work [33].
It is difficult to conjecture about the full space of en-abling tasks for DOI data analysis in the absence of mature design studies. However, we list three examples which we identified in our preliminary work. First, determining the temporal and data granularity at which data should be ana-lyzed is of particular importance given the large volumes of data that can be collected during DOI experiments.
Second, analysts should have the ability to annotate sub-ject’s time-lines, to mark particular moments in time when something meaningful happened during the experiment, or when something was observed in the data. At the same time, analysts should be able to annotate collected DOIs with attributes and values additional to the ones recorded during the experiment.
Third, a special type of data cleaning or editing is partic-ular to the DOI domain. Subjects often fixate near multiple objects. Often this is done intentionally, so as to perceive and identify multiple objects at once [52]. However, sometimes this is simply the result of scene clutter: multiple objects happen to be around the subject’s focus of interest. In some instances, human analysts or coders can correlate DOI data with the visual context in which that data was collected, and remove DOI objects that are marked incorrectly as potentially viewed. For example, when a subject tracks a
moving object through a 3D scene, their continuing focus on that object will be correctly detected, but additional objects that happen to project near the tracked object will also register. Such a scenario could be identified manually and edited.
7
A
COMPARISON BETWEENAOI
S ANDDOI
SWhile DOIs can been regarded as a mere extension of AOIs, there are significant differences that warrant their separate consideration, and highlight the benefits of a change in methodological paradigm.
Data collection : AOIs exist in stimulus or image space, and need to be defined for each visual frame subjects see. AOI analyses can be used for any type of visual stimulus and drawing AOIs requires little expertise, given the right annotation software.
DOIs are defined over a visualization’s underlying data by instrumenting code. Once a visualization instrumented, DOI data can be collected without added effort for any dataset the visualization can show. Since DOIs are defined over data, their collection is immune to a subject’s inter-actions with a system and specific views they create. This means that data can be captured easily from interactive systems over long times [2]. However, the code of the visualization needs to be open and expertise is required to instrument it.
Data scale and granularity : AOIs tend to be large and sparse (e.g., an entire interface panel), and analyses often involve few AOIs. Moreover, AOI analyses tend to be lim-ited to static stimuli or short videos since defining AOIs is costly. Conversely, DOIs can be granular and many (e.g., individual data objects), and collected over long periods of time. As such, DOI analyses can involve hundreds of DOIs and thousands of focus switches between them. For example, in our first application area subjects viewed on average75individual data objects per task.
Experiment scale and ecological validity: AOI analyses often explore key-hole, constrained scenarios. Data is gen-erally captured for time scales of up to a few minutes, and only a handful of coarsely defined AOIs are tracked. Instead, DOI analyses can be used to track the behavior of many users, using interactive visual content (e.g., real-life visual analytics systems), over extended periods of time. The DOI methodology thus enables a type of in-vivo experimentation not previously explored.
Data driven analyses: AOIs have been mostly analyzed and interpreted in direct connection with the visual stimuli they were defined on. They have meaning that is known to those who create and use them, but which is rarely defined explicitly as attributes that can be visualized or mined computationally in an analysis.
Task Type Task Instance
I(i) What was the type distribution of advanced architecture concepts that subjects looked at? I1(ii) Cumulatively, how much time did subject X spend looking at moving objects?
I1(iv) On average, how close were experienced users fixations from the center of the closest object? I2(ii) Which subject looked at definition X in the first minute of the experiment?
I2(iii) What is the average experience of subjects who looked at every object associated with ‘caught in between’ hazards at least twice? I3 How fatigued did subject X report to be at the end of the study?
C1(ii) Do experienced users view hazard-tagged objects faster once they become visible, than do novices? C1(iii) Do experienced users fixate closer to objects than do novices?
C2 (i) When do subjects look at genres more, in the beginnings or at the ends of tasks?
C2 (iii) Do subjects fixate closer to objects in the first minute of a task than in the last minute of it? C3(i) What distinguishes visible data that subjects looked at, from visible data that they ignored? C3(iii) Are examples being viewed more than definitions by experienced users?
C4 Are our experienced users typically older than our novices? R1(i) Which user tends to look at examples first?
R3(ii) What do users look at most in the first few seconds after spotting a new movie: actors, directors, genres, or ratings? R3 (ii) What type of learning object do successful learners look at most?
R2 (ii) During which task did subjects start looking at examples earliest?
R3(ii) Which one object was viewed most by experienced subjects in the third section of the experiment? R4 Which user was the most successful learner?
A1 (i) Is there are correlation between the background of subjects (e.g., science) and the format of learning content they focus on (e.g. numeric)? A2 (ii) Do people fixate further away from objects as time progresses in a task?
A2 (i) Is there are correlation between how near objects are to a subject and how much subjects focus on them? A3 Do subjects tend to fixate closer to objects that appear smaller on the screen?
A4 Is users experience correlated with their ability to identify more hazards?
A5 Is there a correlation between the genres and ratings of movies that subjects viewed? A6 Do effective learners look at examples more as time progresses?
D1 (i + ii) Cluster subjects based on the what content they viewed, and when. D2 (i) Cluster tasks based on how the content viewed in them.
[image:11.612.49.580.37.330.2]D3 (iv) Cluster the objects tracked in the experiment by the attributes of the users who viewed them (e.g., their experience, their performance). D4 Cluster subjects based on their attributes.
TABLE 2 DOI task examples.
they focused on. DOI attributes make it possible to refer to categories of data, rather than to individual DOIs.
Range of research questions: Eye-tracking in general, and the AOI method in particular, have been aimed at exploring low-level perceptual processes. Through its intrinsic con-nection to data, the DOI methodology can support novel questions about the types of data users are interested in, and how they might use this data to reason and hypothesize. Through its scale and semantic annotation, DOI data can support exploratory analyses not common in traditional eye-tracking experimentation.
8
S
UPPORTINGDOI
ANALYSESThe previous sections illustrated the differences between AOI and DOI data and the range of DOI tasks, providing an intuition that existing methods for AOI analysis do not directly extend to DOI data. Broadly speaking, AOI visualizations (e.g., scanpaths, scarfplots, transition matri-ces) cannot handle the scale of DOI data, cannot show or leverage the many attributes that describe DOIs, and cannot support novel tasks and analyses enabled by DOI data.
We detail these limitations and discuss a few potential research paths to address them. This analysis was informed by our attempts to visualize DOI data collected as part of the projects discussed in Section 3. We note however that our discussion is not aimed at being exhaustive and providing complete, validated designs. Instead, our goal is limited to seeding and exemplifying the immediate challenges in providing visual solutions for DOI analysis.
Visualizing many DOIs viewed over long periods of time: As shown in Sections 4 and 5, DOI data can be collected over
long time spans, during which users may view hundreds of distinct DOIs and switch their attention between these DOIs thousands of times.
Existing AOI methods cannot handle such scale. For example, scarfplots [53], and to some extent AOI rivers [54], identify AOIs via distinctive colors, and are thus limited in the number of DOIs they can show by the number of colors that users can distinguish. Alternatively, scan-paths [55] or heatmaps [2] identify DOIs through labels, and could thus encode as many DOIs as necessary. However, by listing DOIs vertically and time horizontally, scanpaths and heatmaps assign visual space to each time× DOI
combination. As shown in Figure 3, such visualizations tend to be unwieldy large and sparse when showing DOI data, an issue that becomes particularly problematic when looking at and comparing the data of multiple users.
Novel visual encodings that show DOI data collected over long periods of time from many users in a compact way are needed. We illustrate one possible solution in Figure 4. The visualization, a trade-off between the compactness of scarfplots and the verboseness of scanpaths, is a proof-of-concept that was laid out manually. Additional work in developing and evaluating such visualizations is needed. Viewing DOI attributes:No current visualization has been designed to show AOI attributes beyond their unique iden-tifiers, but relating DOI attributes to time and user attributes is central to the approaches we described.
Fig. 3. Scanpath of real DOI data of a single user showing 59 DOIs viewed over 10 minutes.
approach fails to reveal broad data patterns at an overview level (e.g. visually reflect how DOIs with similar attributes cluster over time), and does not support the general tasks discussed in Section 6.
Showing DOI attributes can be supported via conven-tional techniques, such as linking DOI attributes to visual channels (e.g., color, shape) or by relying on glyph designs. However, it is important to investigate whether this inte-gration can be done effectively in existing visual encodings, and which encoding is most amenable to it. For example, in scanpaths, attributes could be shown along with the label on one side of the visualization. However, displaying attribute values in a location that is independent of time assumes that DOI attributes are constant over time, which is not necessarily true, and hides potential correlations between when a DOI was viewed and its attributes.
Exploring DOI data at multiple levels of granularity: Sections 4 and 6 showed that the vast majority of DOI tasks are general rather than elementary. Questions target classes of DOIs defined flexibly on their attributes rather than individual DOIs, and time spans that generally go beyond a single fixation. Instead, most current visualizations are geared towards low level analyses, in which analysts track users’ focus in AOIs at each fixation. DOI visualizations should allow analysts to explore DOI data at many levels of detail, including multiple temporal scales (e.g., seconds vs. minutes) and data granularities (e.g., individual vs. categories of DOIs).
Exploring data at multiple time scales relies on the ability of visualizations to aggregate data over times longer than a single fixation (semantic zooming), or to show data in ways that allow different visual patterns to emerge at different viewing levels. Such encodings are difficult to imagine for scanpaths and scarfplots, as they depict direct transitions between objects at each of a user’s fixations. Alternatively, heatmaps [2] and AOI/DOI-rivers [54] can show multiple
DOIs within a single time-granule.
Second, DOIs could be grouped by using attribute queries to define DOI categories, by exploiting DOI hier-archies (i.e., DOIs that are contained by other DOIs), or manually. Aggregating DOIs visually can again be done semantically, by allowing analysts to explicitly collapse mul-tiple DOIs into single ones, or by showing data in a way that allows categories to emerge and separate visually.
Facilitating comparison: Current visual encodings of AOI data are not optimized to facilitate comparison, nor support it via interaction, and the richness and scale of DOI data increases the complexity of comparison tasks. A formal anal-ysis and design study on how existing AOI techniques could integrate Gleicher et al.’s comparison paradigms (i.e., juxta-position, superjuxta-position, and encoding of differences) [56], and how efficient this integration can be, would help sup-port DOIcomparisontasks.
Clusteringcan reveal similarities between viewing behavior associated to users, time-intervals, or particular data. It directly supportsdelineateandcomparisontasks.
AOI sequences of multiple users have previously been clustered using string-edit distances [29]. This gave good results for short, highly constrained perceptual tasks since users are bound to view similar things in a similar order. However, this distance measure may not be robust enough to handle DOI data collected over long, open-ended tasks, since such data is not temporally-aligned and is bound to differ at the key-hole level that string-editing operates. Moreover, while explaining cognitive behavior, the exact order in which data is viewed may be secondary to which data was viewed and for how long.
Instead, comparing users in a space of derived features (e.g., DOIs they viewed most, common DOI transitions or sequences) may be more robust to local differences, and would allow features to be added or removed from a distance measure. This could support associate tasks, by enabling an exploration of which features explain observed behavior.
Supporting novel DOI tasks using interaction and visual analytics methods.We showed that the richness and scale of DOI data allows analysts to pursue more general tasks, higher level analytic objectives (e.g., associate or delineate), and broader research questions. However, this increased complexity calls for interactive visualization and analytics techniques that transcend simple visual encodings of AOI data.
Kurzhals et al. and Blascheck et al. recently pursued a visual analytics approach to the analysis of AOI data [29], [30]. Their systems support behavioral clustering and pat-tern searches, thus drawing closer to the systems that would be needed to support the questions described in Section 6. Such work needs to be extended to consider the scale of DOI data, and the range of novel objectives that build on the existence of DOI attributes. Changing the granularity of shown data, reconfiguring and reordering data subsets to reveal correlations and support comparison, and the ability to explore different data perspectives using multiple coordinated views, are possible design solutions that need to be explored and validated.
Fig. 4. Re-imagined scarfplot for movie DOI data, captured for one user. DOIs are labeled explicitly along time, which is shown horizontally. They are scaled according to how much they were viewed around particular time-points, and project along the time-line to indicate precisely when and for how long they were viewed. A selection of one DOI (Goodfellas) is highlighted throughout the data.
described in this paper provided significant insight into the types of DOI data we can expect to collect and the research questions and goals this data can support. Ad-ditional interdisciplinary effort is necessary to refine and augment our DOI data model and tasks, as well as provide the feedback necessary to develop and evaluate appropriate analytic techniques for the analysis of DOI data.
9
L
IMITATIONS OF THEDOI
APPROACHThe DOI approach relies on abstraction. While necessary to enable data intensive, exploratory eye-tracking analyses at broad time scales, such abstraction can hide low-level de-tails of perception (e.g., bottom-up visual scanning effects). Practitioners should consider such details as well limitations of eye-tracking technology as these impact the accuracy that can be assumed of DOI data, the types of questions that it can and cannot answer, and the designs of eye-tracking experiments. We describe a few common limitations below and point readers to refer to further research and surveys for more detail [12], [15], [16], [17].
First, eye-trackers are inherently inaccurate. They re-quire calibration and such calibration often degrades over time. Moreover, they often report gaze coordinates that are slightly offset from users’ actual gaze.
Second, people occasionally fixate on or near visual objects without mentally registering them. Most often this happens when people stare blankly, possibly because they are thinking about something else. Another reason might be that when users perform high-level, holistic visual tasks they aim to perceive broad visual regions rather than spe-cific objects. In such cases, a granular fixated object might not be representative of a user’s entire data target.
Conversely, people actively use their peripheral vision to optimize pupil movement and may register very salient or familiar objects even if fixating relatively far away from them. For example, it is known that expert users tend to use their peripheral vision more and fixate farther from objects. This makes it difficult to come up with a uniform gaze-to-object distance that can capture with certainty whether an object has been viewed or not.
Finally, some perceptual behaviors are subtle and of short duration or spatial amplitude (e.g., microsaccades, fixational eye-movements, quick involuntary saccades as-sociated with bottom-up visual scanning). Moreover, they may be washed out by longer, intentional eye-movements. Such behaviors can only be captured using high-grade
eye-trackers, and experiments intended to study them should be designed carefully.
A limitation more specific to the DOI approach relates to the types of visual primitives and visualization tasks that can be captured accurately. We hypothesize that the approach is most suited to point- or blob-like visual prim-itives (e.g., nodes, labels, or tight clusters), and less suited for visual primitives that span the screen (e.g., a curve in a parallel coordinate plot; a geographical area). Moreover, the accuracy of viewed object detection degrades with in-creased visualization clutter. In dense visualizations the DOI methodology will likely yield data to noisy to be useful.
similarly, we hypothesize that the DOI approach can best capture elementary identify tasks in which users focus on specific objects to register their presence and find out more about them, and less suited for holistic visualization tasks (e.g., identify broad visual patterns in the data).
10
C
ONCLUSIONSDOIs are subsets of data that a visual interface shows to a user. They are defined on the data model underlying a visualization, by instrumenting the code that translates concrete data into visual representations. Once a visual interface instrumented, user gaze coordinates provided by an eye-tracker can be mapped to DOIs via their visual repre-sentations automatically and effortlessly, regardless of users’ individual interactions with the interface. As such, the DOI approach can capture users’ data interests from interactive visualizations over long periods of time. Moreover, DOIs are characterized by a rich set of attributes derived from the data that the DOIs are defined on, and from the visual context in which they are displayed. These attributes allow analysts to pose a broad range of questions that relate the type of viewed data to user behavior and characteristics. While DOIs can be regarded as a mere extension of AOIs, there are significant differences in DOI data properties and how it is collected, the research goals it can support, and the data questions it facilitates. Moreover, current visualization techniques do not support DOI-specific analyses. These dif-ferences, detailed throughout the paper, justify the different nomenclature and motivate the research.
![Fig. 1. One page of an interactive, HTML environment for learning archi-tecture concepts instrumented using Sayeed and Jianu’s approach [2].Overlays illustrate defined DOIs.](https://thumb-us.123doks.com/thumbv2/123dok_us/1412956.94160/5.612.314.564.372.527/interactive-environment-learning-concepts-instrumented-overlays-illustrate-dened.webp)
![Fig. 2. A 3D construction scene model (top) instrumented using Bern-hard et al.’s color-buffer (bottom) approach [4]](https://thumb-us.123doks.com/thumbv2/123dok_us/1412956.94160/6.612.313.566.159.346/construction-scene-model-instrumented-using-bern-buffer-approach.webp)