Explorative Coastal Oceanographic Visual Analytics:
Oceans of Data
Author: Richard Llwyd Simon Frost George
School of Computer Science, Bangor University
August, 2013
ii
Acknowledgements
I would like to thank the many people who have supported me throughout the past four years. At times it has been challenging, and their help has been greatly appreciated in enabling to reach this point.
Firstly, my supervisor, Dr Jonathan Roberts has been an invaluable source of advice, guidance and encouragement throughout my studies, particularly when I began to doubt I would ever finish, and has challenged me to extend my knowl-edge and understanding into areas of visualization I had never anticipated pursuing. Thanks to him, I now understand more about statistical analysis than I ever thought would be possible (and I am sure my ‘A’ level Maths teacher would appreciate that). I would also like to thank Professor Alan G Davies and Dr Peter Robins of the Centre for Applied Marine Studies at Bangor University, for providing the datasets for my project; for being willing guinea pigs for my theories of how to improve on the analytical capabilities of their models and for providing me with a challenging ‘real life’ problem: I hope my proposed solution will reduce some of their calculat-ing drudgery.
Finally, I would not have arrived at the completion of this research without fam-ily and friends - thanks James, Lukas, Matt, Steve and Tom for putting up with me being grumpy :). My father, a few years ago, acquired for me extremely old oceanographic text book, and as I flicked over the pages, my eye was caught by what seemed to be some very early examples of visual analytics. So, in conjunction with my supervisor, I have him to thank for some of the inspiration for this project. My partner, Sophie, has been extremely supportive, despite working to complete her own studies, and I thank her for not abandoning me to a life chained to a com-puter. I would like to say a massive thank you to my mother, for proof reading my dyslexic sprawl. She has always been a shining star in my life and I have her to thank for always encouraging me.
Thank you all Richard
iii
Statement of originality & release
Statement of Originality
The work presented in this dissertation is entirely from the studies of the individual student, except where otherwise stated. Where derivations are presented and the origin of the work is either wholly or in part from other sources, then full reference is given to the original author. This work has not been presented previously for any degree, nor is it at present under consideration by any other degree awarding body.
Student: ...
Statement of Availability
I hereby acknowledge the availability of any part of this dissertation for viewing, photocopying or incorporation into future studies, providing that full reference is given to the origins of any information contained herein. Student:
...
Company Representative (if applicable) ...
iv
Abstract
The widely acknowledged challenge to data analysis and understanding, result-ing from the exponential increase in volumes of data generated by increasresult-ingly complex modelling and sampling systems, is a problem experienced by many re-searchers, including ocean scientists. The thesis explores a visualization and visual analytics solution for predictive studies of coastal shelf and estuarine modelled, hydrodynamics undertaken to understand sea level rise, as a contribution to wider climate change studies, and to underpin coastal zone planning, flood prevention and extreme event management.
But these studies are complex and require numerous simulations of estuarine hydrodynamics, generating extremely large datasets of multi-field data. This type of data is acknowledged as difficult to visualize and analyse, as its numerous at-tributes present significant computational challenges, and ideally require a wide range of approaches to provide the necessary insight. These challenges are not eas-ily overcome with the current visualization and analysis methodologies employed by coastal shelf hydrodynamic researchers, who use several software systems to generate graphs, each taking considerable time to operate, thus it is difficult to ex-plore different scenarios and exex-plore the data interactively and visually.
The thesis, therefore, develops novel visualization and visual analytics tech-niques to help researchers overcome the limitations of existing methods (for exam-ple in understanding key tidal components); analyse data in a timely manner and explore different scenarios. There were a number of challenges to this: the size of the data, resulting in lengthy computing time, also many data values becoming plotted on one pixel (overplotting).
The thesis presents: (1) a new visualization framework (VINCA) using caching and hierarchical aggregation techniques to make the data more interactive, plus ex-plorative, coordinated multiple views, to enable the scientists to explore the data. (2) A novel estuarine transect profiler and flux tool, which provides instantaneous flux calculations across an estuary. Measures of flux are of great significance in oceano-graphic studies, yet are notoriously difficult and time consuming to calculate with the commonly used tools. This derived data is added back into the database for fur-ther investigation and analysis. (3) New views, including a novel, dynamic, spatially aggregated Parallel Coordinate Plots (Sa-PCP), are developed to provide different perspectives of the spatial, time dependent data, also methodologies for
develop-v ing high-quality (journal ready) output from the visualization tool. Finally, (4) the dissertation explored the use of hierarchical data-structures and caching techniques to enable fast analysis on a desktop computer and to overcome the overplotting challenge for this data.
Contents
1 Introduction 1
1.1 The Grand Scientific Challenges . . . 5
1.2 Role of Sci Vis . . . 7
1.2.1 Visual Analytics . . . 8
1.3 The Oceanographic Domain . . . 9
1.3.1 Overview . . . 9
1.3.2 Coastal shelf studies and modelling . . . 10
1.3.3 Visualization and visual analytics challenges . . . 11
1.4 Collaboration with OS . . . 12
1.5 Hypothesis . . . 12
1.6 Contributions of the thesis . . . 14
1.6.1 Publications . . . 17
1.7 Structure . . . 18
2 The Data 21 2.1 The Coastal Domain . . . 21
2.2 The Estuarine Case Studies . . . 24
2.3 Data Sampling or Simulation . . . 27
2.4 Numerical Models and Current Visualization Approaches . . . 29
2.5 TELEMAC–2D . . . 31
2.6 Graphical interfaces for TELEMAC . . . 33
2.7 The case study – Vis challenges . . . 34
2.7.1 An important hydrodynamic component - Tidal Flux . . . . 37
2.8 Summary . . . 38
3 OS Visualization 39 3.1 Review of vis tools . . . 40
3.2 OS Vis Systems . . . 43
CONTENTS vii
3.4 Coastal shelf visualization . . . 45
3.5 Visualization for EDSS . . . 47
3.6 Ocean Observatories . . . 50
3.7 Workflow, including data management, system design and architecture 51 3.7.1 Recent developments . . . 52
3.7.2 Workflow systems . . . 53
3.7.3 Workflow systems in ocean sciences . . . 54
3.8 Summary . . . 55
4 Related Work 57 4.1 In Collaboration OS with CS. . . 58
4.1.1 Understanding the Coastal Shelf Researcher . . . 60
4.2 Oceanographic Visualization . . . 64
4.2.1 Scope of the Oceanographic Related Work . . . 65
4.2.2 Multi-field oceanographic data & the challenges they present to visualization . . . 66
4.2.3 The value of visualization and visual analytics for ocean sci-ence data . . . 71
4.3 Large data management . . . 77
4.3.1 Overview of data management methodologies . . . 77
4.3.2 Defining the problem and identifying solutions . . . 80
4.3.3 Spatial Indexing . . . 82
4.4 Interaction & Interfaces . . . 90
4.4.1 Query Driven Visualization . . . 91
4.4.2 Interaction . . . 93
4.4.3 Current approaches to interfaces and interaction in ocean sciences . . . 94
4.5 Coordinated Multiple Views . . . 96
4.5.1 The value of Coordinated Multiple Views (CMV) for multi-field data . . . 99
4.5.2 Views . . . 99
4.5.3 Use of Coordinated Multiple Views in ocean sciences and the wider geosciences . . . 102
4.6 Visual Analytic Tools . . . 106
4.6.1 Parallel Coordinate Plot . . . 107
CONTENTS viii
4.6.3 Bespoke problem solving tools . . . 110
4.6.4 Resolving spatial clutter for PCP and similar clustering tech-niques . . . 113
4.6.5 Axis/dimension reordering . . . 119
4.6.6 Data analysis tools in the geosciences . . . 120
4.7 Towards requirements of an investigative coastal data visual analyt-ics system . . . 122
4.7.1 Context . . . 122
4.7.2 Requirements . . . 124
4.8 Summary . . . 125
5 VINCA 129 5.1 Establishing system requirements . . . 130
5.1.1 Identified Challenges . . . 132
5.1.2 Summary of requirements . . . 136
5.2 Design and Initial Implementation . . . 136
5.2.1 Selection of programming tool . . . 137
5.2.2 Early concept and design work . . . 138
5.3 Data Import . . . 139
5.3.1 Stage 1 – Data-Import . . . 140
5.3.2 Stage 2 – Database loading . . . 142
5.4 Spatial indexing . . . 143
5.4.1 Selection of spatial indexing . . . 144
5.4.2 Development and testing of PR quadtree and k-d tree ap-proaches . . . 146
5.4.3 Uses of PR quadtree algorithm . . . 149
5.5 Interaction and Interfaces . . . 149
5.5.1 GUI Elements . . . 150
5.5.2 Data Selection within the views . . . 151
5.6 Coordinated Multiple Views – CMV . . . 152
5.6.1 Developing the windows for CMV . . . 153
5.6.2 Development of CMV management tool: Hierarchical CMV Manager. . . 154
5.7 Views . . . 156
5.7.1 (Object Abstraction) Abstract View Class . . . 158
CONTENTS ix
5.7.3 Context Views . . . 161
5.7.4 Overlays . . . 163
5.7.5 Attribute plots and graphs . . . 165
5.7.6 PCP Query View . . . 168
5.7.7 Transect/Flux View . . . 170
5.8 Improving System Performance . . . 170
5.8.1 Caching . . . 170
5.8.2 QuickDraw . . . 171
5.8.3 Export of publishable quality outputs. . . 172
5.9 Summary . . . 172
6 PCP Query 174 6.1 PCPs & hydrodynamic research . . . 175
6.2 PCP Architecture . . . 176
6.2.1 Processes common to the PCP variants: . . . 177
6.3 Raw Data PCP . . . 180
6.3.1 Visualizing the Raw Data PCP . . . 181
6.3.2 Query Results . . . 182
6.4 Frequency PCP . . . 182
6.4.1 Frequency PCP . . . 183
6.4.2 Development of a variant frequency PCP . . . 183
6.4.3 Spatially Indexed Binning . . . 184
6.4.4 Evaluation of the variant frequency PCP . . . 184
6.5 Sa-PCP (Spatially aggregated PCP) . . . 185
6.5.1 Utilising Spatial Indexing to pre-process the data . . . 186
6.5.2 Construction of the Sa-PCP . . . 187
6.5.3 Visualizing the Sa-PCP from the range data . . . 188
6.5.4 Display Ranges . . . 188
6.5.5 Display using Envelopes . . . 189
6.5.6 Transfer Functions . . . 190
6.5.7 Associated Heat Map . . . 190
6.6 Evaluation of the techniques . . . 190
6.7 Summary . . . 191
7 Deriving New Data 195 7.1 Transects . . . 196
CONTENTS x
7.2 Flux . . . 196
7.2.1 Definition . . . 198
7.2.2 How it is currently calculated . . . 199
7.2.3 Flux in other work . . . 200
7.3 Developing the tool . . . 200
7.3.1 Transect Profiler . . . 201
7.3.2 Flux Calculator . . . 203
7.4 Flux along an estuary . . . 205
7.5 Transect and Flux Vis . . . 209
7.5.1 Scaling Challenge . . . 211 7.5.2 Positioning Challenge . . . 211 7.6 Evaluation of Techniques . . . 212 7.7 Summary . . . 213 8 Conclusions 215 8.1 User Survey . . . 215
8.1.1 User Survey Results . . . 216
8.1.2 Discussion of the Results . . . 218
8.2 Review of the Hypotheses . . . 219
8.3 Summary of achievements . . . 220
8.3.1 Achievement 1: Development and implementation of a coastal oceanographic Visual Analytics framework . . . 221
8.3.2 Achievement 2: production of derived data supporting more effective data analysis . . . 224
8.3.3 Achievement 3: Implementation of a visual analytics sys-tem based on multiple views . . . 225
8.3.4 Achievement 4: Data Structures . . . 226
8.4 Future Work . . . 228
8.4.1 Future Work – Short Term . . . 229
8.4.2 Future Work – Medium Term . . . 230
8.4.3 Future Work – Long Term . . . 231
8.5 Conclusions . . . 233
Bibliography 234
List of Figures
1.1 Direct reproduction from Maury [196] “Plate VI.illustrates the
po-sition of the channel of the Gulf Stream for summer and winter. The diagram A shows a thermometrical profile presented by cross-sections of the Gulf Stream, according to observations made by the
hydrographical parties of the United States Coast Survey.” . . . 2
1.2 Direct reproduction from Maury [196] “Plate XII.exhibiting a
ver-tical section of the Atlantic, and showing the contrasts of its bottom with the sea-level in a line from Mexico across Yucatan, Cuba, San
Domingo, and the Cape de Verds, to the Coast of Africa.” . . . 3
1.3 Direct reproduction from Maury [196] “Plate V.is a section taken
from one of the manuscript charts at the Observatory. It illustrates the method adopted there for co-ordinating for the Pilot Charts the winds as reported in the abstract logs. For this purpose the ocean is divided into convenient sections, usually five degrees of latitude by five degrees of longitude. These parallelograms are then subdivided into a system of engraved squares, the months of the year being the ordinates, and the point of the compass being the abscissae. As the wind is reported by a vessel that passes through any part of the parallelogram, so it is assumed to have been at that time all over the parallelogram. From such investigation as this the Pilot Charts are
constructed.” . . . 4
2.1 Oceanographic domain showing the area of interest – coastal shelf and estuaries. . . 22 2.2 Relationship between tidal flow and sediment transport. Direct copy
LIST OF FIGURES xii
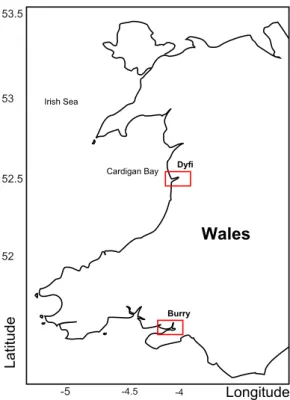
2.3 Figure showing the location of Dyfi Estuary and Burry Inlet. These are the test sites for datasets that are used in this dissertation. The data is simulated using TELEMAC-2D, with real-world data (sam-pled from these two locations) to become the boundary conditions for the simulations . . . 25 2.4 The Dyfi estuary. The diagram shows the bathymetry from a model
simulation by Telemac and visualized with VINCA. Several fea-tures are annotated on the picture, including the embankment, salt marsh, channel and railway embankment. . . 26 2.5 The Figure depicts the bathymetry of the Burry Inlet, with the bathymetry
shown in colour. Various features can be seen, from the Railway line and Port in the North, to the Tidal flats and Salt Marshes in the South position. . . 27 2.6 TELEMAC-2D grid for the Dyfi Estuary, showing difference in
res-olution for area of greater interest. The offshore resres-olution is 500m, gradually reducing to 50m in the estuary and 25m in the river chan-nels. Direct copy from Robins [243]. . . 32
2.7 Screenshots from Blue KenueT M that depict several visualizations
that are typical from the use of this software. . . 34 2.8 Table of variables loaded into VINCA . . . 35 2.9 Burry Estuary visualization (generated by VINCA) showing scale
and complexity of simulated data of the hydrodynamic flow. Eight time-steps are shown. The timesteps are four hours apart, cover the M2-S2 tidal cycle and the colours represent the magnitude of the hydrodynamic flow. . . 36 3.1 copied from Stein et al. [277]: multivariate data visualization of
salinity, isosurface of dissolved oxygen and flow vectors. . . 46 3.2 Copied from Zhang et al. [326], multiple level of detail visualization
of tsunami simulation, placed into global context. . . 49 4.1 Snapshot of Macquarie Ridge region, undersea canyon between
Tas-mania and Victoria Australia, produced for display not for data anal-ysis. The VRML model and visualization allowed scientists to dis-play the connectivity and continuation of various features to support jurisdiction negotiations. Reproduced from Watford et al. [312] . . . 59
LIST OF FIGURES xiii
4.2 Reproduced from He and Hamblin [121]: multislice plot of mod-elled currents (vectors) and temperatures (colour contours) at 08:54h, 24 July 1996 with illumination . . . 62 4.3 Copied from Trouw et al. [291] : Vertical suspended sediment
con-centration. field during wave cycle (asymmetric wave) . . . 62 4.4 Data representation (using model post-processor and analysis
soft-ware) reproduced from Paradis et al. [218], of a TELEMAC-2D storm surge model for the Gironde Estuary. . . 63 4.5 Representation of comparisons of glacial inundation simulations,
showing the difficulty of undertaking a detailed comparison of the outcomes, and understanding the variances, without advanced ana-lytics. Reproduced from Alho and Aaltonen [4] . . . 64 4.6 copied from [13] showing the difference between linear and cyclical
spiral representation of cyclical data, to illustrate a weekly pattern. . 74 4.7 Howe’s solution to the challenges presented by the unstructured
grids of finite element models. The gridfield algebra is implemented as modules, grouped by kind and visualized using VTK. Copied from [136]. . . 84 4.8 Representation of a quadtree, copied from Popenet et al. [228],
show-ing, on the left hand side, a geometrical description, and on the right hand side a logical description, with numbers indicating the level of the corresponding cell. . . 87 4.9 Direct copy from Samet [248] showing a PR quadtree and its records. 88 4.10 k-d tree partitioning, direct copy from Sinha et al [269]. . . 89 4.11 Reproduced from Blower et al. [40]: GUI for selecting model output
from a consortium member, annotated by selection region. . . 97 4.12 copied from Doleisch et al. [76]: Coordinated Multiple View of
diesel exhaust emissions . . . 98 4.13 Reproduced from Blass et al. [38]: CMV main user interface of
application to study meteorological data. The top part of the screen contains spatial viewing components (two slice viewers and a 3D isosurface view). The parallel coordinate plot is positioned in the middle, and the control interface is positioned at the bottom. . . 100 4.14 Reproduced from Ware et al. [311]. CMV with focus+context: 3D
visualization showing the path of data sampling to acquire high res-olution data in relation to bathymetry . . . 104
LIST OF FIGURES xiv
4.15 Reproduced from Ho et al. [135]: linked coordinate multiple view interface for 4D oceanographic data visual analytics, comprising 3D context view for providing an overview, together with 2D image focus and attribute views. The isosurface embedded in the 3D view
represents water temperature changes in relation to depth. . . 105
4.16 Reproduced from Stein et al. [277]: visualization of transport flux data in the Chesapeake Bay. . . 112
4.17 Reproduced from Howe et al. [136]: salt flux visualization in the Columbia Estuary . . . 113
4.18 Reproduced from [274]: Dynamic axis scaling: (a) before, (b) af-ter. Moving the mouse wheel in the focus area of the axis moves the values of the upper and lower limits closer together, facilitating zooming into the central axis. . . 116
4.19 Copied from [230]. This shows PCP with S-shaped axis derived from polar graph, to encode wind direction. . . 120
4.20 copied from Kehrer et al. [161]: a) scatterplot showing the percent-age of total outliers (x axis), and measure to determine how outliers are distributed (y axis) . . . 121
5.1 Prototype 1(P1) . . . 131
5.2 Prototype 2 (P2) . . . 131
5.3 Dyfi estuary data, showing data association problem . . . 132
5.4 shows the model mesh for the Dyfi Estuary and river channel – rang-ing from resolution of 500m offshore , reducrang-ing to 50m in the estu-ary and 25m in the river channel, reproduced from Robins [243] . . 133
5.5 prototype 3D VTK visualization of Dyfi Estuary TELEMAC-2D data with water level at full opacity, showing problem of coincident topology . . . 133
5.6 Reproduced from Robins [243]. Static plots of velocity vectors gen-erated using Blue Kenue. . . 135
5.7 comparative screen shots of ebb and peak flow velocity, generated using Blue Kenue, reproduced from Robins [243] . . . 135
5.8 Reproduced from Silva and Freire’s [265]; schematic of visual ana-lytics and visualization pipeline, illustrates the basis upon which the pipeline for this system has been developed. . . 138
LIST OF FIGURES xv
5.9 The schematic demonstrates the processes involved in the Data
Im-porter Pipeline . . . 141
5.10 Data Loading Pipeline . . . 143
5.11 TELEMAC-2D finite element mesh for the Burry Inlet, reproduced from Robins [242] The resolution in the river channels (the dark-est areas) is 25m, increasing to 50m in the outer dark-estuary and 100m offshore. . . 144
5.12 PR Quadtree applied to Dyfi Estuary TELEMAC-2D dataset . . . . 147
5.13 Build times in milli secs for PR Quadtree and k-d trees with 26693 and 51183 points.. . . 148
5.14 Number of leaf nodes for PR quadtree and k-d trees with 26693 and 51183 points. . . 148
5.15 Distribution of leaf node aspect ratios for k-d trees with 26693 points and 51182 points: the dark band, which denotes aspect ratios pro-viding regular shaped nodes, encompasses fewer nodes in the larger dataset. . . 148
5.16 PR Quadtree (right) and k-d tree (left) for26693points. . . 149
5.17 Reproduced from Pike et al. [226], schematic illustrating the user goals and tasks facilitated by interactive visual analytics. . . 150
5.18 Simple List visualization of points contained within leaf node of spatial data structure. . . 151
5.19 zoomed in view of PR Quadtree cell, showing properties of the cell. 153 5.20 Model-View-Controller type window manager used for VINCA. . . 154
5.21 Example of simple list management tool. . . 155
5.22 Outline of the Hierarchical CMV Manger. . . 156
5.23 VINCA . . . 157
5.24 Table of views within VINCA. . . 157
5.25 Schematic of a generic View . . . 158
5.26 Colour Mapper in Simple Mode . . . 160
5.27 Colour Mapper in CM mode. . . 160
5.28 Main view showing the bathymetry of the Burry data set . . . 162
5.29 Dual view to allow side by side comparisons, the partition on the left depicts the bathymetry, the partition on the right depicts the speed of flow. . . 162
5.30 Example of the spatially indexed heat map overlay used within the system. . . 163
LIST OF FIGURES xvi
5.31 Output from the dynamic vector filter using the quadtree. View a shows no filtering, then progressing through b and c to heavy
filter-ing at view d. . . 164
5.32 Point Graph View, with the 1D partition on the left, the temporal vector partition in the middle and the vector rose plot on the right. . 166
5.33 Output from VINCA showing the tidal harmonics with normalised scaling. The blue line is the water elevation and the red is the speed of flow. . . 166
5.34 demonstrates the selection method used in the polar partitions . . . . 167
6.1 Flow chart diagram of PCP architecture . . . 176
6.2 a point on the mesh, related to its PR quadtree polyline . . . 180
6.3 Picture illustrating the RAW PCP still blown out even though each polyline has only a transparency value of 1 (out of 255). . . 181
6.4 Because of the multi-resolution grid, it is unsuitable to utilize a fixed bin to create a frequency-bin of the data. Although the visual depic-tion of the parallel coordinate plot looks appropriate (as depicted left); when the data is plotted to an associated heat-map the sam-pling problems are clearly shown (right). . . 183
6.5 Spatially indexing binning . . . 184
6.6 Spatial Bin to Regular bin . . . 184
6.7 Visualization of the frequency PCP variant using the quadtree to provide binning for the spatial dimension (the two leftmost in the figure) . . . 185
6.8 outlines the flow and generation of the Sa-PCP . . . 186
6.9 This figure represents a very high level of aggregation. . . 187
6.10 This figure represents a very low level of aggregation. . . 187
6.11 This shows the envelopes using the full range of data contained at each node in the PR quadtree at an aggregation level X using a depth based sort. . . 189
6.12 This shows the envelopes using 1SD either side of mean at each node in the PR quadtree at an aggregation level X using a depth based sort . . . 189
6.13 Visual depiction of the transfer functions used. . . 190
6.14 This shows a visual depiction of the tubes transfer function without depth sorting . . . 191
LIST OF FIGURES xvii
6.15 This shows a visual depiction of the tubes transfer function with non pairwise depth sorting. . . 191 6.16 The figures show different levels of aggregation of the tree. In the
left hand column is the PCP while the right column shows the plot window. Both are linked together. The user can interactively change the level of aggregation to explore. While it may not be useful to display the tree at such low levels, the figures demonstrate how the user can choose the level of aggregation. These views depict a single time step, however the user can step or animate through time to see how the data changes over time. . . 194 7.1 The schematic represents a typical transect across an estuary (left)
with points that are regularly sampled to interpolate the data across this transect (right) . . . 197 7.2 Multiple fluxes from various locations in the Dyfi estuary.
Repro-duced from Robins [243] . . . 198 7.3 The Transect is divided into n cross sectional trapezoids . . . 203 7.4 Illustrates the conversion from point based velocities to cell based
perpendicular velocity. . . 204 7.5 Illustrates the calculation of the perpendicular (normal) component
of the segment’s velocity. . . 204 7.6 the skeleton as defined by the user. . . 207 7.7 initial rectangular boundaries placed around each of the piece-wise
segments of the skeleton. . . 207 7.8 the joining of the two boundary ends to form continuous region. . . 208 7.9 T showing the trapezoid boundary. . . 208 7.10 boundary after user manipulation . . . 208 7.11 the interpolated points that will form the starting and ending points
for the interpolated transects. . . 209 7.12 the interpolated transects the algorithm will generate. . . 209 7.13 Diagram (i) Shows the Burry estuary with the region transect/flux
before calculation. Diagram (ii) demonstrates the result from the algorithm, with all the transect positions calculated. It shows the regular distribution of the generated transects. . . 209 7.14 shows the publishable output from VINCA of a simple transect
LIST OF FIGURES xviii
CHAPTER
1
Introduction
Preamble This thesis could be said to originate, in part, from a gift from my fa-ther: a few years ago, well aware of my interest in anything to do with physical oceanography and also my firmly held views on the value of more visualization and fewer words, my father gave me a ‘vintage’ oceanography book, he discovered in a dusty second hand book shop. Imagine my surprise when I opened the book and one of the first plates to leap out of it was an 1860 hand drawn representation of the Gulf Stream using what can only be described as an extremely early version of a Line Integral Convolution – LIC (Figure 1.1), followed by a representation of a transect of the North Atlantic Ocean (Figure 1.2), and a frequency representation (tally chart) of the winds used for creating Pilot Charts (Figure 1.3). The book, “The Physical Geography of the Sea and its Meteorology”, by Captain M F Maury [196], which is over 150 years old, seemed almost contemporary in some of the visual analysis techniques it was using to convey information and understanding of com-plex concepts for large volumes of sampled data. I reflected that if oceanographers
were applying such techniques in the middle of the 19thcentury to gain insight into
their data, using painstakingly sampled data, pen and ink, we should be capable of producing a visual analytics system for coastal shelf and estuarine research, with the wealth of knowledge of visualization at our disposal. In fact, Collins [64], in ‘Data Visualization has it all been seen before?’ concluded that the major data vi-sualization techniques had all been developed before the advent of computers, albeit for real (sampled) data. Whilst accepting that such a tool today requires
represen-CHAPTER 1. INTRODUCTION
tation of vastly more data, what was being achieved then was comparative. Thus, it would be following in a long visual tradition to explore and try to identify advanced visual means to enable coastal and estuarine scientists to analyse their data more efficiently and effectively. Out of that, this thesis was born.
Figure 1.1: Direct reproduction from Maury [196] “Plate VI. illustrates the
po-sition of the channel of the Gulf Stream for summer and winter. The diagram A shows a thermometrical profile presented by cross-sections of the Gulf Stream, ac-cording to observations made by the hydrographical parties of the United States Coast Survey.”
CHAPTER 1. INTRODUCTION
Figure 1.2: Direct reproduction from Maury [196] “Plate XII.exhibiting a vertical
section of the Atlantic, and showing the contrasts of its bottom with the sea-level in a line from Mexico across Yucatan, Cuba, San Domingo, and the Cape de Verds, to the Coast of Africa.”
CHAPTER 1. INTRODUCTION
Figure 1.3: Direct reproduction from Maury [196] “Plate V.is a section taken from
one of the manuscript charts at the Observatory. It illustrates the method adopted there for co-ordinating for the Pilot Charts the winds as reported in the abstract logs. For this purpose the ocean is divided into convenient sections, usually five degrees of latitude by five degrees of longitude. These parallelograms are then subdivided into a system of engraved squares, the months of the year being the ordinates, and the point of the compass being the abscissae. As the wind is reported by a vessel that passes through any part of the parallelogram, so it is assumed to have been at that time all over the parallelogram. From such investigation as this the Pilot Charts are constructed.”
1.1. THE GRAND SCIENTIFIC CHALLENGESCHAPTER 1. INTRODUCTION
1.1 A Wider Context: The Grand Scientific
Chal-lenges
In a transformational period for scientific researchers, computer simulation and analysis is replacing traditional ways of exploring scientific phenomena. The evo-lution of scientific studies over many millennia has relied on dependable data to enable theories to be developed and tested, to extend knowledge and to support pre-dictions. This thirst for data has driven continuous improvements in the methods of taking and recording data – from the humble wax or stone tablets used by ancient scribes, to the classical scientists notebooks, and now to the modern digital age of the computer. Each advancement enhances the level of detail of experimentation and study, but in turn generates ever increasing quantities of data.
The scale of the analytical problem is discussed in The Fourth Paradigm [114,
130]: gigantic projects such as CERN’s Large Hadron Collider1, or the Pan-STARRS
camera array of telescopes with four cameras each generating 1.4billion pixels 2
are each capable of creating Petabytes of data per day [27]. Similar challenges face university researchers, whose day-to-day research consistently generates Gigabyte datasets. Discussing geoscience modelling, Erlebacher et al. [87] described the ex-ponential increase in data volumes as ‘data flooding’, leading to ‘information over-load’ [169] Thus, whilst data intensive projects bring huge opportunities, they also bring challenges to existing methods of study, as conventional analytical methods have limited effectiveness [26, 286]. The struggle to handle the amount of infor-mation available for analysis threatens the clarity and insight which improved data production should support. Paradoxically, more data leads to less understanding, with data analysis techniques lagging behind the ability to generate data, necessi-tating new interpretative tools supporting knowledge discovery [85, 130].
Earth Sciences (including Ocean Sciences) exemplify this. Enhanced computing power has led to improved methods of gathering both observed and modelled data (in mathematical models the resolution of calculation lattices has increased, more variables are incorporated and wider time periods are investigated). Advanced sim-ulation tools are capable of generating Terabytes of multi-field data, with complex inter-relationships, and along with understanding one simulation, frequently, there is a need to explore and compare simulations and possibilities. This presents chal-lenges to the scientist to organise the data in a meaningful way; undertake query
1http://public.web.cern.ch/public/en/lhc/lhc-en.html
1.1. THE GRAND SCIENTIFIC CHALLENGESCHAPTER 1. INTRODUCTION
and analysis supported by visual tools; document the results, and share and present the results to others. Nonetheless, despite the analytical challenges, models afford benefits, for example, the need to run physical experiments may be obviated.
However, current tools increasingly lack the capability both to analyse the data and visualize it appropriately. In ocean sciences, users employ tools such as MAT-LAB and Excel to visualize their data, and whilst the results are accurate, the tools do not work well on large datasets, they are not interactive, can often be time-consuming to set up, and rely on specialist knowledge to operate them. Therefore, they do not permit rapid exploration of different scenarios.
Gray [109] reflects on this in his talk on eScience to the NRC-CSTB in Mountain View in 2007:
“Some research communities use MATLAB, for example, but the fund-ing agencies in the U.S. and elsewhere would do a lot more to foster the building of tools to make scientists more productive. When you go and look at what scientists are doing, day in day out, in terms of data anal-ysis, it is truly dreadful. Where essentially the only tools I have at my disposal are MATLAB and Excel!”
To advance from this, scientists will increasingly rely upon new techniques to gain understanding [114,286], and a goal for computer scientists is to provide more interactive and analytical tools to aid domain scientists. Science will be increasingly done in the database, finding relationships among existing data rather than focusing on data collection [282]. This will require the data to be reorganised to clarify and illuminate – to “hide complexity” [40] to reveal spatial and temporal relationships and enable researchers to interrogate data in a timely manner. Thus databases will become an intrinsic element of scientific study – a case argued by Emmott and Ri-son [85], in “Towards 2020 Science”: integration of computer science concepts, methodology and data analysis into scientific theory, experimentation and analysis will create a golden triangle of data exploration, where novel conceptual and tech-nological tools from computer science will support enhanced scientific problem solving.
In “The Fourth Paradigm” [130], the contributing authors discuss how evolving data exploration practices are leading to a new scientific research paradigm. Gray’s case [109] is that unifying theory, experimentation and simulation into a data inten-sive pipeline represents a new “Fourth Paradigm” of data exploration (the previous three paradigms being empirical, theoretical and computational). Here,
computa-1.2. ROLE OF SCI VIS CHAPTER 1. INTRODUCTION
tional science and visualization may support exploration of bigger datasets; corre-lation of data to other datasets and collaboration between researchers to improve insight and make new discoveries that might not be possible with traditional ways of working.
1.2 The Role of Scientific Visualization
Scientific research relies on display methodologies both to illustrate and explain insights and conclusions, and to support analysis, understanding and comparison
of datasets. For the past 25 years or more, this included computational scientific
visualization systems, which proved valuable in integrating disparate datasets; fa-cilitated comparison with other sources of data [321]; allowed researchers to view datasets in their entirety [99, 122]; detected features, and revealed relationships. Hence, scientific visualization played an important role in data exploration, with the discipline rapidly reaching a state of some maturity [189, 282].
However, the ’unprecedented and overwhelming’ [152] requirement to support increasingly complex modelling and simulations generating ever larger datasets has challenged models’ analytical tools to provide the required insight. Thus, Thomas and Cook, in “Illuminating the Path” [286] conclude that fundamental limits are being approached, requiring a reduction of the scale of the data to a level which can be studied and understood by researchers.
Concurrently, there has been a period of introspection and review of the fu-ture of scientific visualization – Johnson’s visualization research challenges and Lorensen’s ‘On the death of visualization” among others [152,189,299]. Whilst the important role of scientific visualization in providing insight into data is recognised, there is a sense that future advances may be incremental, and may not involve the step changes of earlier years. Although Johnson [152] and Ertl [88] consider the development of a theory of visualization an important goal, many researchers con-clude that visualization is not necessarily an end in itself, but an important element of its applications. Scientific visualization has to adapt to new models and simula-tions, so a more useful approach may be to focus on user needs in this data intensive era [299]. Many visualization techniques are now highly advanced, but quite often well-established techniques are not usable with complex applications, such as the extremely large, domain specific, multi-field datasets generated by, for example, ocean science research.
pro-1.2. ROLE OF SCI VIS CHAPTER 1. INTRODUCTION
vide added value, for example by incorporating tools permitting accurate calcula-tions and analysis not possible with more conventional means. They must also be capable of evaluation through user testing [88, 189, 299], with usability and evalua-tion regarded as a major challenge for the future development of visualizaevalua-tion [180]. There is, therefore, a strong case for a more collaborative, user-focused approach between scientific researchers (the users) and the computer scientists developing visualization and analytic systems for advanced data exploration, supporting the predictive research necessary for resolving some of the major challenges facing sci-entists today. Such studies might also, through the challenging visualization ques-tions they pose, lead to further insight into core visualization research and enable new application areas to be developed.
1.2.1 Visual Analytics
The above debate is particularly relevant for study domains incorporating extremely large, multi-field data, where analytically important detail may be buried within the mass of data [286]. Analysing this data is challenging but valuable, as it supports detailed exploration and reduces uncertainty, as large data may provide more com-plete information, thus there is a strong case for systems to exploit and understand data hidden within datasets [165]. However Earth and Ocean science research is such a domain, where the size and complexity of the data necessitates:
• functions to filter and reduce the amount of data.
• software and display scalability.
• multi-resolution representation of the data.
These needs may be met by visual analytics, defined by Thomas and Cook [286] as:
“the science of analytical reasoning facilitated by interactive visual an-alytics ... enabling information to be synthesised and insight to be de-rived.”
Hansen et al. [114] considers visual analytics to be an integral part of science discovery, enabling:
“..the detection and validation of expected results while also enabling unexpected discoveries in science. It allows for the validation of new
1.3. THE OCEANOGRAPHIC DOMAIN CHAPTER 1. INTRODUCTION
theoretical models, provides comparison between models and datasets, enables quantitative and qualitative querying, improves interpretation of data, and facilitates decision making. Scientists can use visual data analysis systems to explore what if scenarios, define hypotheses, and examine data using multiple perspectives and assumptions”.
To achieve those outcomes, visual analytics system developers will need to work with users to:
• identify their needs and problems in studying specific aspects of their data
• suggest new ways of investigating the domain data
• develop appropriate, interactive novel tools to facilitate analysis
• synthesise tools with visualization techniques to transform the data
• develop representations of the data at appropriate levels of complexity for
differing audiences.
In meeting these requirements, an interactive, investigative environment is cre-ated, where visual analytics may enable information overload to be transformed into opportunity [165].
1.3 The oceanographic domain & its data challenges
1.3.1 Overview
Through its dynamic nature and the size and complexity of its data, Oceanography suggests itself as a useful domain for studying aspects of data exploration in a data intensive world. Its multi-scale geological, biological, chemical and physical pro-cesses require data analysis over extremely lengthy periods, produce gigabytes of data for each time step and involve simultaneous measurement of multi-disciplinary, dynamic processes over areas ranging from vast ocean expanses to small estuarine and river flows. Methods of collecting data include physical and satellite observa-tion systems, but also numerical modelling. Comprehensive observaobserva-tion systems re-quire huge resources, but because of the vast domain, they cannot be all encompass-ing, so modelling has become important in simulating real physical processes [238]. Furthermore, Ocean Science presents its own grand challenges: Brandt [44] links the goals of long term ocean research with methods to ameliorate human
1.3. THE OCEANOGRAPHIC DOMAIN CHAPTER 1. INTRODUCTION
predicaments, and with applied research to manage ocean resources, thereby iden-tifying a number of significant priorities. These include, among others, understand-ing, modelling and predicting climate; understanding and predicting changes to ocean ecosystems; understanding and predicting natural catastrophes and under-standing the long-term effects of events such as storm surges, hurricanes and flood-ing.
1.3.2 Coastal shelf studies and modelling
Climate change is a major scientific concern of our era, and studying the oceans’ physical mechanisms is a key to understanding the changes and planning for the future. Studies of the coastal shelf are important because of the impact of climate change on the coastal margin. Fifty percent of the world’s population lives within
60kmsof the shoreline [67], and the Intergovernmental Panel on Climate Change,
in its 2007 report, projected a global rise in sea levels of18−59cmsbetween 1990
and 20903. In the area of study, Wales – DEFRA (the Department for Environment,
Food and Rural Affairs) [91] predicted sea level rise exceeding 10mm pa., in the
second half of the twenty first century. The socio-economic impact of sea level rise on coastal zones worldwide is well documented, and estuaries and associated coastal shelves present a combination of attributes requiring careful management, including protected eco-systems, centres of population, and industries essential to the economic well-being of the area, such as leisure, tourism, fishing etc.
Coastal shelf studies often use simulation and predictive modelling, as historic rates of change to sea level may not be reliable guides to predicting changes in the future [48, 206], although agreement between sea level rise models has been poor, and there are significant regional variations because of non-uniform future ocean warming. Nonetheless, models are crucial to understanding how sea level changes affect the near shore region, to support flood prevention and extreme event management; dredging; port operations, and major engineering projects, such as offshore wind farms.
Thus, taking into account the demands of studying large data, its complexity in this domain and the need to resolve a significant real world problem, modelled coastal and estuarine studies presents an appropriately challenging area of study on which to test the hypotheses of this thesis. The many hydrodynamic variables include fresh river water interaction with saline water to produce strong baroclinic
1.3. THE OCEANOGRAPHIC DOMAIN CHAPTER 1. INTRODUCTION
currents; shallow water depth generating non-linear tidal movements; the impact on water circulation of a typically complex topography, plus human intervention (e.g., coastal defences) [239].
Furthermore, coastal shelf models are often more complex, unpredictable and detailed than deep ocean models [181, 321], producing ever larger datasets, with many interconnecting factors. The models tend to be high resolution and cover only part of the coast although recently, one of the ocean science collaborators on this project has developed modelled simulations extending well out into the Irish Sea,
which will generate even larger, and more complex datasets 4. Thus, within this
context, researchers exploring, comparing and contrasting different simulations and parameterisations of the data must integrate visualized data with analytical methods and store these intermediate results and investigations in a database. Such data intensive discovery processes add to the visualization and analytical challenges by exerting even greater computational and visual computing pressures.
1.3.3 Visualization and visual analytics challenges
Whilst visualization techniques are commonplace in ocean science studies, research demonstrates that current processes are ad hoc and piecemeal. Szalay and Gray [282] acknowledges that few visualization systems are able to visualize data across mul-tiple scales and numerous data sets, similarly Keim et al. [165] considers this a challenging research area in relation to the scale and uncertainty of the data: data are often incomplete, occur at different scales and are interpolated or based on dif-fering assumptions. Furthermore, many visualizations are static plots of transects or sample points from the entire dataset, making it difficult to obtain an overview of the dataset or to explore and contrast different datasets (methods for visualizing the data often do not seem to have a high priority with model developers [299]). This constrains comparative investigations, and there is a lack of visual analytics tools within the coastal shelf and estuarine domain.
New techniques and tools (of which visual data analysis is one example), are, therefore, needed to bring clarity and perception into this data intensive world. Ad-vanced visual analytics techniques have been recognised as valuable for studies of large volumes of multi-field data [167]. Hence, by collaborating with ocean scien-tists developing estuarine flooding scenarios, which study the diverse relationships between flow hydrodynamics, sediment transport, bottom morphology and coastal
1.4. COLLABORATION WITH OS CHAPTER 1. INTRODUCTION
erosion, the goal is to create and test a data exploration system. This will incorporate intuitive, domain-based, visual analytic interfaces, which deal with the data gener-ated at an appropriate speed, and which support complex querying. The hypothesis is that these novel visual analytics will support a greater level of knowledge dis-covery and inference, to enable the researcher to converge on a particular outcome and seek a specific answer, as well as permitting analysis to support comprehensive investigation of plausible alternatives.
1.4 Collaboration with Ocean Scientists
The thesis investigates an oceanographic problem from the perspective of a com-puter scientist, bridging the divide between these two domains by utilising novel visual analytic techniques for a real world problem. The work has been undertaken in collaboration with the Centre for Applied Marine Sciences (CAMS), Bangor Uni-versity, using case studies based on coastal and estuarine regions in South and West Wales, which are increasingly prone to flooding. CAMS researchers, in conjunc-tion with the Countryside Council for Wales, have studied a number of estuaries to model and analyse the potential for flooding, consequent upon generally accepted views of climate change and sea level rise5[78, 231] .
Professor Alan G Davies and Dr Peter Robins of CAMS kindly provided datasets from their flooding scenarios for the system development. Discussions with these end-users enriched the motivations, helped identify the challenges in studying the data, and supported the development of an appropriate visualization and visual an-alytics system. They have given a particular focus to the identification and devel-opment of tools, provided a case-study for implementing and testing the tool, and given direct input over the evaluation of the created technologies, algorithms and tools.
1.5 Hypothesis
Initially,limitationsin current display and analytical practices were identified which drive the motivation for this thesis:
1. Coastal shelf researchers utilise several different visualization tools e.g. MAT-LAB, Blue Kenue, Excel to display information, which can take several
1.5. HYPOTHESIS CHAPTER 1. INTRODUCTION
utes to generate a single plot, and several hours to explore and visualize dif-ferent scenarios and data parameterisations.
2. Scientists wish to perform complex analysis on their data, which currently requires a sequential process involving several tools. For example, they may use MATLAB, R and Excel sequentially to analyse the data, each time stor-ing intermediate results in files. This, too, is time consumstor-ing, and the use of several tools is neither convenient nor effective for large datasets, resulting in difficulty in displaying and exploring time, and specifically in creating anima-tions of the visual depicanima-tions. Bespoke animaanima-tions can be made for specific scenarios, but again they take time and effort to create.
3. The limitations of the analytical and visualization process described in 2, hin-ders the creation of high quality output renderings in a vector format to enable the visualization to be viewed at any resolution.
4. As a consequence of increasing amounts of data, scientists are losing the abil-ity to effectively visualize and analyse the underlying data in a timely and effective manner.
Building on these limitations, the hypothesis hasfour propositions:
1. If it is possible to develop a Visual Analytic tool for estuarine and coastal shelf analysis that integrates several visualization forms, then researchers will be able to perform concurrent, complex analysis and visualization of their data. A conglomerated and multiple-view system would support more rapid discovery and enable complex operations and calculations to be performed on the data, which were previously not possible.
2. If the processed or derived data is made available to the Visual Analytics tool then scientists will be able to be more efficient and less ad hoc in their analysis.
3. If the visual analytic tool is able to generate several different views of the data, then one of the renderings might be an output rendering in a vector format to support viewing and study of the visualization at any resolution.
4. There are many structures and methods in computer science that enable rapid calculations. If these can be integrated within a Visual Analytics tool then
1.6. CONTRIBUTIONS OF THE THESIS CHAPTER 1. INTRODUCTION
the scientists may be able to analyse their large datasets on a fast desktop computer.
Linked to the four propositions of the hypothesis are thefour aimsof the thesis, which are: to develop a visual analytics tool for Coastal and Estuarine studies; to allow derived (new) data to be made available to the domain scientist for analysis; to generate different views of the data including an output rendering in a vector format, and finally, to use Computer Science methodologies to enable rapid and effective visualization and analysis of the data.
1.6 Contributions of the thesis
The application of novel visual analytics, including computational tools, to large, complex oceanographic datasets permits interactive interrogation of the data and allows more expressive data-exploration tasks to be performed. A collaborative approach with coastal shelf scientists to identify their study needs allows the de-velopment of systems and tools, which will add to understanding, and support the predictive capabilities of numerical model simulations.
In defence of this statement, the thesis makes the following contributions: 1. Researches how visualization and visual analytics might aid understanding
of coastal shelf and estuarine flow, and reviews current practices in relation to coastal shelf and estuarine visualization and visual analytics.
Hydrodynamic flow (tides and currents) is a key to understanding the physi-cal processes affecting the coastal shelf, including estuaries. However, it is extremely complex, as it is influenced by many factors, both hydrodynamic and non-hydrodynamic, and it in turn, influences the evolution of estuaries, the surrounding coastline and their associated eco-systems. But coastal shelf re-searchers, themselves, acknowledge the limitations of current methods of analysing this domain, which requires studies of these inter-relating factors on many scales. 2. Collaborates with ocean science researchers to understand their needs.
Many ocean scientists identify the importance of their research in relation to the implications of climate change, in particular sea level rise. At the same time, they recognise the challenges of interrogating, analysing and understanding their extremely large datasets and the limitations of existing methodologies for predicting future trends and the projected impact of extreme events. Yet it is
1.6. CONTRIBUTIONS OF THE THESIS CHAPTER 1. INTRODUCTION
argued that coastal shelf and estuarine studies are even more complex than deep ocean studies, with very many more closely interrelated factors at play.
Estuarine studies assume great importance in relation to sea level rise, as the coastal fringes of estuaries often contain large populations. For this reason, un-derstanding the physical processes within the estuary and the increased potential for flooding are necessary for planning and management of the area.
A review identified a number of visualization and visual analysis challenges in supporting the exploration and understanding of these extremely large, complex, multi-field data sets. Whilst the problems relating to some aspects of the vi-sualization pipeline have been quite widely addressed, there were few studies identified for the application of visual analytics techniques relating to coastal shelf studies, and even fewer applications for estuarine research.
The need for researchers to be able to drill down into these large and complex data, together with the limited availability of visual analytics systems for mod-elled estuarine hydrodynamics, led to its selection as an appropriate area of study. 3. Proposes a number of new approaches to enable the development of a novel, interactive, data querying and visual analytics system for coastal shelf and estuarine studies.
The system permits coastal shelf and estuarine researchers to be able to explore, query, interactively investigate and quantitatively compare different runs and pa-rameterisations of simulations of estuarine hydrodynamic flow; enables detailed study of key elements of the data, not easily accomplished by traditional meth-ods, and supports the predictive requirement for their research.
The approach demonstrates how interactive visual analysis aids detailed explo-ration of flooding scenarios, to help identify areas which will be prone to flooding under certain circumstances, and thus supports the development of coastal flood management processes.
4. Proposes a linked Coordinated Multiple View Interface (CMV), to permit complex querying of ocean science data.
The system examines and compares differing scenarios of multi-field, structured and unstructured data types, to establish the impact of differing variables. Thus, the interface provides a multiple linked view interface (Hierarchical-Model-View), based on the Model-View-Controller pattern; several plot windows; temporal
1.6. CONTRIBUTIONS OF THE THESIS CHAPTER 1. INTRODUCTION
graphs and parallel coordinate plots (PCPs) to investigate the highly complex data. There are links between views and animation and users are able to easily add new views and select new values for display in another graph.
5. Develops a new rendering technique for Parallel Coordinate Plots (PCPs).
PCP has been shown to be useful for displaying special and large multi-time point data, but there are difficulties due to the size of the data, causing clutter which affects performance and inhibits interactive spatial exploration.
A solution is proposed, that extends the framework by Fua et al. [93]. This algo-rithm performs a hierarchical parallel coordinate that bins the PCP on the spatial nature of the data, using a data space methodology to aggregate the information in the geo-spatial domain based on the level of detail in the data, rather than the frequency of the data in the PCP. The proposed work creates a binned PCP by developing several associated (linked) data structures (using a quadtree to spa-tially index the data). Whilst other researchers have explicitly followed Fua et al’s. framework, few other systems have used spatial structures to relate the spa-tial nature of data flow to exploration of the information. The work presented in this thesis uses the PR-quadtree, linked with a geospatial plot of the data to enable both interaction and exploration of the simulations.
6. Proposes a new tool to enable researchers to undertake the calculation of tidal flux.
The tool demonstrates the ability of visual analytics to provide enhanced analysis and computational facilities, by applying a user defined, path-based algorithm to calculate derived data. A significant challenge for ocean science researchers is investigating simulated data and applying analytic techniques, such as calculat-ing maximum tidal flow, or the limit of potential floodcalculat-ing events, by utiliscalculat-ing different metrics and equations to perform specific quantitative analysis.
Flux calculation was selected to prove the effectiveness of the tool. It is consid-ered by ocean science researchers to be one of the most important hydrodynamic calculations, and is essential to support prediction of future trends, but it is a complex calculation not easily accomplished through existing post-processing systems, and requires numerous transects across the estuary.
The proposed tool permits all locations to be calculated and analysed in one step. It is a coordinated, multiple view tool that provides several plot windows and parallel coordinate plots (PCPs) for rapid exploration, (using a frequency
1.6. CONTRIBUTIONS OF THE THESIS CHAPTER 1. INTRODUCTION
binning approach to deal with the problem of overplotting, based on Novotny and Hauser’s [211] algorithm) and temporal graphs. It loads the simulation data; derives diagnostic data calculated from a metric or equation, which is stored in a database, and visualizes the derived data. This enables the user to investigate whole series of transects (where previously they would have selected just a few), and then to focus on supplementary analysis of the derived data.
1.6.1 Publications
There are four publications that have been made from this dissertation: In 2009, a conference paper was published that described comparison between different soft-ware programming tools. Part of the background and motivation published in this paper is recorded in this dissertation.
• R.L.S.F George, J.C. Roberts, “Coastal Shelf Visualization using VTK
and OpenDX of Hydro-Informatic Numerical Models”, Proc. of Theory and Practice of Computer Graphics 2009, Cardiff, pp223-232, ISBN 978-3-905673-71-5.
Second, the Processing language has been used as the graphics library to gen-erate the ocean science visualizations. In fact, the developed software discussed in this dissertation developed incrementally . Initially this was named iCove, and later was re-named VINCA. The initial design and development of iCove and how Pro-cessing was used to implement some of the parts was published in the TPCG 2010 conference proceedings. This material is included in the design Chapter.
• R.L.S.F.George, J.C.Roberts and A.G.Davies. “Using Processing to
de-velop iCove: a tool for interactive coastal oceanographic visualization”, EG UK Theory and Practice of Computer Graphics (2010), J. Collo-mosse, I. Grimstead (Editors), Eurographics Association, University of Sheffield, September 2010, pp.99-105.
Third, a poster was presented on VINCA at VisWeek2012 in the LDAV work-shop. This is also published as a two-page paper and recorded in the IEEE Digital Library.
• R. George, P. Robins, A. G. Davies, J.C. Roberts,“Interactive Visual
An-alytics of Coastal Oceanographic Simulation data”, IEEE VisWeek 2012, Seattle, Washington, October 2012. IEEE Computer Press.
1.7. STRUCTURE CHAPTER 1. INTRODUCTION
Fourth paper was presented at the EnvirVis Workshop at Euroviz 2013, Leipzig, Germany, June 2013, which discusses the development of a novel tool, as part of the VINCA visual analytics system, for measuring estuary transects and calculating tidal flux. This material is included in Chapter 7, which discusses the VINCA Flux tools. An extended version of the paper has been invited for publication in a topical issue of the ISI journal Environmental Earth Sciences.
• R. George, P. Robins, A. G. Davies, J.C. Roberts,“Visual Analytics of the
Hydrodynamic Flux for Coastal Flooding Prediction and Management”, Workshop on Visualisation in Environmental Sciences (EnvirVis), Euro-Vis 2013 , pp. 1-5. O. Kolditz, K. Rink and G. Scheuermann (Editors)
1.7 Structure
The thesis is structured as follows:
Chapter 2. The Data & Casestudy locations: The data used for the case studies are described and discussed, and placed in the context of similar research worldwide. The chapter explains the role of modelled and sampled data in the research, and provides an overview of the TELEMAC-2D hydrodynamic model which generated the simulated data used in this thesis. The limitations of the existing display and analysis systems for the model are reviewed. The chapter also considers the nature of the data and the challenges they present to effective visualization and analysis, which informs the development of ideas and concepts for the proposed visualization system. Visual analytics method-ologies, tools and techniques are introduced, reflecting on the important as-pects of a visual analytics system for coastal shelf and estuarine research and producing a summary of requirements for such a system.
Chapter 3. The Visualization Context: review of practices in ocean science visualization and visual analysis:
the current state of evolution of visualization systems is reviewed under a number of headings to support the identification of approaches in developing an appropriate visualization and visual analytics system. This takes into ac-count the needs of coastal shelf researchers, the attributes and challenges pre-sented by the data, and the strengths and limitations of visualization software systems. The influence of climate change studies, including the evolution of large scale observatories and Environmental Decision Support Systems, on
1.7. STRUCTURE CHAPTER 1. INTRODUCTION
the current state of the art in coastal oceanographic visualization is discussed. The review also considers architecture and data management systems in rela-tion to ocean science visualizarela-tion and visual analytics.
Chapter 4. Related Work: This research based chapter underpins the thesis and provides the principles upon which the visualization and visual analytics sys-tem are developed. It studies how ocean scientists conduct their research and the analytic tools they use; reviews oceanographic visualization prac-tices; identifies challenges and techniques relating to the specific attributes of the data; considers the issues facing researchers with regard to large data management and scalability, and identifies and discusses appropriate visual analytics tools for dealing with the data challenges, whilst meeting the ocean science research goals
Chapter 5. System Overview: The scope of this chapter covers both initial design and prototyping, together with building the system. Initial design thoughts are tested through prototyping, challenges identified and solutions proposed, leading to a summary of system requirements and the identification of an ap-propriate programming tool. One of the significant contributions of this thesis is discussed: the development of a PR-Quadtree spatial index for scaling the data, which is utilised in different forms within the visual analytics system. The remainder of the chapter is devoted to the process of building the visu-alization system – the GUI, and the visual analytics system, including the linked Coordinated Multiple Views, the views, plots and graphs. Issues of interaction and interfaces are also discussed.
Chapter 6. Parallel Coordinate Plots – Drilling into the Detail: one of the prin-ciple components of the visual analytics system is discussed in detail. Three variants of a PCP are described and tested to assess their ability to explore and interactively visualize the datasets; to provide derived data for further itera-tive analysis and to identify trends and correlations. Particular focus is placed on the development and implementation of methodologies to deal with the acknowledged issue of overplotting in relation to PCPs and large datasets.
Chapter 7. Deriving New Data – Completing the Visual Analytics Loop: this de-scribes the design and development of a flux calculation tool as a case study to demonstrate the benefits of a collaborative approach with ocean scientists. Their needs were identified, their research methods studied and a custom tool
1.7. STRUCTURE CHAPTER 1. INTRODUCTION
developed which would significantly improve the speed and effectiveness of their ability to study and calculate a key measure for their predictive capa-bilities (tidal flux). The aim of this tool in demonstrating the iterative visual analytics paradigm is also discussed, in relation to its ability to provide de-rived data.
Chapter 8. Discussion & Conclusions: this reflects on all stages of the projects. The chapter reviews the work in relation to the hypotheses; considers users’ evaluation of the system; discusses the main contributions and makes propos-als for the development of a best working practice for the analysis of coastal shelf and estuarine modelled data, including the need for close collaboration between domain researchers and computer scientists. The chapter concludes with suggestions for taking the work forwards.
CHAPTER
2
The Data & Case-study locations
The datasets for this dissertation are created from a two year project undertaken by Bangor University’s Centre for Applied Marine Sciences (CAMS), in support of coastal zone management, including flood prevention, in two estuarine environ-ments in Mid Wales and South West Wales [242,243]. The data comprises a number of predictive flooding scenarios derived from the TELEMAC-2D numerical model of hydrodynamic flow.
Ocean science researchers wish to investigate and analyse this simulated data with the aim, for example, of calculating maximum tidal flow or the limits of po-tential flooding events, by applying different metrics and equations over the data. Thus, not only is there a need for visualization of the simulations, but also a require-ment to apply algorithms and equations over selected areas of the data to support quantitative analysis. This chapter describes the data, particularly focusing on the data creation and numerical models (sections 2.3 and 2.4), the modelling software (TELEMAC) (sections 2.5 and 2.6) and details and locations where the case-studies take place (section 2.2).
2.1 The Coastal and Estuarine Domain: the context
Ocean science encompasses both the deep ocean and the shallower continental shelf and is a complex, vast, and multi-disciplinary area of study incorporating
biolog-2.1. THE COASTAL DOMAIN CHAPTER 2. THE DATA
ical, chemical, geological and physical sciences. All these studies rely on an un-derstanding of physical principles, such as hydrodynamics, with the dynamics of coastal shelf waters being more complex than those of the deep ocean.
The area of interest for this work, the coastal zone, encompasses that part of the ocean which has coastal waters less than 200 metres deep, estuaries, and rivers up to the tidal limit – effectively that part of the ocean where physical, biological and geochemical processes are directly affected by the land adjacent to it. Here, there is a dynamic interaction between the tides, currents and waves of the coastal shelf seas and the land, which results in constant change within coastal zones. Figure 2.1 indicates the area of interest for this research project: the coastal shelf and estuaries.
Figure 2.1: Oceanographic domain showing the area of interest – coastal shelf and estuaries.
Estuaries begin at the point where a river becomes tidal (experiences the rise and fall of the tide each day). They are also subject to the other influences common to the coastal shelf. These include bottom friction, where the seabed interacts with the flow of water, through friction. Bottom friction is not a factor in deep ocean studies.
Cameron and Pritchard [52] describe an estuary as a semi-enclosed coastal body of water having a free connection with the open sea. Its water salinity differs from that of the coastal shelf due to interaction (mixing) with freshwater from rivers feed-ing into the estuary, and the influence of temperature, which may cause evaporation in the shallower estuarine waters. This thermohaline forcing (influence of temper-ature and salinity) causes stratification of layers of water with different salinity, a
![Figure 1.1: Direct reproduction from Maury [196] “Plate VI. illustrates the po- po-sition of the channel of the Gulf Stream for summer and winter](https://thumb-us.123doks.com/thumbv2/123dok_us/1481712.2698391/20.892.199.735.247.671/figure-direct-reproduction-maury-plate-illustrates-channel-stream.webp)
![Figure 1.2: Direct reproduction from Maury [196] “Plate XII. exhibiting a vertical section of the Atlantic, and showing the contrasts of its bottom with the sea-level in a line from Mexico across Yucatan, Cuba, San Domingo, and the Cape de Verds, to the Co](https://thumb-us.123doks.com/thumbv2/123dok_us/1481712.2698391/21.892.205.738.356.758/figure-reproduction-exhibiting-vertical-atlantic-contrasts-yucatan-domingo.webp)
![Figure 1.3: Direct reproduction from Maury [196] “Plate V. is a section taken from one of the manuscript charts at the Observatory](https://thumb-us.123doks.com/thumbv2/123dok_us/1481712.2698391/22.892.198.735.145.843/figure-direct-reproduction-maury-plate-section-manuscript-observatory.webp)


![Figure 3.1: copied from Stein et al. [277]: multivariate data visualization of salinity, isosurface of dissolved oxygen and flow vectors.](https://thumb-us.123doks.com/thumbv2/123dok_us/1481712.2698391/64.892.228.705.520.1022/figure-copied-multivariate-visualization-salinity-isosurface-dissolved-vectors.webp)
![Figure 3.2: Copied from Zhang et al. [326], multiple level of detail visualization of tsunami simulation, placed into global context.](https://thumb-us.123doks.com/thumbv2/123dok_us/1481712.2698391/67.892.198.721.238.437/figure-copied-zhang-multiple-visualization-tsunami-simulation-context.webp)
