Rochester Institute of Technology
RIT Scholar Works
Theses
Thesis/Dissertation Collections
7-13-1984
Spectral method of color conversion filter thickness
applied to simulation of CIE Illuminants
Paul Butterfield
Follow this and additional works at:
http://scholarworks.rit.edu/theses
This Thesis is brought to you for free and open access by the Thesis/Dissertation Collections at RIT Scholar Works. It has been accepted for inclusion in Theses by an authorized administrator of RIT Scholar Works. For more information, please [email protected].
Recommended Citation
SPECTRAL METHOD OF COLOR CONVERSION FILTER THICKNESS
DETERMINATION APPLIED TO SIMULATION OF CIE ILLUHINANTS
by
Paul M. Butterfield
A thesis submitted in partial fulfillment of the
requirements of Bachelor of Science in the School of
Photographic Arts and Sciences in the College of Graphic
Arts and Photography of the Rochester Institute of
Technology.
Paul M. Butterfield
Signature of Author __________________________________________ _
Imaging and Photographic Science
Franc Grum
Certified by ________________________________________________ ___
Thesis advisor
Approved by _ _ _
N_a_m_e_I_II_e~g_i
_b_le ______
_
ROCHESTER INSTITUTE OF TECHNOLOGY
COLLEGE OF GRAPHIC ARTS AND PHOTOGRAPHY
PERMI SSI ON FORM
Title of Thesis:
SPECTRAL METHOD OF COLOR CONVERSION FILTER
THICKNESS APPLIED TO SIMULATION OF CIE ILLUMINANTS
I, Paul M. Butterfield, hereby grant permission to
Wallace Memorial Library, of the Rochester Institute of
Technology, to reproduce my thesis in whole or in part.
Any
reproduction will not be for commercial use or profit.
Paul M. Butterfield
Signature of Author __________________________________________ _
Date
h
I~.
1
~8'L
ABSTRACT
A spectral method of
determining
color conversionfilter thickness is described. This method uses spectral
data from system parameters to determine thickness. Optimization of the input distribution
by
varying bulbcurrent is discussed.
Using
the spectral method ofthickness variation, two CIE
Illuminants,
D55 and D65 weresimulated. The simulators were measured for goodness of -Fit
and showed a strong similarity with their respective simulators. Mean square deviations were calculated for each Illuminant and were 11,9? and 11.33 for D55 and D65
respective! y.
ACKNOWLEDGEMENTS
The author would like to express his appreciation for
the assistance and guidance supplied
by
thesis advisor, DrFranc Grum.
Additionally,
thanks are due to Mr. R. Mitchell Millerand Dr.
Roy
BernsDEDICATION
This thesis is dedicated to the author's parents, Mr
and Mrs. Marcius Butterfield.
TABLE OF CONTENTS
Page
THESIS RELEASE FORM ii.
ABSTRACT ii i .
ACKNOWLEDGEMENT iv.
DEDICATION v.
TABLE OF CONTENTS vi .
LIST OF TABLES vii .
LIST OF FIGURES viii .
INTRODUCTION 1
EXPERIMENTAL 8
RESULTS 15
DISCUSSION 29
CONCLUSION 32
REFERENCES 33
APPENDIX A 34
APPENDIX B 55
APPENDIX C 58
VITA 69
LIST OF FIGURES
Fig. Caption Page
1 Relative spectral characteristics of CIE Illuminant 23
Illuminant D55 and Predicted and Realized Simulators
2 Relative spectral characteristics of CIE Illuminant 24
Illuminant D65 and Predicted and Realized Simulators
3 UCS Chromatici ties of CIE Illuminants and Predicted 26
and Realized Simulators
LIST OF TABLES
Table Caption Page
1 Filter thickness shown in relation to 15
input and desired output
2 Spectral Distribution of CIE Illuminant D55 17
3 Spectral Distribution of Predicted D55 Simual tor 13
4 Spectral Distribution of Realized D55 Simulator 1?
5 Spectral Distrbution of CIE Illuminant D65 28
6 Spectral Distribution of Predicted D65 Simulator 21
7 Spectral Distribution of Realized D65 Simulator 22
8 UCS Chromatid ties of CIE Illuminants and 25
Predicted and Realized Simulators
Mean square deviations between spectral
distributions for CIE Illuminant D55
10 Mean square deviations between spectral
distributions for CIE Illuminant D65
I. INTRODUCTION
It is common practice in
industry
for a high-colortemperature source to be created
by
standardizing atungsten-halogen source at a 1ow color temperature and
elevating the color temperature
by
use of a colortemperature conversion filter. This practice allows the use
of lower current and voltage levels creating cooler systems,
fewer temperature
hazards,
and extended bulb life.Conversion filters are manufactured in a number of
different forms. The Eastman Kodak
Company
manufacturesgelatin color conversion
filters,
specifically Wrattenseries 78 and 86. These filters convert color temperature
only
incrementally
and are subject to fading. El]Davis-Gibson filters are liquid filters which are
designed to convert sources approximating CIE Illuminant A
to a series of sources of higher color temperatures. The
filters are produced
by
preparing two specified chemicalsolutions and then combining these two solutions in varying
proportions in a glass container to control the amount of
color-temperature elevation. The disadvantages of the
liquid filters are their lack of convenience and their low
stability. [23
At least two manufacturers,
Corning
GlassWorks,
Corning
NY,
and Jenaer Glaswerk Schott itGen.,
Mainz Westspecifically for permanent source color temperature
conversion. The thickness of the filters may be varied
according to the degree of color temperature elevation
desired.
The filter thickness required is normally determined
by
use of a simple formula supplied
by
the manufacturer. E3]Equation 1
-6
C< 1/T1)-<1/T2> >*18 = K * t
where: Tl is the effective color temperature of the original source.
T2 is the effective color temperature of the filtered radiation.
t is the thickness of the filter in mm.
k is a constant, characteristic of the f il ter.
The manufacturer's equation is derived from Wien's
equation, a simplified form of the Planckian relation of
spectral radiant excitance to absolute temperature.
Planck's equation is defined mathematically
by
Equation 2.Equation 2
\ ~5 \ -1 "3
M <AjT> = CI <exp<C2/XT) - 1> W
m
where:
CI and C2 are radiation constants.
-16 2
CI = 3.74150
x 10 W m
C2 = 0.0 14388
m K
T is the absolute temperature of the
blackbody
in degrees kelvin.A
is the wavelength of the radiation.M is the spectral radiant excitance.
Wien's equation achieves a simplified form
by
assumingthe value of exp<c2/AT) is large compared with unity, thus
the subtraction of unity is omitted. The result takes the
form: [5]
Equation 3
M' = CI
A
exp< C2/XT> w mThe mechanism of the color conversion filter is an
induced change in the red-blue ratio of a source. To
increase color
temperature,
the red-blue ratio must bedecreased. This is what is accomplished
by
the applicationof a blue filter to a low temperature tungsten-halogen
The spectral properties of the filter should be such
that the chromaticity of the converted source remains near
to or on the Planckian locus. As the chromatici ties of
converted sources move further away from the Planckian
locus,
as is the case with poor color conversionfilters,
they
become less like Planckian approximates and more likecolored sources. This is an important point, if color
conversion filters were ideal and had linear spectral
densities,
a simplified equation would serve adequately todetermine thickness. The fact that filtration is not ideal
necessitates that spectral distributions be considered.
Important here is the distinction between the terms
distribution
temperature,
colortemperature,
and correlatedcolor temperature. All of the terms are related, and in
varying degrees of strictness, all describe properties of a
source tyi th respect to a Planckian radiator at some absolute
temperature.
Distribution temperature describes the absolute
temperature of a Planckian
blackbody
whose spectraldistribution curve is proportional
to,
or nearlyproportional to the defined source in the visible region.
In the case of distribution
temperature,
the source willnecessarily have the same chromaticity as the Planckian
radiatior, since their distributions are everywhere
proportional . Distribution temperature is the most
Color temperature describes the absolute temperature of
the Planckian radiator whose chromaticity is the same as the
chromaticity of the source. Since it is possible
fo-sources to have the same chromaticity, but different
distributions,
the term color temperature is lessrestrictive than distribution temperature. E7]
Correlated color temperature describes the absolute
temperature of the Planckian radiator whose chromaticity
lies closest to the chromaticity of the defined source on
the uniform chromaticity scale diagram. It may also be
thought of as the absolute temperature of the Planckian
radiator which most closely approximates it visually. The
chromatici ties of sources with correlated color temperatures
lie off the Planckian locus and their correlated
color-temperatures are usually found
by
the use of i sotemper-aturelines in either CIE x,y or CIE U,v"
space. Correlated
color-temperature is the least restrictive of the three terms.
Another approximate measure of color temperature is the
red/blue ratio. This method uses the measured spectral
power at 650 nm and 448 nm to indicate the slope of the
spectral distribution and thus allow appropriate conclusions
to be drawn about the correlated color
temperature,
colortemperature, and distribution temperature. This method is
useful for adjusting incandescent sources because the shape
of their distributions is well characterized and thus valid
spectral distribution. Since the method requires
only two
simple measurements, it is often used as a relative
indicator when changing the current supplied to a source and
correspondingly its color temperature.
The CIE Illuminants are numerical definini tions of
spectral power distributions designed to serve as standards
in colorimetry. It is
frequently
necessary to obtainsimulators of the CIE
Illuminants,
thatis,
to construct areal, physical light source whose spectral distribution i= a
close as possible to the numerical specification of spectral
power distribution defined
by
the particular CIE Illuminant.To aid in the approximation of an
Illuminant,
a measure ofgoodness of fit must be adopted to provide some method,
typically
numerical, for evaluating the closeness of thesimulated distribution to the defined distribution.
The concepts of least squares error and mean square
deviation may be applied to spectral distributions since
both concepts are mathematical methods of evaluating the
degree similarity of one set of cartesian coordinates to
another. Least squares error represents a sum of the
differences between two sets of corresponding data after a
constant is applied to minimize the sum. Least squares
error has been used in previous works to evaluate
distribution temperature. E8] It is defined mathematically
Equation 4
Sum squared error=
T
{ 1-E S'(X>/a S<A> 3 >
1
where: 1 is star
ting
wavelength.2 is ending wavelength.
S'
(.K> is tested distribution.
S<A> is defined distribution.
a is a constant to minimize the sum.
Mean square deviation also allows numerical analysis of
similarity between distributions and has been used in the
past to evaluate goodness of fit. E?3 It is defined below.
Equation 5
D = l/n>
V
E S<\>-Fl S'<\>3 >
2 2
<X' S<XJ/
CS
^S'<\> 33-Fl = S'
"1
where: D is mean square deviation.
Fl is scaling factor.
II. EXPER IMENTAL
A. Preparation of
Supporting
SoftwareA series of computer programs was developed to allow
the manipulation of spectral data necessary to support
spectral thickness determination routines.
Programming
wasdone on an Apple lie microcomputer in Applesoft (a
proprietary
"basic"
language). Spectral data was treated in
array
fashion,
such that a spectral distribution of 388 to708 nm sampled a 5 nm increments would occupy an array of 64
e1ements.
Programs were written to perform mathematical
operations on two spectral
distributions,
and to allowdistributions to be operated upon with a constant. A
plotting program was written to allow up to seven
distributions to be plotted on a single axis. A program to
calculate chrcmatici ties for either the 2-degree or
18-degree observer with any illuminant was written.
Programming
was written to generate Planckianblackbody
distributions for the range of useful absolute temperatures.
In addition, programs were written to correct disparate
distribution scaling, match wavelength
increments,
andnormalize distributions. To determine the goodness of
fit,
between two sets of spectral data. These programs were
integrated into a menu-type
format to allow them to be used
as a single package. (see Appendix A for listings of the
computer programs.)
B. Spectral Thickness Determination Software
A computer program to determine the required filter
thickness for specific color temperature conversion was
written. The program was designed to determine the required
filter thickness on the basis of spectral data of system
components. The
following
four parameters were input to thecomputer program:
1. The initial distribution of a low-color temperature
source.
2. The spectral transmi t tance of the nominal color
conversion filter thickness.
3. The nominal color conversion filter thickness.
4. The desired high-color temperature spectral power
distribution.
The mechanism of thickness determination was based upon a
least squares fit of distributions.
Routines within the program were written to calculate
the spectral transmi ttance per unit thickness of the color
conversion filter.
Programming
was effected to allow the18
calculated
internally
each time the routine was executed inorder to minimize calculation and rounding error. The
surface reflection of each air-glass interface was
mathematically subtracted before
determining
a fractionalthickness,
then mathematically replaced to avoid theintroduction of error.
Filter thickness was determined
by
changing filterthickness such that the least squares error between the
initial distribution filtered
by
a given filter thicknessand the desired distribution were minimized. Program flow
followed these steps:
1. Determine the product of the initial spectral power
distribution and the nominal filter thickness to obtain the
distribution of a filtered source.
2. Calculate the least squares error between the
filtered source and the desired spectral power distribution.
3.
Mathematically
increment the thickness of thefilter and determine the product of the new thickness and
the the initial spectral power distribution to obtain a new
f i 1 tered source.
4. Calculate the least squares error between the new
11
5.
Repeatedly
increment filterthickness,
determine anew filtered source, and calculate least squares error,
changing the thickness to move toward minimum least squares
error.
6. When thickness has been determined within the
precision of measurement, then record the thickness
specified and grind filter.
<see Appendix B for a
listing
of the computer program.)C. Construction and Measurement of Apparatus
To determine the practical application of the
algorithm, a
lamp
assembly was constructed to hold astandardized source and filter. A quartz tungsten-halogen
source rated at 1880 watts was clamped into a mounting
support. The assembly was fitted for optical bench mounting
to facilitate later measurements. A 8-126-Uolt variable
transformer was used to supply current to the source. The
voltage supplied to the bulb was regulated
by
a3.5 digit-precision digital volt meter which measured the
voltage
drop
across a precision 1.88 amp resistor todetermine the current drawn
by
the source. The source wascharacterized
by
measurement with the Munsel 1 Laboratory'sspectroradiometer . (see Appendix C)
A range of voltages was selected to yield color
12
ratio at 658 nm and 448 nm. Measurements were made at 5 nm
increments from 388 to 788 nm over the range of voltages.
These data were transferred to the Munsel 1 Color
Laboratory
computer which converted the data to absolute units and
allows extensive manipulation of the data.
Using
thissoftware, a series of plots and tables were generated which
display
the change in distribution with voltage. Thesespectral power distributions served as the low. color
temperature source for conversion to the daylight
i 1 1 urninants.
A color conversion filter of unit thickness was
obtained and measured for both spectral transmi ttance and
physical thickness. Spectral transmi ttance was measured
with the Diano
Hardy
spectrophotometer in the Munsel 1 ColorLaboratory. The unit uses a
double-beam,
dual -monochrometersystem and has a constant bandpass of 1 nm. Data was
sampled using a computer at 5 nm increments. Physical
thickness was measured on each of the filter's four corners
with a Starret constant-tension-ratchet micrometer.
Thickness was specified in fractions of an inch coincident
with the micrometer. Conversion to metric units was made
later. The precision of the micrometer was 8.88025 cm. The
measured spectral transmit tance and the physical thickness
of the filter were used as input to the spectral thickness
D. Determination of Filter Thicknesses for D55 and D3
Under ordinary
circumstances, the measured spectral power
distributions of the
lamp
would be used as the input to thespectral thickness routine as the low-color temperature
distribution. Planckian radiators were substituted in this
research since
they
correlatehighly
with low temperaturetungsten sources and are easier to manipulate. Also input
to the program were the spectral transmi ttance of the
color-conversion filter of unit
thickness,
the filter's measuredunit
thickness,
and the desired output distribution. BothD55 and D65 were used as desired output distributions.
To further improve the fit of the
distributions,
thetemperature of the input low temperature bl ackbody was
varied and the thickness for each temperature was
calculated. A combination of resultant least squares error
values, chromaticity coordinates, and visual goodness of fit
was used to select the best low temperature input. The
thicknesses specified were shipped to an optics firm for
grinding and polishing.
E. Test of Method
Ground filters were placed on the
lamp
housing
with thelamp
operating at the correct low color temperature.14
distribution and compared to the corresponding daylight
illuminants. Comparisons were made with respect to
closeness of chromaticities as well as closeness of
distributions. Supplemental correction filters were applied
in an attempt to better the Jegree of Illuminant simulation.
In addition, the goodness of fit of the modeled filtration
using the computer was checked to determine its validity in
15
III. RESULTS
A. Spectral
Thickness Determination
A method of spectral thickness determination was
developed to allow selection of optimum filter thickness to
achieve a specific resultant spectral distribution. The
following
table illustrates the thicknesses chosen tooptimize goodness of fit for the two illuminants simulated.
Table 1
Filter thickness shown in relation to input
and desired output.
Distributon Calculated
Temperature I CIE Illuminant I filter
of input source I simulated I thickness
2700 K I Illuminant D55 I .5748 cm
16
B. Simulation of CIE Illuminants D55 and D65
Upon calculation of filter
thickness,
the spectraldistribution of the input source attenuated
by
the giventhickness was mathematically predicted. The filters were
then ground, and the physical results were measured. The
following
six tables represent the spectral distribution ofeach of the two simulated
illuminants,
their computerpredicted simulators, and the physically realized
simulators.
Following
the tables are two graphs which17
TABLE 2
Spectral
Distribution
of CIE Illuminant D55CIE II luminant D55
380 nm > 32.58
385 nm > 35.34 390 nm > 38.09
395 nm > 49.52 488 nm > 68.95
405 nm > 64.75
410 nm > 68.55 415 nm > 78.87 428 nm > 71 .58 425 nm > 69.75
438 nm > 67.91
435 nm > 76.76
448 nm > 85.61 445 nm > 91
450 nm > 97.99 455 nm > 99.23
460 nm > 100.46
465 nm > 108. 19 478 nm > 99.91
475 nm > 18 1.33 488 nm > 182.74
485 nm > 100.41
490 nm > 98.08
495 nm > 99.38
588 nm --> 180.68
505 nm > 108.69
518 nm > 108.7
515 nm > 108.34
528 nm > 99.99
525 nm > 102. 1
530 nm > 104.21
535 nm > 103. 16 540 nm > 182. 1
545 nm > 102.53
558 nm > 182.97
555 nm > 181.48
568 nm > 188
565 nm > 98.61
578 nm > 97.22
575 nm > 97.48 588 nm > 97. 75 535 nm > 94.59 598 nm "_' 91.43 595 nm > 92.93
688 nm > 94.42 685 nm > 94.78
618 nm > 95. 14
615 nm > 94.68 620 nm > 94.22
625 nm > 92.33
638 nm > 98.45 635 nm > 91.39 640 nm > 92.33
645 nm > 98.59
650 nm > 88. 35 655 nm > 89.59 668 nm > 98.32
665 nm > 39.59
676 nm > 93.95 675 nm > 91.95
688 nm > 89.96
18
TABLE 3
Spectral
Distribution
of Computer Predicted D55 SimulatorComputer 386 nm 385 nm 398 nm 395 nm 486 nm 485 nm 410 nm 415 nm 420 nm 425 nm 430 nm 435 nm 440 nm 445 nm 450 nm 455 nm 460 nm 465 nm 470 nm 475 nm 480 nm 485 nm 490 nm 495 nm 500 nm 585 nm 510 nm 515 nm 528 nm 525 nm 530 nm Predi > 37. 48. 40. 51. 55. 61. 67. 78. 73. 73. 81. 88. 96. 79. 86. 86. 86. 86. 86. 86. 86. 86. 87. 87. 88. 89. 89. 89. 87. 87. 85.
cted D55 Simulator
TABLE 4
Spectral
Distribution
of Realized D55 Simulator19
Real ized D55 Simulator
380 nm > 25,.9067349
385 nm > 31,.6285806
390 nm --> 39,. 1443206
395 nm > 47,.210235
400 nm > 55,.08221
405 nm > 62,.8124069
410 nm > 69,.9884489
415 nm > 75,.2977545
420 nm > 78,.8914834
425 nm > 82,.8748782
430 nm --> 86,.3366946 435 nm > 88,.8797883 448 nm > 91,. 129887
445 nm > 93,.564389
458 nm > 96,. 1298561 455 nm > 91,.568356
468 nm --> 92,.723497
465 nm > 93,.2995399
470 nm > 92,.9428993
475 nm > 92,.4173823
488 nm > 91,.8936229
485 nm > 91,.7416864
498 nm > 91,.8348628 495 nm > 91,.7858865
500 nm --> 92,.2488201
505 nm > 92,.4251928
510 nm > 92,,0451484 515 nm > 91,.8240661
520 nm > 90,.6560988
525 nm > 89,.6290527
530 nm > 87,.5666011
26
TABLE 5
Spectral
Distribution
of CIE Illuminant D65CIE 1 1 1 uminant D65 386 nm > 49.9755 335 nm > 52.3118
396 nm --> 54.6482
395 nm > 68.7615
400 nm --> 82.7549
405 nm > 87. 1264
418 nm --> 91.486
415 nm > 92.4589
428 nm > 93.4313
425 nm > 96.857
438 nm > 86.6823
435 nm > 95.7736
446 nm > 184.865
445 nm > 118.936
456 nm > 117.008
455 nm > 117.41
468 nm > 117.812
465 nm > 116.337
478 nm > 114.861
475 nm --> 115.392 488 nm > 115.923
485 nm > 112.367
496 nm --> 108.811
495 nm > 109.883
566 nm --> 169.354
585 nm > 168.573
516 nm > 167.882
515 nm > 166.296
528 nm --> 184.79
525 nm > 186.24
538 nm --> 187.689
535 nm > 106.047
546 nm > 104.485
545 nm > 184.226
558 nm --> 184.646
555 nm > 182.623
568 nm --> 186
565 nm > 98. 1671
578 nm > 96.3342
575 nm > 96.8611
586 nm > 95.738
585 nm > 92.2368
598 nm > 88. 6856
595 nm > 89.3459
668 nm > 98.6662
A?5 nm > 89.8626
616 nm > 89.5991
615 nm > 33.6489
626 nm --> 87.6937
625 nm > 85. 4?C.
636 nm > 33.238668 1
635 nm > 83.4939
648 nm > 83.6992
645 nm > 81.863
656 nm > 88.8268
655 nm > 88. 1287862
669 nm > 80.214686 1
665 nm --> 81.246208 1
679 nm > 82.2773
675 nm > 38.231
680 nm > 73.2842
685 nm > 74.8627
21
TABLE 6
Spectral
Distribution
of Computer Predicted D65 SimulatorComputer 388 nm 385 nm 398 nm
-395 nm 466 nm 485 nm 418 nm 415 nm 426 nm 425 nm 438 nm 435 nm 448 nm 445 nm 456 nm 455 nm
468 nm
-465 nm 470 nm 475 nm 480 nm 485 nm 490 nm 495 nm 568 nm
585 nm
-518 nm 515 nm 526 nm 525 nm 538 nm Predicted D65 > 45.5862594 > 55.3848617 > 53.989844 > 71.9144812 > 80.7964205 > 96.5488617
> 97. 138112
> 10 1.686555
> 105.60558
> 10 1.09589
-> 112.002605 > 114.558679 > 111.624044 > 109.396388 > 114.942145 > 112.143272 > 111.111484 > 110.58677 > 109.210874 > 107.239887 > 106.704534 > 105.48314 > 105.609649 > 107.349124
> 105.66750 1
> 101.521707 > 99.8359026 > 98.9171564 > 96.5445424 > 94.5546751 > 91.2857572
Simul ator 535 nm > 89.7927364
540 nm > 38.5397171 545 nm > 38.4878969
550 nm > 98.7589411
555 nm > 95.4428867
560 nm > 186
565 nm > 163.823843
570 nm > 184.896968 575 nm > 182.477853 580 nm > 97.5514334
585 nm > 98.3291185
598 nm > 84.3345284
595 nm > 88.9276384
668 nm > 86.7852253
685 nm > 88.8730526
618 nm --> 81.7223756
615 nm > 79.2537848
626 nm > 73.8721739
625 nm > 77.28 15468
638 nm > 73.7821761
635 nm > 78.7179322
646 nm > 67.564693
645 nm > 65.4199774
656 nm > 64.635128
655 nm > 65.6375345
666 nm > 67.3726928
665 nm --> 76.2832938
678 nm > 74.6016132
675 nm > 79.5081216
638 nm > 84. 2593965
685 nm > 38.5076316
TABLE 7
Spectral
Distribution
of Realized D65 SimulatorReal ized D65 Simulator
380 nm > 52.7322108
385 nm > 57.9467681
396 nm > 58.5985878
395 nm > 75.9152634
460 nm > 81.0646339
405 nm > 89.6360675
410 nm > 94.7419884
415
nm-> 101.857686
420 nm > 110.395124
425 nm > 115.35142
430 nm > 109.878472
435 nm > 106.896729
440 nm > 105.779468
445 nm > 106.485606
450 nm --> 105.898968
455 nm > 103. 183053
460 nm > 109.277567
465 nm > 107.908745 470 nm > 107.398153
475 nm > 106.518197
480 nm --> 105.301467
485 nm > 103.921782
490 nm > 103.041825
495 nm > 102.476915
500 nm > 102.205323
505 nm > 100.575774
510 nm > 100. 184682
515 nm > 99.3481804
520 nm > 97.9467682
525 nm > 95.9152635
530 nm > 92.7213472
535 nm > 91.2982878 540 nm > 39.4137942
545 nm > 96.2689778 550 nm > 92.3411191
555 nm > 95.7414451
560 nm > 188
565 nm > 103.671913 576 nm > 104.74742
575 nm > 103. 161325
586 nm > 99. 1743618
585 nm --> 93. 1667572
596 nm > 87.0722434
595 nm > 83.6827811
666 nm > 82.4443239
685 nm > 82.0966367
616 nm > 82.0423633
615 nm > 80.90 16839
626 nm > 80.0434547
625 nm > 76.252037
638 nm > 74.0032592
635 nm > 7 1. 2330256
648 nm > 68.3107009
645 nm > 66.3226503
658 nm > 65.7686041
655 nm > 66.5942423
666 nm > 68.7669745
665 nm > 72.6670289
678 nm --> 77.4796306
675 nm > 82.8028247
686 nm --> 87.9522
685 nm > 91.8087997
23
E
CD c
0) a
i_
0
3
E
0)
N
Oi
DC
I
TJ lb
c
c.
o
3 E
0)
m
c
iX
I c
Hi Oi
c.
on
in in a
c
c
E 3
Ui
o I dl
3
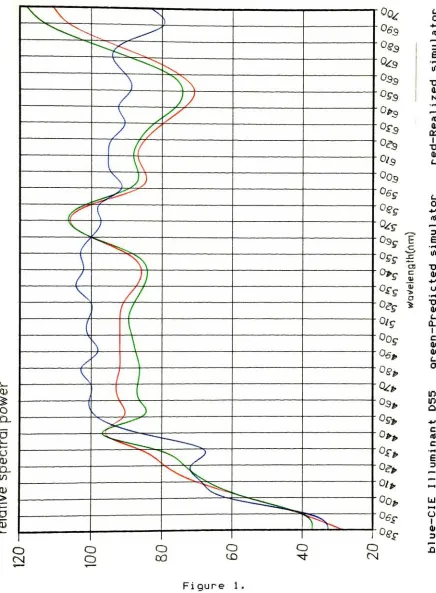
Figure 1.
Relative spectral characteristics of CIE Illuminant D55 and
[image:32.516.45.481.50.643.2]24
L.
o
3
E
XI
Oi
n
<0
<D
I
X)
c
o
?J nf
3
E
XJ
XJ
Oi t,
CL I
c Oi
Oi
L. cn
in
a
c
c
E
3
U **
o I
Oi 3
Fioure 2,
Relative spectral characteristics of CIE Illuminant D65 and
25
.36-
.34-
V.32-
.30-CIE
1 960
u,vchromaticity
diagram
D55/
Predicted ".RealizedD65'^
? Realized
'
Predicted
.20 .22 .24
U
.26 .28
Dotted line is daylight locus.
Solid line is
blackbody
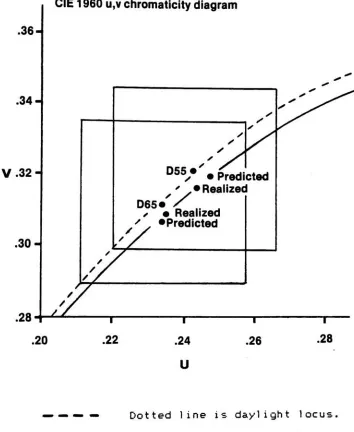
locus.Figure 3
UCS Chromaticities of
and Real ized Simulator
[image:34.516.68.422.62.494.2]26
The first order test of the goodness of a simulator is
a plot of the chromatici t ies of the simulator with those of
the
Illuminant.
Figure 3 is a plot of the two illuminantssimulated, CIE Illuminants D55 and D65 in Uniform Color
Space <UCS) . Plotted next to each illuminant are the
predicted simulators and the realized simulators. A square
around each of the Illuminants represents the first order
limit for chromati ci tes of each simulator. The allowable
range for both the u and v coordinates is +Z-0.0225. CI13
Table 9 contains the tabularized chromaticities which
compose the plot.
Table 8
UCS Chromatid ties of CIE Illuminants and Computer
Predicted and Realized Simulators
Spectral Distribution: u =
v =
CIE Illuminant D55 0.2429 0.3205
Computer Predicted D55 Simulator 0.2478 8.3199
Realized D55 Simulator 8.2439 8.3169
Realized D55 Simulator with CC85G 8.2412 0.4800
CIE Illuminant D65 0.2348 0.3122
Computer Predicted D65 Simulator 0.2339 0.3675
Real ized D65 Simulator 6.2358 6.3695
The degree of similarity between the spectral results
achieved was calculated using mean square deviation.
Comparisons were made between each CIE Illuminant and its
predicted and realized simulator. Comparisons were also
made between the predicted simulators and the realized
simulators, to assess the validity of the prediction.
Table 9
Mean Square Deviation between Spectral Distributions
for CIE Illuminant D55.
Mean Square Deviation between: v'al ue:
Illuminant D55 and Computer Predicted Simulator 12.57
Illuminant D55 and Realized Simulator 11.89
28
Table 18
Mean Square Deviation between Spectral Distributions
for CIE Illuminant D65.
Mean Square Deviation between: v"al ue:
Illuminant D65 and Computer Predicted Simulator 18.71
Illuminant D65 and Realized Simulator 11.33
29
IV. DISCUSSION
The initial selection of the source for the low-color
temperature input was a 18-Watt tungsten-halogen bulb.
Although this source fitted the spectral profile desired for
the system, its power output was not adequate. The response
of the Munsel 1 Color
Laboratory
spectroradiometer was notconstant with with a change in the decade scale of the
spectroradiometer's ammeter. To solve the problem, a
General Electric 1880-Watt tungsten-halogen bulb was used.
The spectral power distribution was still of the correct
profile, and the increased power resultant allowed for
excellent spectroradiometer constancy. No perceptable
flucuations appeared as a result of ammeter decade changes.
Planck's equation was used to generate low-color
temperature distributions to be input to thickness
determination routines. This method was chosen instead of
making a series of measurements of the tungsten-halogen
source supplied with incremented current values. This was
not only more convenient than successive measurements but
preserved the tungsten filament and allowed a spectral input
free of measurement irregularities. If measured spectral
data were used as
input,
any irregularities in measurementwould be reflected as irregularities in the thickness of
30
The use of Planck's Equation was followed
by
acharacterization of the tungsten-halogen source.
By
varyingthe current supplied to the
source, the shape of the
tungsten-halogen
source could be changed to fit the shape ofthe Planckian distribution. This method worked extremely
well for the low color temperatures needed for input.
Nithin the spectral thickness determination routine is
the subtraction of surface reflection. Since the filter
when ground to any thickness still has two surfaces, each
with some surface reflection, some non-linearity could exist
in the system. The problem is seemingly complicated
by
thefact that the surface reflection from the second air-glass
interface is also a function of the spectral transmi ttance
of the filter. After
determining
the amount of changeinduced
by
the spectral transmi ttance of thefilter,
it wasdetermined that the surface reflection could be subtracted
out
by
removing 8'/. of the transmi ttance before applying afactor to the filter
thickness,
and later replacing the &'/.to predict the resultant filtered distribution. The error
induced
by
this small assumption was unmeasurable and had noeffect on either thickness specification nor prediction of
output distribution.
The spectral method for
determining
the colorconversion filter thickness was applied to simulation of CIE
Daylight Illuminants D55 and D65. The CIE (Commission
31
but the
Illuminants
D55 and D65 were used for this worksince
they
are within the usefulworking range of the color
conversion filter and are commonly used Illuminants in the
laboratory. The same methods used in this thesis could be
applied to any CIE Illuminant with appropriate filtration
and light source.
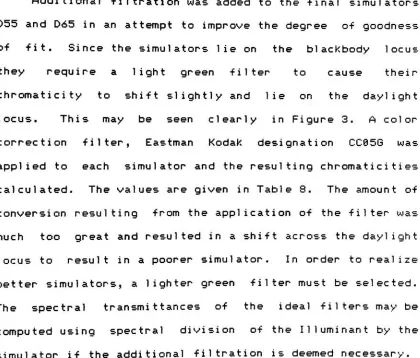
Additional filtration was added to the final simulators
D55 and D65 in an attempt to improve the degree of goodness
of fit. Since the simulators lie on the bl ackbody locus
they
require a light green filter to cause theirchromaticity to shift slightly and lie on the daylight
locus. This may be seen clearly in Figure 3. A color
correction
filter,
Eastman Kodak designation CC05G wasapplied to each simulator and the resulting chromatidties
calculated. The values are given in Table 3. The amount of
conversion resulting from the application of the filter was
much too great and resulted in a shift across the daylight
locus to result in a poorer simulator. In order to realize
better simulators, a lighter green filter must be selected.
The spectral transmi ttances of the ideal filters may be
computed using spectral division of the Illuminant
by
the [image:40.516.51.471.224.582.2]32
V.
CONCLUSIONS
The devised method of spectral determination of color
conversion filter thickness is effective. It requires the
following
three input parameters:1. The spectral distribution of a low-color temperature
source.
2. The spectral transmi ttance of the filter at unit
thickness.
3. The spectral power distribution of the desired
1 1 1 uminant .
Using
only these parameters, the spectral method willallow specification of the correct filter thickness. It
will also predict the distribution which will result from
applying that thickness to the low-temperature tungsten
source.
The precision of the prediction of the spectral
distribution is as good as the precision of the input
information. No assumptions are made regarding the
linearity
of the filter's spectral transmi ttance as is donewith the simplified equations currently recommended for
color conversion filter thickness determination.
The method may be used to allow simulation of
any-desired distribution. The same three input parameters are
required in all cases. The ability of an input distribution
33
upon the shapes of each input distribution. The simulators
created to model the CIE Illuminants D55 and D65 for this
thesis showed acceptable goodness of fit for Illuminant
simulators. This is due to the fact that each simulator was
the result of only one input distribution and one filter of
some given thickness.
The spectral method has limitations because it allows
optimization of only one system parameter,
thickness,
whileall other parameters must remain constant. This limitation
leaves room for further work.
Programming
could be writtenwhich would allow simultaneous optimization of several
parameters to simulate a distribution. This would allow
simulation of a distribution using multiple filters and
34
VI .
REFERENCES
E13 Kodak Filters for Scientific and Technical Uses Kodak
Publication
B-3,
Rochester,
NY,
1978,
p. 33.E23
Wyszecki,
G.,
Stiles,
W. S. , Color Science. JohnWiley
andSons,
Inc., NY, NY,
1967,
p. 164.E33
Corning
Color FilterGlasses,
Corning
GlassWorks,
Industrial Materials
Department,
Corning, NY,
1982,
p. 32.
E43
Grum,
F.,
Bartleson,
C.J.,
Optical RadiationMeasurements. Vol 2.. Academic
Press, NY, NY,
1980,
p. 150.[53
Wyszecki,
G. , p. 14.E63
Grum,
F.,
et al p. 180.E73
Grum,
F.,
Saunders,
S. ,Wightman,
T. , "Artificial LightSources to Simulate Illuminant D"
, TAPPI . 53. 7 < 1978) .
[83
Robertson,
A.R.,
"Computation of Correlated Color Temprature and DistributionTemperature",
J.Q.S.A. .58,
11 (1968).E93
Wyszecki,
G. , "Deve 1opment of New CIE Standard Sources
for Colorimetry"
, Die Farbe. 19. 1/6 < 1970) .
E 18D
Schanda,
J. et al ."Calculating
Correlated ColorTemperature with a
Desktop
ProgrammableCalculator",
Color Res. Appl . .
3,
65 < 1968) .E113 CIE TC-1.3 Standard Sources
Subcommittee,
"A Method forAssessing
theQuality
of Daylight Simulators for35
VII .
APPENDIX
AListinos
ofSupporting
Softwar;Menu program and file
display
and correction prograrram188 HIMEM: 38488
116 DIM VIEW<108): DIM A< 188) : DIM B< 186)
128 D* = CHR* <4) :0* = DS + "GPEN":R* = D* + "READ":W* = D* +
"WRITE"
:C$ = D* + "CLOSE" :V* = D* + "VERIFY"
138 PRINT
D*;
"PRH3"148 TEXT : HOME
158 ANS* = H U
168 PRINT "INPUT DESIRED FUNCTION"
178 PRINT : PRINT "E DATA ENTRY"
186 PRINT "V VIEW AND CORRECT DATA"
190 PRINT "P PLOT CURVES"
195 PRINT "2 PLOT TO PRESENT"
286 PRINT "M MATHEMATICAL CURVES OPERATIONS"
218 PRINT "K CONSTANT OPERATIONS ON CURVES"
228 PRINT "S SPECTRAL THICKNESS DETERMINATION"
225 PRINT "A AUTOMATIC SPECTRAL THICKNESS DETERMIN
226 PRINT "D DEVIATION, MEAN-SQUARE
"
236 PRINT 1 DI STR I BUT I ON TEMPERATURE
"
248 PRINT "
B PLANCKIAN BLACKBODY CURVES"
245 PRINT CALCULATE CHROMATICITY"
258 PRINT "N NORMALIZE SPECTRAL DISTRIBUTION"
266 PRINT i SMOOTH
DATA"
278 PRINT "G CONVERT: TRANS S<: DENSTIY"
230 PRINT "W CORRECT WAVELENGTH SCALING"
298 PRINT "0 LOG SPECTRAL POWER DISTRIBUTION"
300 PRINT "? CATALOG"
318 PRINT "L LIST"
320 PRINT "Q QUIT"
338 GET ANS*
346 PRINT
36
416 T = HW: INPUT
HW: IF T <
426 T = WI : INPUT WI
: IF T < 430
440
450
460 470
> HW THEN END
> WI THEN END
FOR ARG = 1 TO PTS
INPUT CRT < ARG) NEXT ARG
PRINT C*;CRT*
VTAB 6: PRINT "CORNING FILE: ";CRT*;U
HAS BEEN INPUT,
INPUT "EQ TO
QUIT,
C TO CATALOG]: ";CIE* 480 STHICK =.2294
490 VTAB 3: PRINT "INPUT FILNAME FOR CIE DISTRIBUTION COMPARA
TOR" 500 510 520 530 540 550
IF CIE* = "Q" THEN
IF CIE* = "C" THEN
PRINT V*;CIE*
PRINT 0*;CIE*
PRINT R*;CIE*
PRINT D*;"RUN SPECTRAL"
GOSUB 890: GOTO 310
> PTS THEN END
> LW THEN END
> HW THEN END
> WI THEN END
;CIE*;" HAS BEEN INPUT
IN, POKE 36,38: PRINT 560 T = PTS: INPUT PTS: IF T <
570 T = LW: INPUT LW: IF T <
580 T = HW: INPUT HW: IF T (
590 T = WI : INPUT WI : IF T (
600 FOR ARG = 1 TO PTS
610 INPUT CIE(ARG)
620 NEXT ARG
630 PRINT C*;CIE*
640 i/TAB 9: PRINT "CIE FILE:
650 THICK = STHICK: INC = -.05
730 GOSUB 940
740 GOSUB 968
758 GOSUB 958
755 PRINT "THICKNESS= "jTHICKj"
LEAST SQUARES ERROR= "
;LSE
388 GOSUB 1688: REM AUTO THICKNESS ROUTINc
325 OLD = LSE
358 GOTO 738
886 END : REM
****** SUBOUTINES ******
896 PRINT
D*;
"CATALOG": PRINT "HIT ANY KEY TOCONTINUE;
A*: RETURN_ ,.-, -
-^ = ,
-900 REM NORMALIZATION OF FSOURCE AND CIE TO law AT 5atf
910 W560 = (566
-LW) / WI
'20 Tl = FSQURCE(W568) :T2 = CIE(W568)
930 FOR ARG = 1 TO PTS: FSOURCE (ARG) = FSOURCE (ARG) * 186
:CIE(ARG) = CIE(ARG) * 188 / T2: NEXT : RETURN 946 FOR ARG = 1 TO PTS:FSOURCE(ARG)
= SOURCE(ARG) *
^4294 * LOG (CRT(ARG) * .315) * (THICK / STHICK))
GET
18 '
NEXT
(( .4
37 358 368 378 380 389 390 395 400 410 C3" ; 420 430 435 440 450 460 465 470 480 490 500 510 520 530 548 E?" 558 568 578 588 596 680 618 626 638 646 658 669 670 680 690 700 718 720 IF IF IF IF IF IF IF IF IF ANS* ANS* ANS* ANS* ANS* ANS* ANS* ANS* ANS* "M" K" "Q" y u pa "D"
n i n
iiou
THEN THEN THEN THEN THEN THEN THEN THEN THEN PRINT PRINT END 950 PRINT PRINT PRINT LIST ! PRINT D* ;"
RUN D*;"RUN OPERATE" CONSTANT" D*"RUN D*"RUN D*"RUN END
D* ;"
CATALOG PLOTTER"
PL0T2PRESENT MEAN"
PRINT "CONTINUE GET A*: PRINT : IF A* = "C" THEN PRINT D*;"RUN SPECTRAL"
IF IF IF IF IF IF IF IF IF IF IF GOTO REM ANS* = ANS* = ANS* = ANS* = ANS* -ANS* = ANS* = ANS* -ANS* = ANS* = ANS* = 120 DATA "B" "S" "A" "N" n pn "W" "C" "G" II QH
nr*u
"H" THEN THEN THEN THEN THEN THEN THEN THEN THEN THEN THEN PRINT PRINT PRINT PRINT PRINT PRINT PRINT PRINT PRINT 520 HOME D*"RUN D*"RUN D*"RUN D*"RUN D*"RUN D*"RUN D*RUN D*"RUN D*"RUN
: GET G*
BBODY" THICK" AUTOTHICK" NORM" SMOOTH" SCALE" CHROMA" DENSI" LOG-ENTRY HOME
PRINT IS A WAVELENGTH RANGE FROM 330 TO 738 NM ACCEPTAB1
= 780 688 " ;LOWAV " ;HIWAV INCREMENT LOWAV = 388: HI WAV
GET ANS*
IF ANS* < > "N"
THEN
INPUT "LOW WAVELENGTH:
INPUT "HIGH WAVELENGTH
PRINT "IS A WAVELENGTH
WAVI = 5
GET ANS*
IF ANS* < > "N"
THEN 658
INPUT "WAVELENGTH INCREMENT:
PTS = (HIWAV - LOWAV) / WAVI +
IF pTs = INT (PTS) THEN 786
HOME
PLEASE PICK WAVELENGTHS AND
ARE EVENLY DIVISIBLE": GOTO
COMMENCE DATA ENTRY"
= 1 TO PTS
OF 5 NM ACCEPTABLE?"
;WAVI 1 PRINT PRINT PRINT FOR ARG INCREMENTS WHICH 543 PRINT
W = LOWAV + (WAVI * (ARG
38
738 PRINT
"WAVELENGTH
=";W;
748 INPUT "RAD. EXCIT. = " ;A(ARG)
758 NEXT ARG 768 HOME
770 PRINT "DATA ENTRY IS COMPLETE."
780 PRINT : PRINT
790 INPUT "INPUT DATA FILE NAME E Q TO QUIT 3: ";FILNAM*
800 IF FILNAM* = "Q"
THEN 140 810 PRINT
0*;
FILNAM*320 PRINT
W*;
FILNAM*330 PRINT PTS
840 PRINT LOWAV
850 PRINT HIWAV
360 PRINT WAV I
370 FOR ARG = 1 TO PTS
880 PRINT A(ARG)
390 NEXT ARG
900 PRINT
C*;
FILNAM*910 HOME : PRINT "DATA HAS NOW BEEN SAVED"
920 PRINT "UNDER FILENAME: ";FILNAM*
930 FOR T = 1 TO 300: NEXT T
940 GOTO 140
950 REM VIEW DATA
969 HOME : PRINT "PLEASE INPUT THE NAME OF THE DATA FILE"
970 PRINT "THAT YOU WISH TO VIEW"
930 PRINT "EC TO CATALOG]"
990 INPUT "EQ TO QUIT]
";
FILNAM*1000 IF FILNAM* = "C" THEN PRINT D*;"CATALOG"
: PRINT "HIT AN
Y KEY": GET A*: GOTO 969
10 10 IF FILNAM* = "Q" THEN 140
1015 PRINT V*;FILNAM*
1028 PRINT
0*;
FILNAM*1830 PRINT
R*;
FILNAM*1040 INPUT PTS
1050 INPUT LOWAV
1060 INPUT HIWAV
1070 INPUT WAVI
1688 FOR ARG = 1 TO PTS
1890 INPUT VIEW(ARG)
1100 NEXT ARG
1110 PRINT
C*;
FILNAM*1128 HOME
1130 PRINT "FILENAME: ";FILNAM*: PRINT 1140 PRINT "THE FILE CONTAINS " ;PTS ; " DATA
POINTS."
1150 PRINT "THE WAVELENGTH RANGE IS:"
1168 PRINT LOWAV;" TO
";
HIWAV;" NM, "1178 PRINT "IN INCREMENTS OF "jWAVI;" NM.
"
1188 FOR ER = 1 TO 2868: NEXT tR
1198 FOR ARG = 1 TO PTS
39
1218 PRINT "WAVELENGTH=" ;W;"nm"
; 1228 PRINT "
OUTPUT=";VIEW(ARG)
1230 NEXT ARG
1240 IF ANS* = "P" THEN PR#
6
1258 PRINT : PRINT "WANT TO SEE THAT AGAIN??"
1268 PRINT "EY FOR SCREEN] EP FOR PRINTER]"
1270 PRINT "CONTROL-S TO STOP AND START"
1280 GET ANS*
1290 IF ANS* = "Y" THEN 1128
1380 IF ANS* = "P"
THEN PR# 1: PRINT CHR* (9);"80N": GOTO 1 138
1310 PRINT "DO YOU WISH TO CORRECT ANY OF"
1320 PRINT "THESE DATA??"
1330 GET ANS*
1340 IF ANS* = "N" THEN 140
1350 REM CORRECT DATA LISTING
1360 HOME
1370 PRINT "DATA CORRECTION"
1380 PRINT "YOU MAY CHANGE THE VALUE OF RADIANT"
1390 PRINT "EXCITANCE FOR ANY WAVELENGTH VALUE"
1408 INPUT "PLEASE INPUT THE WAVELENGTH: "
;W
1410 IF W ( LOWAV OR W > HIWAV THEN 1400
1420 ARG = ((W
-LOWAV) / WAVI) + 1
1430 PRINT "WAVELENGTH = "
;W; 1440 INPUT "
RAD. EXCIT. = ";VIEW(ARG)
1450 PRINT "ANOTHER CORRECTION??"
1460 GET ANS*
1470 IF ANS* = "Y" THEN 1408
1488 HOME
1498 PRINT "PLEASE INPUT THE FILE NAME "
1588 INPUT "E Q TO QUIT ] ";FILNAM*
1510 IF FILNAM* = "Q" THEN 148
1528 PRINT
0*;
FILNAM*1538 PRINT
W*;
FILNAM*1548 PRINT PTS
1558 PRINT LOWAV
1568 PRINT HIWAV
1578 PRINT WAVI
1588 FOR ARG = 1 TO PTS
1590 PRINT VIEW(ARG)
1600 NEXT ARG
1618 PRINT C*;FILNAM*
48
Plotting
program withhardcopy
graphicsdump
2 HIMEM: 8192: CLEAR :D* = CHR* (4)
4 DIM A<7,95): DIM PTS(7) : DIM LOWAV ( 7) : DIM HIWAV(7) : DIM WA
VI <7) : DIM FL*<7)
6 HOME : PRINT "NUMBER OF FILES TO BE PLOTTED:": PRINT "INPUT
8 FOR CATALOG "
8 PRINT "INPUT 8 TO QUIT ";: GET T: PRINT
18 IF T > 7 THEN PRINT D*;"CATALOG"
: PRINT "HIT ANY KEY": GET
A*: GOTO 6
12 IF T = 0 THEN PRINT D*;"RUN SPECTRAL"
14 HOME : PRINT "ENTER NAMES OF THE ";T;"
FILES TO BE PLOTTED
n
16 FOR I = 1 TO T
18 PRINT "FILE # "
; I 8 . INPUT " =
";FL*(D
20 NEXT I
22 FOR I = 1 TO T
23 PRINT D*"VERIFY"
;FL*(I)
24 PRINT D*"OPEN"
;FL*(I)
26 PRINT D*"READ"
;FL*(I)
28 INPUT PTS(I): INPUT LOWAV(I): INPUT HIWAV(I): INPUT WAVI ( I )
30 FOR ARG = 1 TO PTS(I)
32 INPUT A(I ,ARG)
34 IF MAX < A(I,ARG) THEN MAX = A(I,ARG)
36 NEXT ARG
38 PRINT D*"CLOSE" ;FL*(I>
40 NEXT I
42 IF T = 1 THEN 64
44 FOR I = 2 TO T
46 IF PTS(I
-1) = PTS(I) AND LOWAV(I
-1) = LOWAV(I) AND HIW
AV(I
-1) = HIWAV(I) THEN 69
48 NG = 1
50 PRINT "FILES ";I
-I ; " AND ";I;" HAVE: "
iikimiia, h ncr B
52 IF PTS(I
-1) < > PTS(I) THEN PRINT "
UNEQUAL # OF P
VJ^Tf
LOWAVd-1) < > LOWAV(I) THEN PRINT " UNEQUAL LO
56W^FLHl'wAVa - D < > HIWAV(I) THEN PRINT UNEQUAL HI
58
TSmS-
1) < > WAVI (I) THEN PRINT " UNEQUAL WAVELENGHT INCS."
62 If'nG =
'SmTHEN
PRINT "RETURNING TO MENU":: PRINT D* ;"
RUN
64ECPR?NT ' PRINT "SCALE GRAPH TO WHAT
'Y' VALUE?"
66 PRIrrT "MAXIMUM Y VALUE IS ";MAX: PRINT "IS THIS OK?";: GET
41
68 IF A* < > "N"
THEN 72 70 INPUT "NEW VALUE: "
;MAX
72 HGR
74 HPLOT 0,5 TO 0,159: HPLOT 0,159 TO 279,159
76 FOR I = 1 TO T
78 FOR ARG = 1 TO
PTS( 1)
30 HPLOT INT ((279 / PTS( 1) ) *
ARG),
INT (159-(A(I,ARG) *
159 / MAX))
82 NEXT ARG
34 NEXT I
36 VTAB (22): PRINT "HARDCOPY OUTPUT? EY/N]";: GET ANS*: IF A
NS* < > "N"
THEN 90
88 PRINT : PRINT D*;"RUN SPECTRAL"
90 HIMEM: 38400: PR# 1: PRINT CHR*
(27);
CHR* (102): FOR S =1 TO 5: PRINT CHR* (10): NEXT S
92 PRINT CHR* (9);"GD"
94 PRINT CHR*
(27);
CHR* (114): FOR S = 1 TO 3: PRINT CHR*(10): NEXT S: PRINT CHR*
(27);
CHR* (102)96 PRINT " 0"
98 PRINT "
";LOWAV(D;: PRINT "
Wave!
ength in nm"
; : POKE 36,72: PRINT HIWAV( 1)
100 PRINT CHR*
(27);
CHR* (114): FOR S = 1 TO 14: PRINT CHR*(10): NEXT S: PRINT CHR*
(27);
CHR* (102)102 PRINT " " ;MAX
164 FOR S = 1 TO 14: PRINT CHR* (10): NEXT S
106 FOR I = 1 TO T
108 POKE 36,20: PRINT "FILE "
;I 5" = ";FL*(D
110 NEXT I
112 POKE 36,20: PRINT "WAVELENGTH RANGE: ";LOWAV(D;"
TO ";HI
WAV( 1) ;" nm"
114 POKE 36,20: PRINT "WAVELENGTH INCREMENT: " ;WAVI(1);" nm"
116 FOR S = 1 TO 11: PRINT CHR* (10): NEXT S: PRtt 8
42
Mathematical file operation program
108 DIM A< 108) : DIM B< 188) : DIM P< 180)
110 D* = CHR* <4)
128 HOME : PRINT : PRINT "PLEASE
138 PRINT "
TO BE OPERATED ON EQ "
;WUN*
INPUT FILENAMES OF FILES'
TO QUIT]: ": INPUT "FILE
148 158 168 178 188 248 198 200 210 40 220 230 240 250 260 270 280 298 380 310 320 330 340 350 360 370 380 390 400
IF WUN* = "Q" THEN PRINT D*;"RUN SPECTRAL"
INPUT "FILE 2: "
;TWO*
PRINT "PLEASE INPUT OPERATION EM,D,A,S]:
";
GET OPERA*
IF OPERA* = "M" THEN PRINT : PRINT "MULTIPLICATION": GOTO
IF IF IF OPERA* = OPERA* = OPERA* -D" 'A1 S" THEN THEN THEN
IF OPERA* = CHR*
VTAB 3: GOTO 170
PRINT D*"OPEN" ;WUN* READ" ;WUN* PRINT INPUT INPUT INPUT INPUT PW D*' PW LW HW WW
FOR ARG = 1 TO
INPUT A(ARG>
NEXT ARG
PRINT D*"
CLOSE
";
WUN* D*"OPEN" ;TWO* D*"READ" ;TWO* PT PRINT PRINT INPUT INPUT INPUT INPUT LT HT WT PRINT PRINT PRINT PRINT PRINT PRINT "DIVISION" "ADDITION" GOTO GOTO 248 248"SUBTRACTION": GOTO 2
(3) THEN END
43 410 428 438 448 458 466 470 480 490 500 510 520 530 540 550 560 570 580 590 688 616 620 630 640 650 669 678 688 INPUT B<ARG) NEXT ARG
PRINT D*"CLOSE"
; TWO*
IF PT = PW AND LT = LW AND HT = HW AND WT = WW THEN 568
IF PT < > PW THEN PRINT "NUMBER OF POINTS NOT EQUAL"
IF LT < > LW THEN PRINT "LOW WAVELENGTHS NOT EQUAL"
IF HT < > HW THEN PRINT "HIGH WAVELENGTHS NOT EQUAL"
IF WT < > WW THEN PRINT "WAVELENGTH INCS. NOT EQUAL"
FOR T = 1 TO 986: NEXT T: GOTO 116
PRINT "INPUT FILE NAME FOR THE RESULTING"
INPUT "DATA: "
;THR* PRINT D*"OPEN" ;THR* PRINT D*"WRITE" ;THR* PRINT PW PRINT LW PRINT HW PRINT WW
FOR ARG = 1 TO PW
IF OPERA*
IF OPERA*
IF OPERA*
IF OPERA*
NEXT ARG
PRINT D*"
CLOSE"
;THR*
HOME : PRINT "THE DATA HAVE BEEN
SAVED"
PRINT "UNDER FILENAME: " ;THR* FOR T = 1 TO 1686: NEXT T
PRINT D*;"RUN SPECTRAL" "M" THEN "D" THEN "A" THEN "S" THEN
PRINT A (ARG)
PRINT A(ARG)
PRINT A(ARG)
44
Constant file operations program
100 DIM M( 180)
118 HOME :D* = CHR* (4)
128 PRINT : PRINT "
OPERATIONS WITH A CONSTANT "
138 INPUT "INPUT CONSTANT: ";CNST
148 PRINT "INPUT OPERATION EM,D,A,S] :" ; : GET OPERA*
150 PRINT : PRINT "INPUT DATA FILE NAME"
160 INPUT "E Q TO QUIT 3:
";
FILNAM*178 IF FILNAM* = "Q" THEN PRINT
: PRINT D*;"RUN SPECTRAL"
130 PRINT : PRINT "INPUT NEW FILENAME FOR THE MODIFIED"
190 INPUT "DATA: ";FLNAM* 200 PRINT D*"OPEN"
;FILNAM*
216 PRINT D*" READ"
; FILNAM*
220 INPUT PTS
238 INPUT LW
240 INPUT HW
250 INPUT WI
260 FOR ARG = 1 TO PTS
278 INPUT M<ARG)
280 NEXT ARG
290 PRINT D*" CLOSE"
; FLNAM* 300 PRINT D*" OPEN"
;FLNAM* 310 PRINT D*"WRITE"
;FLNAM*
320 PRINT PTS
330 PRINT LW
340 PRINT HW
350 PRINT WI
368 FOR ARG = 1 TO PTS
378 IF OPERA* = "M" THEN PRINT M(ARG) * ON ST
380 IF OPERA* = "D" THEN PRINT M(ARG) / CNST
398 IF OPERA* = "A" THEN PRINT M(ARG) + CNST
486 IF OPERA* = "S" THEN PRINT M(ARG) - CNST
418 NEXT ARG
426 HOME : PRINT "DATA HAS NOW BEEN SAVED"
430 PRINT "UNDER FILENAME:
";
FLNAM*440 FOR T = 1 TO 1888: NEXT T
450 PRINT : PRINT D*;"RUN
45
Mean Square Deviation program
180 DIM A< 100) : DIM B< 100)
110 D* = CHR* (4)
120 HOME : PRINT : PRINT "PLEASE
138 PRINT "
TO BE OPERATED ON EQ
NT DISTRIBUTION: "
;WUN*
INPUT FILENAMES OF
TO QUIT] : " : INPUT
FILES" "ILLUMINA 148 158 155 160 170 190 200 205 210 220 230 240 258 260 270 280 290 300 310 320 330 340 350 360 370 380 390 400
IF WUN* = "Q" THEN PRINT D*;"RUN SPECTRAL"
INPUT "SIMULATING DISTRIBUTION: "
;TWO*
PRINT "OUTPUT TO PRINTER?? EY/N] : ";: GET P*
GOSUB 200
GOSUB 490
END
REM DISK READING SUBROUTINE
D*;
"VERIFY" ;WUN*D*"OPEN" ;WUN* D*"READ" ;WUN* PRINT PRINT PRINT INPUT INPUT INPUT INPUT PW LW HW WW
FOR ARG = 1 TO PW
INPUT A(ARG)
NEXT ARG
PRINT D*" CLOSE"
;WUN*
D*;
"VERIFY" ;WUN*D*"OPEN" ;TWO* 'READ" ;TWO* PRINT PRINT PRINT INPUT INPUT INPUT INPUT D** PT LT HT WT
FOR ARG = 1 TO PT
46
410 NEXT ARG
420 PRINT D*"CLOSE"
; TWO*
430 IF PT = PW AND LT = LW AND HT = HW AND WT = WW THEN RETURN
440 450 460 470 480 490 494 495 500 510 520 530 540 550 555 556 557 568 578 588 598 688 618
628 621 636
IF PT < > PW THEN PRINT "NUMBER OF POINTS NOT EQUAL"
IF LT < > LW THEN PRINT "LOW WAVELENGTHS NOT EQUAL" IF HT < > HW THEN PRINT "HIGH WAVELENGTHS NOT EQUAL" IF WT < > WW THEN PRINT "WAVELENGTH INCS. NOT EQUAL" FOR T = 1 TO 980: NEXT T: GOTO 110
REM MEAN-SQUARE ROUTINE HOME
IF P* = "Y" THEN PRINT D*;"PR#1": PRINT
PRINT : PRINT "MEAN-SQUARE DEVIATION "
F = . :NU = . :DE = .: REM INIT TO ZERO
FOR ARG = 1 TO PT
NU = NU + B(ARG) * A(ARG) :DE = DE + B(ARG) NEXT
F = NU / DE
CHR* (9) ;"38N"
: PRINT "ILLUMINANT FILE; SIMULATOR FILE: "
;TWO*
(B(ARG) * F)) PRINT
PRINT PRINT D =
. : REM INIT D TO ZERO
FOR ARG = 1 TO PT
D = D + ((A<ARG) -NEXT
D = SQR <D / PT)
PRINT "FACTOR F = ";F
PRINT "MEAN-SQUARE DEVIATION = ";D
IF p* = Y" THEN PRINT
D*;"PR8" :
RETURN
WUN*
47
Planckian
Bl ackbody program100 110 <4> 120 138 E?" 148 150 160 170 130 190 200 210 220 230 240 250 260 270 280 290 366 310 320 330 <(W DIM M<988)
CI = 3.741 *
II
-16:C2 = 1.4338 *
10 A
-2:D* = CHR*
PRINT D*;"RUN SPECTRAL"
HOME : PRINT "PLANCKIAN BLACK80DY SPECTRA": PRINT
PRINT "IS A WAVELENGTH RANGE FROM 380 TO 780 NM ACCEPTABL
PRINT : PRINT "EQ TO QUIT]"
LW = 380
:HW = 780
GET ANS*
PRINT : IF ANS* = "Q"
THEN IF ANS* < > "N"
THEN 210 INPUT "LOW WAVELENGTH: "
;LW
INPUT "HIGH WAVELENGTH: ";HW
PRINT "IS A WAVELENGTH INCREMENT OF 5 NM ACCEPTABLE?"
WI = 5
GET ANS*
IF ANS* < > "N"
THEN 260 INPUT "WAVELENGTH INCREMENT: INPUT "ABSOULTE TEMPERATURE: PTS = (HW
-LW) / WI + 1
IF PTS = INT (PTS) THEN 320
HOME
PLEASE PICK WAVELENGTHS AND INCREMENTS WHICH "
ARE EVENLY DIVISIBLE": GOTO 130
PRINT : FLASH : PRINT "WORKING"
: NORMAL
FOR ARG = 1 TO PTS:W = LW + (WI * (ARG
-1) ) :M(ARG) = CI /
* IE - 9) A 5) / ( EXP (C2 / ((W * IE
-9) * T)
-1) ) : NEXT
;WI ;t PRINT PRINT PRINT 340 350 360 370 380 390 400 410 420 430 440 456 466 470 430 490 500 510 520 530
HOME : PRINT "LOW WAVELENGTH:
PRINT "HIGH WAVELENGTH: ";HW
PRINT "WAVELENGHT INC.: "
;WI
PRINT "ABS. TEMPERAURE: ";T;"
PRINT "INPUT DATA FILE NAME"
PRINT "ER TO RESTART]"
INPUT "EQ TO QUIT]: ";FILNAM*
IF FILNAM* = "R" THEN 110
IF FILNAM* = "Q" THEN PRINT :
D*"OPEN" ;FILNAM* D*"WRITE" ;FILNAM* PRINT PRINT PRINT PRINT PRINT PRINT PTS LW HW WI
FOR ARG = 1 TO
PRINT M(ARG)
NEXT ARG
PRINT D*BCLOSE1
PRINT : PRINT
" PTS ; FILNAM* DATA HAS ;LW K" : PRINT
PRINT D*;"RUN SPECTRAL"
NOW BEEN SAVED": PRINT "UNDER FIL
ENAME: " ; F ILNAM*: PR I NT D* ;
"
48
Chromaticity
coordinate program100 63) , 110 120 * + 130 135 136 140 150 160 178 138 190 200 210 220 230 240 258 266 278 238 290 300 310 320 330 340 350 360 370 380 331 382 390 400 410 420 430 440 450 460
"CHROMATICITY CALCULATION PROGRAM"
"LOADING 2-DEGREE OBSERVER" 0*;"XBAR" R*;"XBAR" PTS LW HW WI
1 TO PTS:
"XBAR" 0*;"YBAR" R*;"YBAR" PTS LW HW WI
INPUT XBAR (ARG) : NEXT
DIM ILLUM(68) ,XBAR(68) ,YBAR(63> ,ZBAR(68) ,T(68) ,SX(68) ,SY(
SZ<68)
D* = CHR* (4)
0* = D* + "OPEN"
:R* = D* + "READ"
:W* = D* + "WRITE" :C* = D
"CLOSE"
:V* = D* + "VERIFY"
HOME PRINT PRINT PRINT PRINT INPUT INPUT INPUT INPUT
FOR ARG =
C*;
PRINT PRINT INPUT INPUT INPUT INPUTFOR ARG =
C*;
PRINT PRINT INPUT INPUT INPUT INPUTFOR ARG =
C*;
READ ILLUM* PRINT 0*: 1 TO YBAR ZBARPTS: INPUT YBAR (ARG) : NEXT
R*;"ZBAR' PTS LW HW WI 1 TO ZBAR'
PTS: INPUT ZBAR(ARG) : NEXT
PRINT PRINT PRINT PRINT INPUT INPUT INPUT INPUT ILLUM*
V* ; ILLUM*
0* ; ILLUM*
R* ; ILLUM*
PTS
LW
HW
WI
49
478 PRINT
C*;
I LLUM*568 FOR ARG = 1 TO PTS:T(ARG> = 1: NEXT
575 CX =
. :CY = . :CZ = .: REM SET TRISTIM VALUES TO ZERO
588 FOR ARG = 1 TO PTS:CX = CX + (ILLUM(ARG) * XBAR(ARG) * T(
ARG)):CY = CY + (ILLUM(ARG) * YBAR(ARG) * T(ARG)):CZ = CZ + ( I
LLUM(ARG) * ZBAR(ARG) * T(ARG) ) : NEXT
598 SUM = CX + CY + CZ
688 X = CX / SUM:Y = CY / SUM
685 U = 4 * CX / (CX + 12 * CY + 3 * CZ) 686 V = 6 * CY / (CX + 15 * CY + 3 * CZ) 618 PRINT "x= "
;X
628 PRINT "y= "
;Y
622 PRINT "u'= ";U
624 PRINT "v'= "
;V
625 GOTO 388
638 PRINT "ANOTHER FILE (Y/N) : ";: GET A*
648 IF A* = "Y" THEN 388
999 PRINT : PRINT D*"RUN
58
File normalization program
100 118 128 138 148 158 168 178 138 198 280 210 M* 220 230 240 250 260 270 280 290 300 310 320 338 348 358 368 370 380 390 400 410 420 430 448 458
DIM M( 180)
HOME :D* = CHR* (4)
PRINT "
Normalization Program ": PRINT PRINT "
This program normalizes a spectral"
PRINT "
distribution to a specified value"
PRINT "
at a specified wavelength.": PRINT
PRINT "INPUT DATA FILE NAME"
INPUT "E Q TO QUIT ]:
";
FILNAM*IF FILNAM* = "Q" THEN PRINT : PRINT
D* ;"
RUN SPECTRAL"
PRINT : INPUT "
INP