City, University of London Institutional Repository
Citation
:
Panagopoulos, I., Atkin, C.J. and Sikora, I. (2017). Developing a performance
indicators lean-sigma framework for measuring aviation system’s safety performance.
Transportation Research Procedia, 22, pp. 35-44. doi: 10.1016/j.trpro.2017.03.005
This is the published version of the paper.
This version of the publication may differ from the final published
version.
Permanent repository link:
http://openaccess.city.ac.uk/16832/
Link to published version
:
http://dx.doi.org/10.1016/j.trpro.2017.03.005
Copyright and reuse:
City Research Online aims to make research
outputs of City, University of London available to a wider audience.
Copyright and Moral Rights remain with the author(s) and/or copyright
holders. URLs from City Research Online may be freely distributed and
linked to.
City Research Online: http://openaccess.city.ac.uk/ [email protected]
Available online at www.sciencedirect.com
ScienceDirect
Transportation Research Procedia 00 (2016) 000–000
www.elsevier.com/locate/procedia
2214-241X© 2016 The Authors. Published byElsevier B.V.
Peer-review under responsibility ofthe Scientific Committee of EWGT2016.
19th EURO Working Group on Transportation Meeting, EWGT2016, 5-7 September 2016,
Istanbul, Turkey
Developing a performance indicators lean-sigma framework for
measuring aviation system’s safety performance
Ilias Panagopoulos*, Chris Atkin, Ivan Sikora
City University London, Northampton Square, London EC1V 0HB, United Kingdom
Abstract
The paper introduces a conceptual framework that could improve aviation safety performance and the safety performance measurement process. The framework provides guidance on how organisations could design, implement and use a proactive, performance-based measurement tool for assessing and measuring Acceptable Levels of Safety (ALoS) performance at sigma (σ) level, a statistical measurement unit. Nevertheless, the framework provides a holistic view on how organisations could set leading performance indicators and monitor metrics on the top of identified root-causes that affect system’s safety performance or how to set lagging indicators and feedback metrics on the top of safety outcomes. In fact, the framework adapts and combines classical Quality Management tools, a leading indicators programme and Lean-Six Sigma methodology to formally and continuously improve a stable and in-control safety management process. Finally, the paper underlines the necessity of a new way of thinking for the development of a robust, proactive process for measuring aviation safety performance and system performance variability.
© 2016 The Authors. Published byElsevier B.V.
Peer-review under responsibility ofthe Scientific Committee of EWGT2016.
Keywords:Aviation safety; Performance indicators; Lean Six-Sigma; System’s performance
1. Introduction
According to the International Civil Aviation Organization (ICAO) Annex 19 (2013), ‘safety is the state in which
risks associated with aviation activities are reduced and controlled to an acceptable level’. Since 2009, in an effort
to improve Safety Performance (SP) and to achieve an Acceptable Level of Safety (ALoS) in civil aviation that would be met by all operators, the ICAO has launched Standard and Recommended Practices (SARPs) for the implementation of Safety Management Systems (SMS) in the Air Transport industry (ICAO, 2010a,b and 2009).
* Corresponding author. Tel.: +36-3688-6011; fax: +36-3688-6020.
In addition, in 2012, the European Aviation Safety Agency (EASA) released the first Implementing Rules (IRs) addressing safety management requirements for Authorities, Aircrews and Air Operators (EC, 2012a, 2012b). Indeed, EASA introduced an integrated approach to SMS implementation process since SMS should be fully integrated in the organisation’s existing management system and safety management should include every facet of management that may impact aviation safety (Hamelijnck, 2012). Furthermore, on May 2013, the ICAO Safety Management Manual (SMM) Doc 9859/AN/474 introduced the concept of a Performance-Based (PB) approach to safety that complements the existing compliance-based approach and could achieve an ALoS performance (ICAO, 2013a). The PB approach should be capable of demonstrating SMS implementation and effectiveness in terms of measurable operational outcomes that are related to safety (Ulfvengren, 2014). Moreover, on 14 November 2013 the ICAO SARPs and management system requirements upgraded to a Standard and were published on ICAO (2013) Annex 19. According to this Annex, SP is defined as a State or a service provider’s safety achievement as defined by its SP Targets (SPTs) and SP Indicators (SPIs) and an SMS should as a minimum include ‘provision for continuous monitoring and regular assessment of the appropriateness and effectiveness of safety management
activities (ICAO, 2013). At European level a performance scheme has been made mandatory in Regulation (EU)
No 1216/2011, but only for Air Traffic Management (ATM). The European Commission is getting ready to conduct a study to explore the possibility of extending the approach beyond ATM (EASA, 2014).
Moreover, in the aviation industry the development and measurement of proper indicators is not yet a straightforward process. Consequently, EASA has recently established the Network of Analysts (NoA) SPI Sub Group for considering the subject of SPIs (EASP, 2014). In addition, a Safety Management International Collaboration Group (SM-ICG) was created as a collaboration activity between key aviation authorities to encourage progress and harmonisation. Within SM-ICG a Metrics Working Group (WG) was established for developing and proposing a common understanding of the characteristics of the SP measurement systems and to develop a common methodology for setting expectations regarding SP (SM-ICG, 2013b). Also, SM-ICG has started to develop guidance material on how service providers could measure SP, and in July 2013 the first papers addressing performance measurement and providing guidelines to Service providers on the definition and implementation of a set of SPIs were published (SM-ICG, 2013a). Moreover, SM-ICG introduced the regulators’ perspective and a system’s approach for measuring different aspects of SP, a concept based on a three-tier SPI model, meaning regulator activities, service providers’ behavior and final outcomes (ICG, 2014). Besides, SM-ICG introduced the concept of Leading and Lagging indicators for measuring SP. Nevertheless, the SM-SM-ICG guidelines are still confusing around the differences that exist between SPIs and metrics. To sum up, a process for developing and measuring SP through SPIs in the aviation industry is still in progress and the methodology for establishing proper indicators is not yet clear.
According to Neely, Gregory, and Platts, (1995), performance measurement is the process of quantifying the efficiency and effectiveness of actions within a business context. A Performance Measurement System (PMS) is the set of metrics used to quantify both the efficiency and effectiveness of a system in relation to organisational targets (Neely et al, 1996). An effective PMS should monitor past performance and help to plan future performance (Gutierrez, 2014). According to Muller, Wittmer and Drax (2014), one of the main SMS objectives is to measure system effectiveness, improving SP and therefore reducing exposure to the risk of having an accident or serious incident. Since most accidents have multiple precursors and cues that an accident is likely to happen, there is a common belief that even a small number of general “leading indicators” can identify increased risk of an imminent accident (Leveson, 2015). Besides, Leveson (2015) discusses how to identify and operationalise leading indicators as shaping and warning signals and through the Systems-Theoretic Accident Model (STAMP) proposes assumptions and their vulnerabilities as a proactive methodology for identifying leading indicators in an aviation system.
Ilias Panagopoulos/ Transportation Research Procedia 00 (2016) 000–000 3
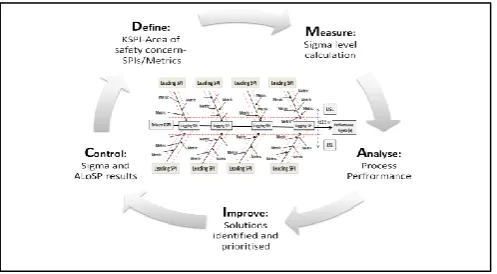
Fig.1 The conceptual framework for measuring system’s safety performance
Nevertheless, a process for establishing a set of pre-defined indicators for measuring aviation system’s safety performance has not yet been introduced or standardised. Therefore, the aim of this paper is to introduce the conceptual framework shown in Fig. 1 for measuring system’s safety performance and performance variability from core organizational objectives. The framework adapts and combines classical Quality Management tools, a leading indicators programme and Lean-Six Sigma (LSS) methodology to formally and continuously improve a stable and in-control safety management process. The paper merely focuses on the framework; hence the detailed description of LSS concept and tools or the development of a leading indicators programme is out of the scope of this study.
1.1.ICAO approach on measuring safety performance
For measuring SMS performance and achieving Acceptable Levels of Safety Performance (ALoSP), ICAO introduced a statistics-based methodology that attempts to control the mean and the variability of a data set. However, when it comes to the point for measuring system’s safety performance there are more factors that operators should also take into account. Unfortunately, ICAO SMS methodology for measuring SP does not provide any guidance on how stakeholders should develop and maintain performance indicators that could proactively measure the system’s overall performance. In fact, the development of proper SPIs and the ALoSP measurement process in aviation is not straightforward and the operational experience for measuring the effectiveness of safety is very limited, since ‘there are many questions yet to be answered on measuring safety performance’ (Roelen and Klompstra, 2012). Furthermore, the ICAO approach for measuring ALoSP is not clear on the definition and the difference between SPIs and safety metrics used in statistics. Both ICAO (2013) and EASA (2014) define SPI ‘’as a
data-based parameter used for monitoring and assessing safety performance’’. On the other hand, ‘’a metric is
defined as a system of measurement used to quantify SPIs or how the SPI is being measured’’ (OECD, 2008).
Nevertheless, measuring SP from SPIs will require some time before it can understand the mechanisms that determine how the indicators represent SP (Roelen and Klompstra, 2012). Indeed, proper SPIs or safety metrics should provide an indication of the likelihood of an accident (i.e. defect) and should assist enterprises detect and respond to potential problems and variation from the standard (i.e. non-conformities) before an accident occurs.
Moreover, any SPI development process should be based in a pre-determined and documented plan that applies to all safety management activities throughout the organisation. Furthermore, organisations should also specify and establish the means for measuring the actual and potential performance. Equally, both air operators and oversight authorities should agree on whether leading or lagging indicators, qualitative or quantitative SPIs and metrics should be prioritized and established, the frequency of measurement, the way the data will be recorded, the format for reporting the data and the statistical data analysis to be made to normalise and convert the data to usable information. In other words, organisations should agree and establish a common, standard and applicable to all SPI programme that could eliminate safety occurrences, proactively measure system effectiveness and examine performance variability from core organisational safety objectives.
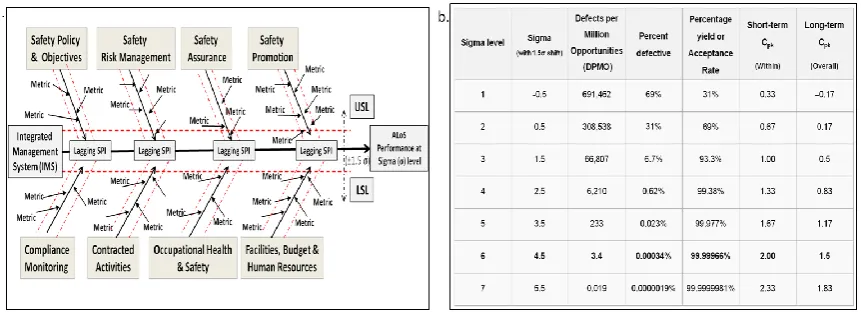
Fig.2: (a) The Safety-PILS model, inspired from Ishikawa-fishbone diagram (1991) (b) Indicative risk based metrics (Sikora et al, 2016)
1.2.Research problem and Key research questions
Nevertheless, for measuring performance and system effectiveness, the twofold research problem which still exists in the aviation safety community and the key research questions are shown in Table 1.
Table 1: Research problem and key research questions
Research twofold Problem
How could aviation organisations have a proactive and performance-based approach to safety that focuses on desired, measurable outcomes and on the management of operational risks?
How could an aviation organisation measure its overall safety effectiveness against performance goals and examine safety performance variability from core organisational objectives?
Key Research Questions
How could aviation stakeholders proactively measure system SP and improve the SP measurement process? Will a conceptual framework assist the continuous improvement of the SP measuring process? If so, how and why? How could a conceptual framework measure the effectiveness of an integrated safety management system?
1.3.Safety PILS model and the Conceptual Framework
For addressing the research problem this paper introduces the Safety - Performance Indicators Lean Sigma (Safety-PILS) model that could improve aviation system SP and the performance measurement process, as shown in Fig.2(a). Safety-PILS provides guidance on how organisations could design, and use a proactive, performance-based measurement tool for assessing and measuring ALoSP. For the purposes of this study, Performance (P) is measured at sigma (σ) level, a statistical measurement unit. Nevertheless, the model provides a holistic view on how organisations could set leading performance indicators and monitor metrics on the top of identified root-causes that affect safety performance or how to set lagging indicators and feedback metrics on the top of safety outcomes (i.e. occurrences - effects). In fact, the model adapts and combines quality tools, a leading indicators programme and LSS methodology concepts and statistical processing tools, to continuously improve a stable and in-control safety management process. In particular, an Ishikawa (1991) root-cause and effect diagram, also known as ‘fishbone’, is used for establishing performance indicators in an aviation system aiming at within ±1.5σ tolerable safety limits. In sequence, the LSS-DMAIC methodology is used for improving the enterprise’s safety processes and results.
Nevertheless, the Safety-PILS model aims to control and maintain SP within agreed Upper and Lower Specification Limits (USL, LSL) and to develop an objective methodology that will proactively investigate and measure system performance variability within ±1.5σ from an ALoSP target. The Driven Key SPI (KSPI) represents core safety policy objectives; the organisational desired outcomes or the top management’s vision whereas SPIs and several safety metrics represent the way for measuring and achieving the KSPI. Also, Galar et al (2013) define performance indicator as a product of several metrics and Fig 2(b) shows such indicative risk based metrics. Practically, a SPI could be qualitative or quantitative and it should correspond to ‘what the organisation should
measure or Key areas of safety concern’ variable. On the other hand, metrics are quantifiable (i.e. data or
[image:5.544.85.470.67.200.2]Ilias Panagopoulos/ Transportation Research Procedia 00 (2016) 000–000 5
Fig. 3 (a) The IMS performance (b) Six-Sigma process levels (data retrieved from Stolzer, 2006 and Horst, 2004)
Consequently, in aviation systems, the main challenge remains how to control and maintain performance within agreed USL or LSL and how to develop an objective methodology that will proactively investigate and measure system performance variability (±σ) from target. An established safety process that performs within LSL and USL eliminates defects (i.e. safety occurrences), which is the desired safety outcome. Indeed, the Safety-PILS model demonstrates the numerous contributing SPIs for achieving SP or for causing variation (i.e. risk) from key system safety objective (i.e. ALoSP). As an example, Fig. 3(a) shows how the overall performance of an Integrated Management System (IMS) could be affected by its components. The intricate relationship during operation of all these components eventually results in the overall performance for the organisation’s management system, usually captured by indicators relating to safety occurrences.
1.4.Lean Six Sigma methodology
According to Harmon (2014), Lean focused on improving the flow of activities and Six Sigma focused on improving the quality and consistency of process outputs. In addition, six-sigma is a goal where the ultimate idea is how to organise a project around the DMAIC process for improving the process and reducing the variation in the process. In Fig.1 the Safety-PILS model has been embedded within DMAIC continuous improvement process. This integration results in a continuous improvement framework that conjointly tries to measure system safety performance, to reduce safety defects and safety process variability, whilst establishing a simplified and standardised aviation safety process for measuring system’s performance. Besides, Fig. 3(b) shows the SS process levels and the associated Defects per Million Opportunities (DPMO) with and without ±1.5 sigma shift. Many organisations are using six-sigma for enhancing safety and as a continuous improvement tool in safety management (Ateekh-ur-Rehman, 2012). In fact, the industry organisational high standard, implicit goal to be achieved and certified is six-sigma (6σ) performance. Six-Sigma (SS) is a statistical measure of excellence in process performance as defined by Motorola, wherein process tolerance corresponds to 6σ. The Motorola model, defines a 6σ criterion for excellence, promising extremely 99.99966% defect-free rate with a maximum of 3.4 DPMO (Horst, 2004). Since tolerance limits in real life have a tolerance shift, SS applies this concept by moving the target ±1.5σ. According to Horst (2004), the unique feature of the Motorola peak-yield ideal is that it acknowledges an acceptable degree of drift (i.e. process shift) of variables from the target, and permits a defined control zone of variation. No process adjustments need to be made when the collected data stay within the limits of ±1.5σ, as long as the operator’s specifications are consistent with a process tolerance of ±6σ or, alternatively ±4.5σ. A second unique feature of the Motorola-defined model is the relevance of short-term versus long-term data collection.
[image:6.544.60.491.69.225.2]Fig. 4 (a) Safety-PILS and the Voice of the Customer (VOC) (b) Safety-PILS and the Voice of the Business (VOB)
2. Measuring aviation system’s safety performance: Implementation guide
The following Table 2 shows an implementation step-guide for measuring system’s safety performance. The implementation guide is divided in two phases, Phase I and Phase II. The Phase I is mainly the utilisation of the Safety-PILS model and the Phase II is the practical implementation of the DMAIC process. Both Phase I and Phase II are forming the conceptual framework.
Table 2: Implementation step guide for measuring system’s safety performance
Phase I. Design the Voice of the Customer (VOC) & the Voice of the Business (VOB)
Define the driven KPI for the VOC & the driven KSPI for the VOB Set the VOC & VOB Targets and the LSL-USL based on industry standards
Set KPIs on the VOC– Critical to Quality (CTQ) characteristics Set SPIs on the VOB- Critical to Safety (CTS) characteristics Set metrics on each VOC KPI and VOB SPI and the associated LSL-USL
Multiple Regression Analysis: Identify correlation between cause/effect Design Safety - PILS for VOC & VOB
Phase II. Apply Six Sigma-DMAIC methodology
Data Collection Planning (DCP) for Hypotheses tests Hypothesis Testing
Control Chart selection road map for each VOB SPI and Metric Identify special causes: If none the process is In-Control
Measurement System Analysis (MSA): Where does the variation of data comes from? Is the process Accurate and Precise?
Process Capability: Is the process Capable (i.e. efficient)? At what sigma level? Calculate the probability with a knowing Mean and STDV to achieve the Target
Analyse the data. Identify root cause and attractive areas for improvement Identify best and feasible solutions : Pilot solutions
Demonstrate that piloted solution provides adequate Return of Investment (ROI) Define Control Plan and Roll-out improvement
Monitor the Control Plan to sustain the change
Voice of the Process (VOP)= [(2VOC+VOB)/3]= Total system safety performance
2.1.Phase I
[image:7.544.51.499.72.226.2]Ilias Panagopoulos/ Transportation Research Procedia 00 (2016) 000–000 7
Fig. 5 (a) Safety-PILS and SPI_02: Runway Excursions (RE) (b) Safety-PILS and SPI_06: Loss of Control (LOC)
[image:8.544.49.479.69.220.2]Alike the driven-KSPI that consist of a set of indicators with clear targets and specification limits, SPIs consist of a set of metrics that also need to perform within USL and LSL. As an example, the following Table 3 presents the VOC and the VOB driven indicators and the related KPIs/SPIs that have been selected by the particular airline.
Table 3: VOC & VOB: Performance indicators to be monitored and measured
VOC: Driven –KPI: Customer Complaints Rate VOB: Driven –KSPI: Safety Occurrences Rate KPI_01: Flight value for money-Total cost SPI_01: Runway Incursions (RI)
KPI_02: Hub-Departure airport location SPI_02: Runway Excursions (RE)
KPI_03: Airline Punctuality and Customer Service SPI_03: Fire/Smoke/Fumes/Odor (FSFO)
KPI_04: AirlineCompany Brand name SPI_04: Ground Handling (GH)
KPI_05: Passenger information –Intel sources SPI_05: Airborne Conflict (AC)
KPI_06: Treatment of complains SPI_06: Loss of Control (LOC)
KPI_07: Safety Standards and Record SPI_07: Controlled Flight Into Terrain (CFIT)
KPI_08: Connectivity network SPI_08: Dispatch –Aircraft availability (DISP)
As an additional example, Table 4 shows two representative SPIs and their associated numeric metrics. Nevertheless, for monitoring and measuring system’s safety performance all VOB indicators and metrics should follow the DMAIC improvement process, which is the Phase II in the conceptual framework’s implementation guide. Besides, Fig. 5(a) and (b) shows how the Safety-PILS model have been utilized and expanded for the design of the SPI_02 and SPI_06.
Table 4: VOB: Representative Safety Performance Indicators (SPI) & Associated Metrics
SPI_02: Runway excursions (RE) SPI_06: Loss of Control (LOC) Metric 02.1: Deep Landing events Metric 06.1: Stick-shake and alpha floor events
Metric 02.2: Unstable-De-stabilized approaches (all) Metric 06.2: Take off Configuration warnings
Metric 02.3: Unstable-De-stabilized approaches (all) continued for landing
Metric 06.3: Low speed during cruise events
Metric 02.4: High speed touchdown events Metric 06.4: Low speed during approach events
Metric 02.5: High speed rejected take-off events Metric 06.5: Percentage of pilot’s readiness rate for proficiency
Metric 02.6: Take-off landing events involving loss of aircraft directional control caused by contaminated runway surface
Metric 06.6: Pilot’s utilisation effectiveness
Metric 02.7: Runway and Overrun events due to runway contamination
Metric 06.7: Percentage of pilots received upset recovery training
Metric 02.8: Proportion of licensed aerodromes using new reporting criteria for runway surface condition
Metric 06.8: Percentage of qualified and current pilot’s availability rate
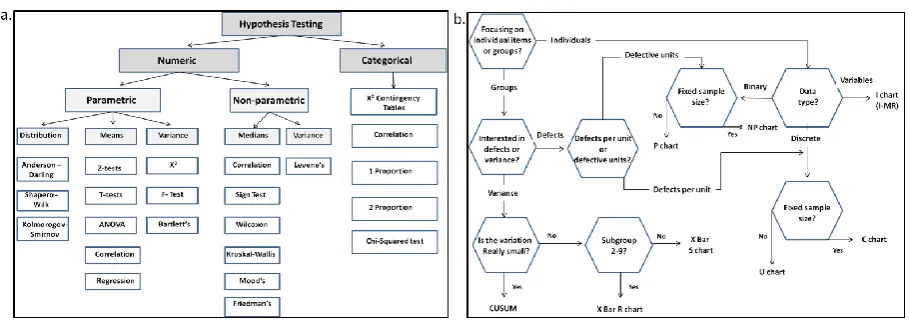
[image:8.544.42.501.300.391.2] [image:8.544.33.502.475.604.2]Fig. 6 (a) Hypothesis testing road map (b) Control Chart selection road map
2.2.Phase II
Phase II starts with the Data Collection Planning (DCP), the hypothesis testing and control chart selection. During DCP the operator should decide on what type of data is most appropriate to collect for measuring the SPI and metrics, what resolution is needed, what statistical tool should be used to interpret the data and what should be the sample size and frequency. The next step is the Hypothesis testing. In system’s safety measurement process the operator needs to be confident that data is distributed normally. A hypothesis test for testing that data is distributed normally may results in P-value>0.001 which means that the operator has a reasonable confidence in assuming that the data follows the normal distribution curve. If P-value<0.001 the hypothesis should be rejected. In LSS there are many types of hypothesis tests. Fig. 6(a) presents a practical decision making tool for selecting the right hypothesis test based on the type of the collected data (i.e. numeric or categorical).
In sequence, the operator should select the appropriate Statistical Process Control (SPC) Chart for measuring and understanding the performance of a particular SPI or metric over time. The control chart shows the Upper and Lower Control Limits (UCL/LCL) that the data results will fall within, if the process is stable and ‘in-control’. Control Charts may also detect changes in process average and changes in process variation or ‘special causes’ of variation that need further investigation. Fig. 6(b) presents a practical decision making tool for selecting the right control chart based on the type and the sample size of the collected data. Should the operator detect a variation in the collected data, the Measurement System Analysis (MSA) could help to identify the root cause of this variation. Besides, MSA could assist the operator to understand if the measurement process of data is accurate and precise. However, MSA is considered as a complicated process and its detailed description is out of the scope of this paper.
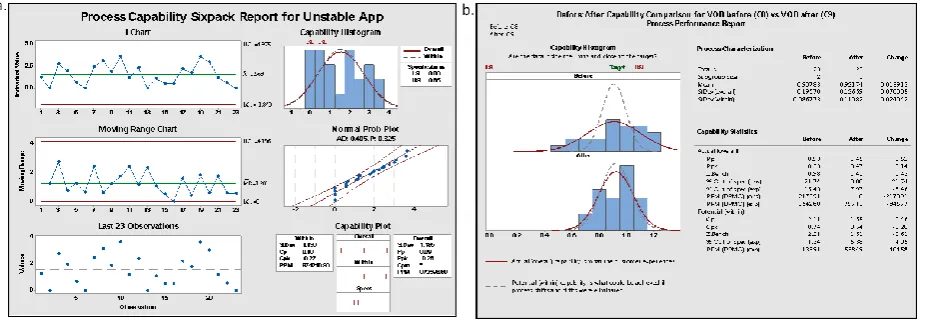
One of the critical steps of Phase II is the Process Capability analysis. Process capability assists the operator to understand if the measurement process of a particular SPI or metric is capable or efficient. Besides, to determine the sigma level the particular indicator performs. Fig. 7 (a) provides an indicative example on how the air operator measures the performance of an ‘in control’ indicator (i.e. unstable approaches) at sigma level by comparing the short or long term Capability index (Cpk). Process capability could also apply to a set of SPI or metrics. Consequently, by having a set of quantifiable indicators the operator could further measure and analyse the overall system SP and its performance variability from core safety objective (i.e. driven KSPI). However, any past performance is not indicative of future returns. Therefore, capability analysis is the method could also be used for predicting the outcome of a safety process. In fact, capability analysis is a method for predicting both the current process capability (i.e. sigma level) and future performance of an indicator as to meet specifications (i.e. USL/LSL) against a target.
[image:9.544.49.504.68.230.2]Ilias Panagopoulos/ Transportation Research Procedia 00 (2016) 000–000 9
Fig. 7 (a) Capability analysis-normal distribution (b) VOB Capability analysis before and after
Nevertheless, Cpk and Ppk are only valid with normal distributions (i.e. normal prob. plot P>0.05) and quantitative variables (i.e. SPIs or metrics). On this ground, the core advantage of the Safety-PILS model is that applying the ‘Central Limit Theorem’ for approaching normal distribution, by increasing the sample size of each indicator’s mean. Consequently, the Driven-KSPI’s mean consists of the means of all leading SPIs. Sequentially, the mean of a SPI consists of the means of all applicable metrics to this particular SPI. Therefore, during Phase II the operator’s effort is to assure that all individual SPIs and metrics are ‘in process control’ and ‘capable’. Should any of the indicators do not satisfy these conditions, the analysis of data could reveal the root causes for process inconsistencies and identify the areas that need further improvement.
In addition, many tools are available in LSS DMAIC that aim to develop, select and implement the best solutions (i.e. mitigation measures), with controlled risks. The effects of the solutions are then measured and compared with the driven-KSPI’s overall safety performance. However, the success of Phase II is not based upon the successful implementation of the selected solutions, but instead when the KSPI process measurement has improved and re-validated with appropriate statistical tools and techniques (i.e. control charts, capability analysis and hypothesis testing). Fig, 7 (b) shows an intermediate process performance report of the VOB. The report validates the improvements achieved after the analysis of data and implementation of solutions. The process standard deviation (i.e. overall variation) was reduced significantly by -0.07005, the actual process performance has been notably increased by 0.52% and the DPMO has been reduced by -217391.
Nevertheless, the operator should aim to ensure that the solutions that have been implemented and embedded into the VOB have also a positive effect to the Voice of the Process (VOP). At this point the reader should recall that the VOP includes both the VOC and the VOB. Consequently, by improving the VOB, both the VOC and the VOP will also be improved and an adequate Return of Investment (ROI) will be provided to the operator. Finally, for measuring the overall system’s safety performance the following Eq.1 could apply:
As an example, assuming the VOC (i.e. customer complains rate) is currently 0.04 and the VOB (i.e. occurrences rate) is 0.06, then the total percent defective is 0.046% and the percentage yield or acceptance rate is 99.954%. According to Fig. 3 (b), 0.046% or 99.954% means that total system’s safety performance approaches 5 sigma performance with the potential to have 233 defects per million opportunities (i.e. occurrences per flying hours).
3. Conclusion
[image:10.544.45.508.73.233.2]combined impact on SP measurement process. The elaboration of LSS features revealed the Safety-PILS model and the DMAIC continuous improvement process as guidance tools for continuous measuring an aviation organisation’s safety performance at sigma level. To this end, the proposed framework is a new way of thinking for designing a safety case aims to achieve ‘in-control’, capable processes and desired outcomes within agreed specifications limits.
References
Andriulo, S. and Gnoni, M.G., 2014.Measuring the effectiveness of a near-miss management system: An application in an automotive firm supplier, Reliability Engineering & System Safety, 132, pp. 154–162.
Ateekh-ur-Rehman, L.U.R.. 2012. Safety management in a manufacturing company: Six Sigma approach, Engineering, 04(07), pp. 400–407. Bissell, A.F., 1990. How reliable is your capability index? Applied Statistics, 39(3), p. 331.
EASA, 2012. Certification Specifications for Large Aeroplanes. [online]. Available at: http://www.easa.europa.eu, [Accessed 16 April 2016]. EASA, 2012a. Explanatory Note to PART-ORO’. [online]. Available at: https://www.easa.europa.eu, [Accessed 12 February 2016]. EASA, 2012b. Annex I to EC Decision 2012-020-R, [online]. Available at: https://www.easa.europa.eu, [Assessed 11 March 2016]. EASA, 2014. A Harmonised European approach to a performance based environment’ [online]. Available at:
https://www.easa.europa.eu/document-library/general-publications, [Accessed 14 March 2016].
EASp, 2014. European-Aviation-Safety-Plan-(2014-2017), [online]. Available at: https://www.easa.europa.eu, [Accessed 22 March 2016]. EC, 2012a. European Commission Regulation 290/2012 for Aircrews, 30 March 2012.
EC, 2012b. European Commission Regulation 965/2012 for Air Operators, 25 Oct 2012.
Galar, D., Parida, A., Stenström, C. and Berges, L., 2013. Maintenance performance metrics: A state‐of‐the‐art review, Journal of Quality in Maintenance Engineering, 19(3), pp. 233–277.
Gutierrez, D.M., Scavarda, L.F., Fiorencio, L. and Martins, R.A., 2015. Evolution of the performance measurement system in the logistics department of a broadcasting company: An action research, International Journal of Production Economics, 160, pp. 1–12.
Hamelijnck R., 2012. SMS and the EASA Rules, [online]. Available at
http://www.seguridadaerea.gob.es/media/3989076/easa_rulemaking_sms_aesa_may_2012.pdf, [Accessed 08 March 2016].
Harmon P.,2014, ‘A Business Process Management Guide for Managers and Process Professionals’, Chapter 12 in the book ‘Business Process Change 3rd ed, Incremental Improvement with Lean and Six Sigma pp. 293-325 and Measuring Process Performance pp. 109-129.
Horst R., 2004. Measuring and Achieving Six Sigma Performance, Manufacturing Engineering, July 2004 Vol. 133 No. 1, [online]. Available at: http://www.peaksigma.com/SME-pub.htm [Accessed 11 April 2016].
ICAO, 2009. Safety Management Manual, ICAO Doc 9859-AN/474, Second Edition.
ICAO, 2010a. Operation of aircraft, Part I – International Commercial Air Transport – Aeroplanes, Annex 6 to the Convention on International Civil Aviation, Ninth Edition, July 2010, Amendment 34 of July2010.
ICAO, 2010b., Air Traffic Services, Annex 11 to the Convention on International Civil Aviation, Thirteenth Edition, 2001, Amendment 47-B. ICAO, 2013. Annex 19, Safety Management, 14 Nov 2013.
ICAO, 2013a. Safety Management Manual (SMM), Doc 9859/AN/474, Third Edition, May 2013. Ishikawa, K., 1991. What is total quality control? The Japanese way. London: Prentice-Hall.
Leveson, N., 2015. A systems approach to risk management through leading safety indicators, Reliability Engineering & System Safety, 136, pp. 17–34.
Muller R.,Wittmer A., Drax C., 2014. Aviation Risk and Safety Management- Methods and applications in Aviation Organisations, Springer International Publishing, Switzerland 2014.
Neely, A., Gregory, M. and Platts, K., 1995. Performance measurement system design, International Journal of Operations & Production Management, 15(4), pp. 80–116.
Neely, A., Mills, J., Platts, K., Gregory, M. and Richards, H., 1996. Performance measurement system design: Should process based approaches be adopted?, International Journal of Production Economics, 46-47, pp. 423–431.
OECD, 2008, Guidance on developing safety performance indicators, Guidance for industry, No.19, Environmental Directorate, Paris 2008. Podgórski, D., 2015. Measuring operational performance of OSH management system – A demonstration of AHP-based selection of leading key performance indicators’, Safety Science, 73, pp. 146–166.
Roelen A.L.C and Klompstra M.B., 2012. The challenges in defining aviation safety performance indicators, PSAM 11 & ESREL 2012, Finland, [online]. Available at: http://www.nlr-atsi.nl/downloads/the-challenges-in-defining-aviation-safety-per.pdf (Accessed 10 March 2016). Sikora, I , Patriarcha R, Di Gravio G., Costantino F., 2016. MARS – A Fresh Look at Risk Assessment Modelling and Effective Safety Data Communication, conference proceedings Perspectives on Croatian 3PL industry in acquiring international cargo flows, ZIRP 2016, Croatia. SM-ICG, 2013a. Measuring Safety Performance -Guidelines for Service Providers, Safety Management International Collaboration Group, 16 Jul 2013 [online]. Available at: http://skybrary.aero/bookshelf/books/2709.pdf [Accessed 11 March 2011].
SM-ICG, 2013b. Metrics WG Update, Draft, Safety Management International Collaboration Group, 24 Jul 2013 [online]. Available at http://www.icao.int/safety/SIXSGReportAttachments/A2-SMICGUpdate.pdf, [Accessed 26 March 2016].
SM-ICG, 2014. A System’s Approach to Measuring Safety Performance: The Regulatory Perspective, Safety Management International Collaboration Group, January 27, 2014 [online]. Available at http://www.skybrary.aero/bookshelf/books/2620.pdf (Accessed 10 April 2016). Tenera, A. and Pinto, L.C., 2014. A Lean Six Sigma (LSS) project management improvement model’, Procedia - Social and Behavioral Sciences, 119, pp. 912–920.