C D Armstrong
1,2, C M Brenner
2, E Zemaityte
1,2, G G Scott
2, D R Rusby
2,
G Liao
3, H Liu
2,4, Y Li
4, Z Zhang
4, Y Zhang
2,4, B Zhu
4, P Bradford
5,
N C Woolsey
5, P Oliveira
2, C Spindloe
2, W Wang
4, P McKenna
1and
D Neely
21
Department of Physics SUPA, University of Strathclyde, Glasgow G4 0NG, United Kingdom 2
Central Laser Facility, STFC Rutherford Appleton Laboratory, Harwell, OXON, OX11 0QX, United Kingdom
3
Key Laboratory for Laser Plasmas(Ministry of Education)and School of Physics and Astronomy, Shanghai Jiao Tong University, Shanghai 200240, People’s Republic of China
4
Beijing National Laboratory for Condensed Matter Physics, Institute of Physics, Chinese Academy of Sciences, Beijing 100190, People’s Republic of China
5
Department of Physics, York Plasma Institute, University of York, Heslington York YO10 5DD, United Kingdom
E-mail:[email protected]
Received 30 August 2018, revised 13 November 2018 Accepted for publication 3 December 2018
Published 23 January 2019
Abstract
The bremsstrahlung x-ray emission profile from high intensity laser-solid interactions provides valuable insight to the internal fast electron transport. Using penumbral imaging, we characterise the spatial profile of this bremsstrahlung source as a function of laser intensity by incrementally increasing the laser focal spot size on target. The experimental data shows a dual-source structure; one from the central channel of electrons, the second a larger substrate source from the recirculating electron current. The results demonstrate than an order of magnitude improvement in the intensity contrast between the two x-ray sources is achieved with a large focal spot, indicating preferable conditions for applications in radiography. An analytical model is derived to describe the transport of suprathermal electron populations that contribute to substrate and central channel sources through a target. The model is in good agreement with the experimental results presented here and furthermore is applied to predict laser intensities for achieving optimum spatial contrast for a variety of target materials and thicknesses.
Keywords: bremsstrahlung, penumbral, laser-plasma, defocus, x-ray source size, x-ray radiography
(Somefigures may appear in colour only in the online journal)
1. Introduction
High intensity laser pulses rapidly ionise the target material and accelerate electrons in laser-solid interactions, driving a multi-MegaAmpere current of relativistic electrons into the target[1–3]. This electron current collisionally causes further ionisation within the target leading to characteristic line emission, and produces broad-band bremsstrahlung radiation Original content from this work may be used under the terms
with energies up to tens of MeV as it propagates[4,5]. This emission of bremsstrahlung radiation has long been used as a
high energy x-ray source for radiography [6, 7]. Both
bremsstrahlung and line emission are used as a diagnostic tool for laser-plasma interactions [8–12]. To optimise the x-ray brightness while minimising the source size it is necessary to understand the generation and transport of the electron beam as it propagates through the target. In doing so, we can improve the performance of these sources for x-ray radio-graphy applications.
The incident laser pulse drives an electron beam with some initial divergence into the target. This divergence is, in part, due to intensity variation in the laser focal spot profile [13]. As the fast electrons travel through the target, an azi-muthal magnetic field is established that acts to confine the electron beam, higher current density increases the strength of the magneticfield[14,15]. This effect is particularly present in thick (>300μm) targets where higher accelerated proton energies than a simple ballistic electron expansion model
predicted were detected as a result of the magnetic field
growth limiting the electron expansion [16]. As electrons
reach the rear surface and escape they establish a TV/m
electricfield[17,18], thisfield can cause the remaining fast electrons to reflect, forming a recirculating (or refluxing) electron population between the surfaces of the target that continues to expand laterally as it recirculates[19,20]. In thin targets, the proportion of electrons recirculating is a large fraction of the initial beam[16,21–23]and as they still carry significant energy these electrons are able to generate x-rays as they interact with the bulk of the target[8,24].
Prior work demonstrates that the effective electron divergence can be varied by changing the interaction
condi-tions. Ovchinnikovet al shows that an increased preplasma
scale length is a primary driver in electron divergence increase, and afixed preplasma leads to a constant effective electron divergence over a range of on-target intensities
[25, 26]. Measurements of K-alpha signal have shown that
effective electron divergence is insensitive to target thickness
[26, 27]. Modelling revealed that this was an incomplete
picture of the interaction as the initial electron divergence was significantly larger than was measured and collimation of the
beam occurred due to field growth which reduced the
effective fast electron divergence [16, 28]. Quinn et al
developed a recirculation model to investigate K-alpha emission in targets with and without the rear surface sheath (controlled via a CH layer on the rear surface), predicting that recirculating electrons could drive a 200μm K-alpha source from a 20μm thick Cu target[8].
This paper explores the population of the recirculating electron beam’s contribution to the x-ray source via exper-imental measurements. In this article, we show a dual-source structure in the x-ray signal;(1)a bright narrow core(central source), and(2)a diffuse secondary signal(substrate source) produced by recirculating electrons. It is shown, via analytical modelling, that by tuning the fast electron temperature to the target thickness and material we can minimise the electron recirculation and reduce the contribution from the substrate source whilst increasing the brightness of the central x-ray emission.
2. Experimental Investigation
2.1. Layout
The experiment was conducted using the Vulcan laser [29]. The laser pulse duration was (2.0±0.6) ps, the on-target
energy was 80 J providing a peak intensity of
∼5×10¹⁹W cm–2 [30, 31]. The targets were copper foils
3×7 mm in transverse size and 100μm thick with the
position relative to best(smallest spot diameter)focal position referred to asΔZ, the laser spot at each defocus position was
characterised via a×20 imaging system with a CCD. Protons
accelerated from the rear surface were measured with a Thomson Parabola along the target normal axis. The x-ray source profile was characterised using a penumbral technique similar to the rolled bar shown by Houck and Richardson in 1998 for synchotron emission[32].
The penumbral foil used was a curved sheet of 300μm
tungsten foil, it was set to ∼150 mm radius of curvature to ensure that the transmission length of the x-rays sufficiently attenuates up to 100 keV energies at a small depth (<1μm)
into the foil. The x-rays were detected using Fujifilm SR
image plate (IP), with an 18 mm SiO2filter between the IP
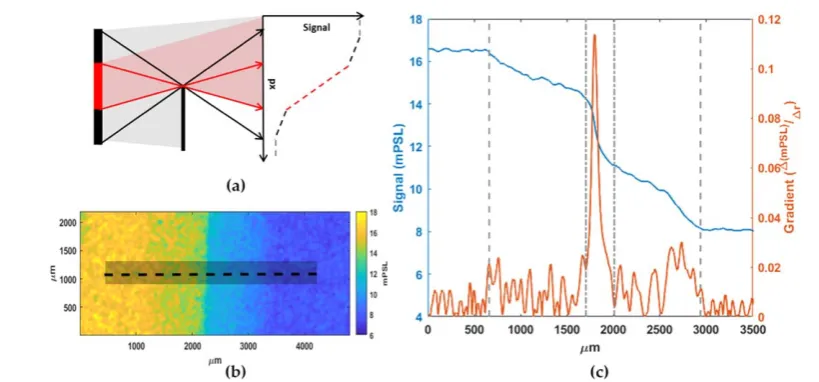
[image:2.595.73.522.64.198.2]providing a peak absorption at∼50 keV. The response curve for the detector, accounting for the SiO2filter, is shown in figure 1(b). The penumbral foil was aligned 30o vertically from the target and set up with a×5.7 magnification onto the detector plane, with a 0.6 T magnet to remove electron signal from the detector. The total x-rayflux from the target was also measured with secondary IP positioned beneath the penum-bral detector on the same plane as the laser. The single foil limits measurements to the horizontal axis of the source; for foil targets under similar laser intensities the source has been
demonstrated to be quasi-symmetric [33]. With an
asym-metric source the imaging quality would be reduced in one axis compared to the other, potentially omitting features that would otherwise be visible.
2.2. Penumbral operation
The penumbral foil creates a near binary transmission object from which the x-ray source characteristics can be deter-mined. When illuminated with a non-point source this will create a transition region in the detected image where the x-ray signal changes gradually. A schematic and example of the penumbral measurement is shown infigure2for a 100μm thick Cu target. The distinct regions of the source are high-lighted. Isolating the central source allows the source size and
relative flux from both the central electron beam and the
recirculating electrons (substrate source) to be retrieved. To
do this, we first determine the peak gradient and its
full-width-half-maximum. The next point of inversion in the gradient, marked infigure2(c)by the dot–dash lines, is set as the boundary of the central source and this region is removed from the lineout. This routine is then repeated, this time without the bright contribution from the central source.
The two sets of dashed lines, figure 2(c), highlight the
distinct regions in the source—dot–dash for central and
dashed for the substrate. Conventional x-ray tube sources have shown a similar double-source structure from penumbral
measurements via reconstruction instead of direct measure-ment[34]. Uncertainty in x-ray source measurements with the penumbral foil are a convolution of both the point spread
function—dominated by x-rays scattering through filter
materials—and minimum resolution bounds, demonstrated by
Fikselet alto be(118±2)μm for SR IP, due to scattering in the energy deposition and the scanning mechanism [35]. To determine incident photons on each detector, from the mea-sured mPSL, the conversion presented by Bonnetet alis used to provide the relative photon numbers per Steradian pre-sented in the paper[36].
2.3. Flux measurements
Figure3(a)shows the total normalisedflux of x-ray emission and number of protons as a function of laser defocus, the number of protons falls with increasing defocus whilst the x-ray signal remains relatively constant. This indicates to a first order approximation that as the laser is defocused, and the on-target laser intensity reduced, there are a similar number of accelerated electrons travelling within the target (creating bremsstrahlung as they travel) yet the number of these electrons reaching the rear surface and contributing to the acceleration of protons has decreased. The measured x-ray signal is consistent with K-alpha measurements modelled by
Reich et al for copper targets irradiated at similar laser
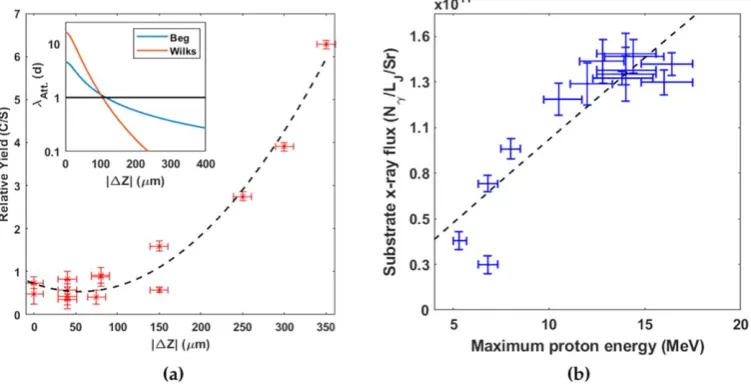
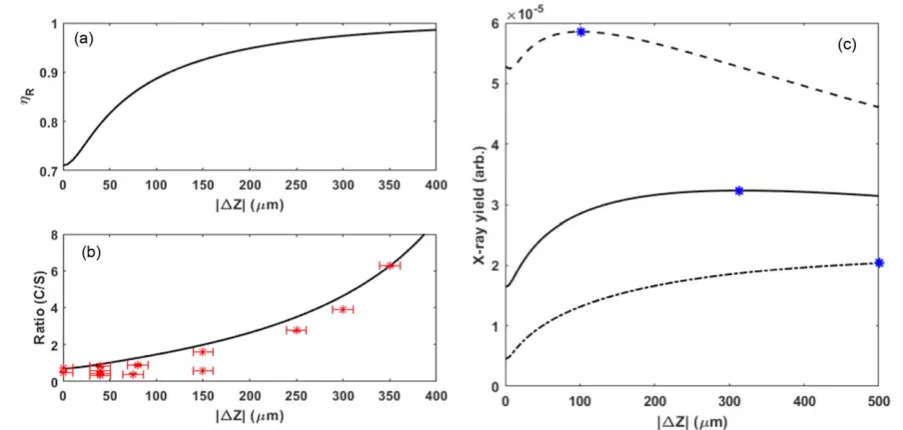
intensities[5,37]. If we consider each region independently via the penumbral technique outlined above—figure3(b)we see an increase in x-rayflux from the central source for larger defocus and, more pertinently, the ratio between the central
and substrate source shifts significantly in favour of the
central source—figure4(a).
At the maximum defocus tested we see a ×(10±2)
[image:3.595.86.496.64.255.2]the mean electron energy approaches the target thickness in
copper. Conversion efficiency, from laser energy to number
of fast electrons, has been demonstrated by several groups [38,39]to scale with intensity. A reduced temperature spectra could have more electrons populating it though, even when factoring in the reduced laser conversion, as the temperature reduces faster than the absorption with intensity. The inset of figure4(a)shows the attenuation length in copper for both the scaling arising from Wilks et al[40]and Beget al[2]. For each scaling law the attenuation length of the expected fast electron temperature with copper approaches the target thickness at∼150μm defocus. This is the same defocus that we begin to see the central source dominate influx contrib-ution. This implies that the central source is dominated by
electrons on theirfirst pass of the target, and that, by contrast, the substrate source must be generated by either a subset of highly-divergent fast electrons or electrons that are recircu-lating through the target. The latter is known to be a
sig-nificant fraction of the accelerated electron population
[19, 20, 24] and therefore will be considered here. The
[image:4.595.103.493.68.262.2]recirculating fast electron population is dependent on the sheathfield established on the target rear surface which stops electrons escaping on thefirst pass of the target. Infigure4(b) the maximum proton energy and the x-rayflux contribution of the substrate source is compared, demonstrating a linear relationship between the two.
Figure 3.X-ray and protonflux as a function of defocus.(a)Total x-rayflux per laser Joule and number of protons.(b)X-rayflux at 50 keV contributed by each source, central(red)and substrate(blue). Lines of bestfit(dashed)are included as a visual aid, linear for(a)and Gaussian for(b).
[image:4.595.112.488.324.517.2]2.4. Spatial x-ray measurements
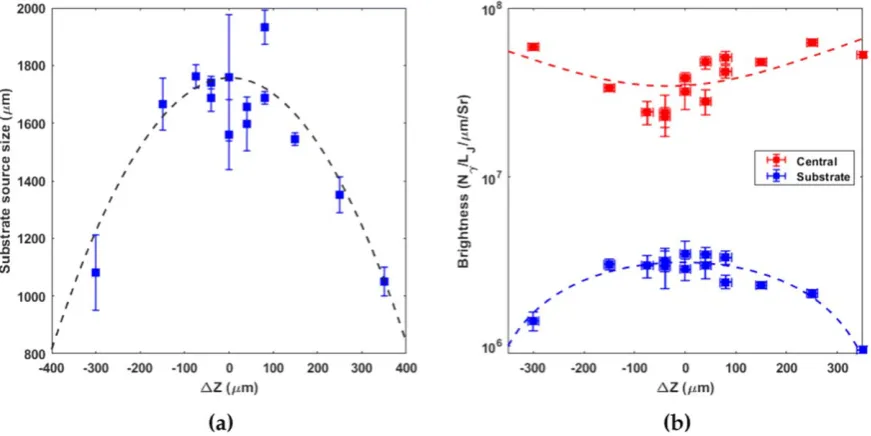
The results above suggest a mechanism to improve x-ray radiography by reducing the contribution by the larger sub-strate source. Figures5(a)–6(a)are plots of the lateral size of both the central and substrate source as a function of defocus
position. The trend with defocus (ΔZ) seen in the central
source size cannot be approximated by a single electron divergence, as demonstrated in figure 5(a). However, the divergence of the electrons through the target can be inferred from the central measurement and laser spot diameter. We
find good agreement with the divergence measurements made
by Greenet al[26]over the tested intensity range,figure5(b).
It should be noted that the ∼50 keV x-rays measured by the
diagnostic will have reduced divergence compared to the
isotropic K-alpha signal measured by Green et aldue to the
bremsstrahlung generation mechanism conserving momentum from the incident relativistic electron [41]. From GEANT4 simulations [42]the electrons responsible for generating the
majority of the detected x-ray flux is ∼1–2 MeV for the
expected laser intensity.
The central source increases as the laser is defocused,
from an optimum of ∼84 to >120μm at largest defocus
[image:5.595.74.524.63.293.2]whereas the substrate source decreases from∼1.8 mm at best Figure 5.Central x-ray source size and electron divergence as a function of defocus.(a)Central source size as measured(blue), with the expected size from a simple geometric expansion for different electron divergences also shown(black dashed lines).(b)Electron divergence as a function of on target intensity. Measurements from this experiment(black)extend the trend seen in numerous experiments collated by Greenet al(red), references of each in[26]. Reprinted with permission from[26], Copyright(2008)by the American Physical Society.
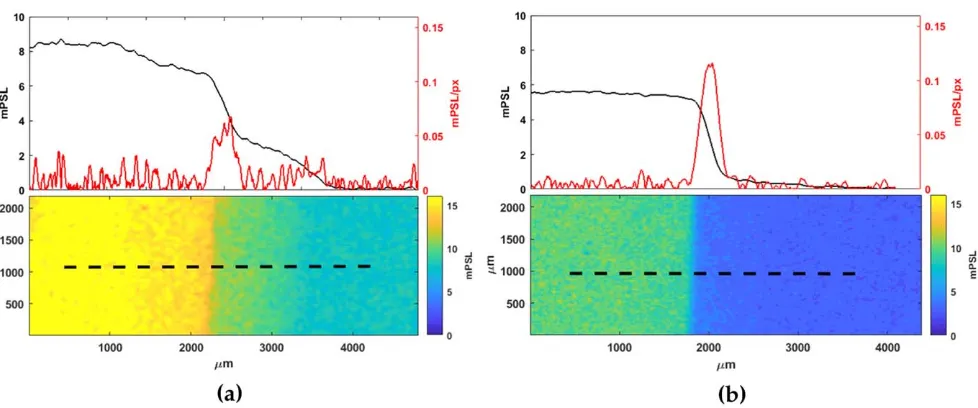
[image:5.595.82.518.356.574.2]focus to;1 mm at large defocus. A lineout of the penumbral edge at best focus and largest defocus is presented infigure7. Whilst the increase in the central source can be explained by the increasing laser focal spot and reduced electron diver-gence the decreasing size of the substrate source and the reduction in the x-rayflux shown infigure4(a)is indicative of a lower total number of recirculating electrons.
Magnified spatial resolution of a radiograph is dependent on the detector resolution and the size of the source emission area. As such, decreasing the size andflux contribution of the substrate source is beneficial to radiography as it removes the larger blurring factor on the image. The increase in central
source size, however, is overcome by the increase in flux
driving a brighter central source, shown infigure6(b).
2.5. Spatial contrast improvement
The spatial profile of the x-ray source demonstrates a two-source structure, a narrow central channel and a broad sub-strate source. The increased contrast between the central and substrate source provides greater spatial contrast of the x-ray emission and the reduction of the secondary source removes the majority of the background signal. When the ratio
between these two sources is at its greatest (i.e 300μm
defocus from the experimental scan)the image quality is at its greatest. An example of this can be seen in the radiographs in figure7.
Whilst the radiograph of the penumbral edge can be
[image:6.595.58.547.64.268.2]considered as a simplified—almost ideal—example, the
Figure 7.Comparison of varying defocus in radiographs,(a)target at best focus,(b)target at−300μm defocus. The significant image contrast improvement by reducing, or removing, the secondary source is clear.
[image:6.595.111.490.322.518.2]increase in contrast is clear. Objects with features smaller than the substrate source could be blurred by its contribution.
3. Discussion
Analytically we can begin to understand the emergence of this effect for targets of given thickness by considering how to optimise the x-rayflux created on thefirst pass of the target( i.e. those fast electrons that only travel in the central channel). We know from scaling laws that the intensity and fast electron
relationship scales as,Ia k T
B e
µ , wherek TB e is the hot
elec-tron temperature andavaries from 0.33[2]to 0.5[40]. The
sheath evolves via plasma expansion. Mora [43] presents a
1D isothermal plasma expansion model that can be used in calculations of the sheath dynamics. The peak electric field Esheathscales as:
Esheathµ(n k Te B e)0.5, ( )1
whereneis the electron density. If the separation between the target surface and the peak of the sheath isλDthen the energy of electrons able to escape the target can be approximated to:
UescEsheathlDk TB e. ( )2
Electrons with more than this energy typically can escape the target on thefirst pass and as such only contribute to the central source of x-rays. The other sub-population to consider is the low energy electrons, those that would typically lose their energy through collisions with the bulk target in a single pass. This limits low energy electrons from reaching the rear surface based on the target material and thickness, with the
transmission function, Γ, defined as:
Eh, ,r l exp lrs Eh
G( )= (- ( )), wheres(Eh)is the attenuation cross section for an electron of energy Eh, ρ and l are the target density and thickness respectively. The remaining
electrons contribute to the substrate source and blur the final image. The ratio of electrons that can only contribute to the central source and those that recirculate and contribute to the substrate source can be expressed as,ηR:
, 3
R
N N N
f E E f E E
f E E
1 d d
d
c e h
h h kBTe h h h h
0
0
h = = ò ò
ò
+ ¥ - G + ¥
¥ ( )
( ) ( ) ( )
( )
where Ne, Nc, and Nhare the populations of escaping elec-trons, electrons lost through collisions in the target, and the total number of accelerated electrons respectively.
The distribution is a Maxwellian of the form
f Eh A exp E k T E k T 4 h B e h B e 3 =
-p
(
)
( ) ( ) , where A is the conversion
efficiency calculated from the equation presented in Davies [44]. Figure 8 shows these for a typical spectra for a high intensity laser. The difference between the total number accelerated and those that escape or collide through the target are the recirculating electrons. In order to maximise the central source of x-rays the collisional and escaping electron populations need to be significantly greater in number than the recirculating electrons. This model is calculated from intensity and does not implicitly include temporal or energy considerations that are known to alter the sheath development [43, 45–47]. We would expect a similar optimum to exist when varying either energy or pulse duration, when the sheath field and electron attenuation result in a lower recirculating population. This model gives us a method to optimise the electron temperature to the target thickness, maximising the
central source distribution and therefore the final image
quality. To correlate this with the experimental work the
intensity was determined by 80 J in a spot defined by
F
2.44l 2 + FZ 2
# D
#
( )
( ) , where λ is the wavelength of the
[image:7.595.71.523.68.283.2]4. Conclusion
The x-ray spatial profile from a high intensity laser-solid interaction results in a dual-source structure. The central channel dominated by fast electrons on theirfirst pass through the target and a larger substrate source from recirculating electrons spreading laterally during their multiple passes through the target. Experimental results demonstrate a
×(10±2)increase in the ratio of the central source to the substrate source, suggesting a way to increase the quality of
x-ray radiographs by optimising this ratio and the flux.
Through analytical modelling we are able to probe this rela-tionship as a ratio between escaping, attenuated, and recir-culating electrons and present optimum laser intensities for varying target parameters. The model provides good agree-ment with the experiagree-mental data, in terms of both the ratio between central and substrate x-rayflux and the total central x-rayflux produced.
Acknowledgments
This work was supported by the Newton Fund for STFC UK-China Laser driven Ion and THz, NSFC grant 11520101003,
EPSRC grants EP/K022415/1 and EP/R006202/1, and the
STFC IPS grant ST/P000177/1. We also acknowledge the
use of the EPOCH PIC code(developed under EPSRC grant
EP/G054940/1) and the computing resources provided by
STFC Scientific Computing Department’s SCARF cluster.
Data associated with research published in this paper is accessible at:https://doi.org/10.15129/ b5afec6a-f3fa-463b-b0a7-436b999229c5.
ORCID iDs
C D Armstrong https://orcid.org/0000-0003-2083-8487
N C Woolsey https://orcid.org/0000-0002-2444-9027
P McKenna https://orcid.org/0000-0001-8061-7091
025007
[9] Chen C Det al2008Rev. Sci. Instrum.79130–3
[10] Meadowcroft A L and Edwards R D 2012IEEE Trans. Plasma Sci.401992–2001
[11] Rusby D, Gray R, Butler N, Dance R, Scott G, Bagnoud V, Zielbauer B, McKenna P and Neely D 2018EPJ Web Conf. 16702001
[12] O’Neill D M, Lewis C L S, Neely D, Davidson S J, Rose S J and Lee R W 1991Phys. Rev.A442641
[13] Moore C I, Knauer J P and Meyerhofer D D 1995Phys. Rev. Lett.742439–42
[14] Wei M S, Solodov A A, Pasley J, Stephens R B, Welch D R and Beg F N 2008Phys. Plasmas150–7
[15] Scott R H Het al2012Phys. Rev. Lett.1091–5
[16] Yuan X Het al2010New J. Phys.12063018
[17] Hegelich Met al2002Phys. Rev. Lett.89085002/1
[18] Poyé Aet al2015Phys. Rev.E91043106
[19] Chen H and Wilks S C 2005Laser Part. Beams23411–6
[20] Mackinnon A J, Sentoku Y, Patel P K, Price D W, Hatchett S, Key M H, Andersen C, Snavely R and Freeman R R 2002 Phys. Rev. Lett.882150061
[21] Sentoku Y, Cowan T E, Kemp A and Ruhl H 2003Phys. Plasmas102009–15
[22] Myatt J, Theobald W, Delettrez J A, Stoeckl C, Storm M, Sangster T C, Maximov A V and Short R W 2007Phys. Plasmas14056301
[23] Neely D, Foster P, Robinson A, Lindau F, Lundh O, Persson A, Wahlstrom C G and McKenna P 2006Appl. Phys. Lett.8987–90
[24] Fiorini F, Neely D, Clarke R and Green S 2014Laser Part. Beams32233–41
[25] Ovchinnikov V M, Schumacher D W, McMahon M, Chowdhury E A, Chen C D, Morace A and Freeman R R 2013Phys. Rev. Lett.1101–4
[26] Green J Set al2008Phys. Rev. Lett.100015003
[27] Lancaster K Let al2007Phys. Rev. Lett.98125002
[28] Coury Met al2013Phys. Plasmas20043104
[29] Musgrave I, Galimberti M, Boyle A, Hernandez-Gomez C, Kidd A, Parry B, Pepler D, Winstone T and Collier J 2015 High Power Laser Sci. Eng.3e26
[30] Bradford Pet al2018High Power Laser Sci. Eng.68
[31] Liu Het al2018Rev. Sci. Instrum.89083302
[32] Houck T L and Richardson R A 1998Roll bar x-ray spot size measurement techniqueNo. UCRL-JC–130427 Lawrence Livermore National Laboratory pp 908–10
[33] Courtois Cet al2009Phys. Plasmas16013105