Beyond Actions: Exploring the Discovery of Tactics from User Logs
Jiyin He
a, Pernilla Qvarfordt
b, Martin Halvey
c, Gene Golovchinsky
baCentrum Wiskunde & Informatica, Science Park 123, Amsterdam, the Netherlands bFX Palo Alto Laboratory, Inc., 3174 Porter Drive, Palo Alto, CA, USA
cDepartment of Computer and Information Sciences, University of Strathclyde, Glasgow, G1 1XQ, Scotland, UK
Abstract
Search log analysis has become a common practice to gain insights into user search behaviour; it helps
gain an understanding of user needs and preferences, as well as an insight into how well a system supports
such needs. Currently, log analysis is typically focused on low-level user actions, i.e. logged events such
as issued queries and clicked results, and often only a selection of such events are logged and analysed.
However, types of logged events may differ widely from interface to interface, making comparison between
systems difficult. Further, the interpretation of the meaning of and subsequent analysis of a selection of
events may lead to conclusions out of context—e.g. the statistics of observed query reformulations may be
influenced by the existence of a relevance feedback component. Alternatively, in lab studies user activities
can be analysed at a higher level, such as search tactics and strategies, abstracted away from detailed
interface implementation. Unfortunately, until now the required manual codings that map logged events
to higher-level interpretations have prevented large-scale use of this type of analysis. In this paper, we
propose a new method for analysing search logs by (semi-)automatically identifying user search tactics
from logged events, allowing large-scale analysis that is comparable across search systems. In addition, as
the resulting analysis is at a tactical level we reduce potential issues surrounding the need for interpretation
of low-level user actions for log analysis. We validate the efficiency and effectiveness of the proposed
tactic identification method using logs of two reference search systems of different natures: a product
search system and a video search system. With the identified tactics, we perform a series of novel log
analyses in terms of entropy rate of user search tactic sequences, demonstrating how this type of analysis
allows comparisons of user search behaviours across systems of different nature and design. This analysis
provides insights not achievable with traditional log analysis.
Keywords:
Search behaviour, search tactics, log analysis
1. Introduction
Understanding how people use interactive search systems can be expensive in terms of time, money,
resources etc. With this in mind, almost every search system, ranging from lab studies up to commercial
search engines, keeps a usage log of the system. These logs provide a persistent record of interactions
that users have had with these search systems. Analysis of these logs often yields important insights into
user search behaviour that help to understand user needs and preferences, as well as providing insight into
the performance of a system in supporting user needs. Logs can be used to study how users approach
a particular type of search task and provide guidelines and suggestions for informed system design, e.g.
[
53
,
52
]. Logs can also be used to perform formative or summative evaluations of search user interfaces
using A/B testing for example [
35
], where statistics of a specific logged event often serve as an online
metric. For instance, click-through rate from major Web search engines are often considered the primary
source for inferring user preference in search results [
32
].
Current log analyses, in particular analyses of large-scale logs from commercial search systems, are
focused on low-level user actions, i.e. logged events such as keyword queries and result clicks. Further,
typically only a selection of such events are being analysed, as demonstrated by studies that are focused on query logs, e.g. [6,27,31,5,40]; click logs, e.g. [32,17,10]; dwell time, e.g. [39,34], etc. Despite the benefits gained (in part because of the ease and scale) from current log analyses there are also some drawbacks, most prominentlyinterpretabilityandcomparability.
Interpretability. During a course of search, users interact with various components of a system, and these interactions together advance the progress of their search task. Analysis based on a selected single type of logged event may lead to an interpretation of the event out of context, and thus observations of biased statistics. This may not be obvious with logs from a system equipped with a standard 10-blue-links search interface, where interpretation of logged events is relatively clear: e.g. clicks as users perceive results being relevant [32] and mouse hovers as users inspect result summaries [30]. However, as modern search interfaces become increasingly complex, allowing more dynamic user interactions beyond the traditional query-ranked list interactions, the problem becomes more promi-nent. The reason for issues surrounding interpretability is two-fold. (1) The interpretation of a logged event can be ambiguous, and the same user action may have different intentions depending on the context. For instance, when hovering over a result summary, instead of reading this particular summary, the user may be just skimming over the result list. The context of this action provides in-dications of its actual intention: e.g. the latter is more likely if it is shortly followed by a hover over another result, while the former is more likely if it is followed by an action such as book-marking the result. (2) The observed statistics of particular types of logged events are not independent from interactions enabled by other components of the search interface, as it may be possible for users to achieve the same outcome via different operations. For instance, users often need to reformulate their search multiple times before reaching their search goal. However, with a system equipped with a relevance feedback component, the observation that users perform fewer query reformulations does not necessarily mean that they spent less effort as they may have been using the relevance feedback component as an alternative way to modify their searches.
Comparability. The types of events that can be observed from a search log depend on the design of the system and the interactions allowed by the search interface, which may vary widely from system to system. This makes a direct comparison of the observations between systems very difficult. It is also difficult to compare user interactions involving different content types— even with similar system designs. For instance, it would be difficult to compare user activities recorded in the log of a video search system [25] to those logged by the image search systems that inspired its development [8,50,43]—as the type of low-level user actions recorded as logged events would be inherently different, although the actual type of the intended interactions may be the same—e.g. to “examine” a result, users would “play” a video, but “look at” an image.
challenging and open research problem, with a solution opening a range of new possibilities for analysis of search interaction at large scale.
In this paper, we take a step beyond the above attempts [55,19,26] towards a solution for analysing user search behaviour at a tactical level, specifically, we seek answers to the following research questions:
Q1 How do we identify search tactics from search logs in ascalableandinterpretablemanner?
To answer this research question we use log files from two interactive search systems, namely ViGOR (an exploratory video search system [25]) and Querium (an asynchronous collaborative exploratory search tool [18]), more details on both systems can be found in Section 3. Using the logs from both search systems we present methods for efficient construction of a human annotated training set for tactic identi-fication, which reduces effort involved in determining tactics making the approach more scalable from a human effort perspective. From this training set statistical models are then learnt to automatically identify tactics that correspond to human interpretations from unseen action sequences (See Section4). With an automatic method, our approach enables applications to scale to large logs; and by using a supervised learn-ing method, it links logged events to states associated with human interpretations. We empirically validate the effectiveness of our tactic identification method using logs from two reference systems that are of very different designs and content types (See Section5). One key aspect of this analysis is that we illustrate how human intervention, via training set construction, can be minimised. Meaning that this method can be applied with little extra effort above what would be normal for log file analysis, thus making our approach scalable.
Having been able to identify search tactics from sequences of logged events, we further investigate:
Q2 How do we use the identified tactics to compare user search activities across different systems?
To this end, we perform a series of illustrative analyses that compare the patterns of search tactics employed by users of our two different reference systems. In particular, we demonstrate how we can compare patterns of user search tactics quantitatively using standard statistical tools (see Section6).
The remainder of this paper is organised as follows. In Section2we discuss related work in search log analysis. In particular, we discuss a range of different approaches that have been proposed to manually, semi-automatically and automatically determine search tactics from search logs. Each method has its advantages and disadvantage; we differentiate these approaches from our method, which aims to address some of the common disadvantages of the approaches outlined. In Section3, we introduce the two search systems whose logs are used as reference data in our study. We present our search tactic identification method in Section4. We take a supervised approach using human-annotated data, where the hidden states correspond to tactics that have explicit associations with human interpretations of the data. In Section5, we evaluate the effectiveness and efficiency of our approach and demonstrate that powerful interpretations can be made with minimal manual effort. Further, in previous studies, analysis of user tactics have mostly focused on comparing frequencies of tactics or sequences of tactics employed. In Section6 we provide an alternative analysis method that summarises patterns of user tactics into single statistics and allows statistical testing for comparing user behaviours across different search systems and user groups. Finally, in Section7, we reflect on the proposed tactic identification method and tactic-based log analyses as well as providing a conclusion for the paper.
2. Related work
2.1. Action level log analysis
Analyses of (Web) search logs are typically focused on a small number of logged events (i.e. user actions) such as queries, result clicks, mouse movements, as well as dwell time. These logged events are seen as indicators reflecting underlying user needs, preferences, or search approaches. A wide range of models have been developed to identify patterns from logged events and to translate these indicators to an interpretation of user search behaviour.
Queries. Individual queries have been used for classifying users’ search intent. Broder [6] classified Web searches as informational, navigational or transactional based on an analysis of logged queries and user sur-veys. Rose and Levinson [47] expanded on Broder’s classification by adding a resource-seeking category. In their expert-based log analysis, they found that navigational searches are less prevalent than generally believed, while resource-seeking queries may account for a large fraction of Web searches. Classifying intent is problematic, however, as recent research has shown [51].
Sequences of queries have been studied with the aim of abstracting away from individual queries to a higher level representation of users’ search intent, tasks or missions [40,41, 23]. In addition, patterns of query reformulations have been studied to understand users’ strategies for formulating their search needs [31,7,5,15,27,29]. He et al. [28] proposed translating various user operations on search results (e.g. filter, find similar, etc.) as direct and indirect query reformulations, creating a single representation for user interactions with results across systems with different interface designs.
Click Analysis. Using large-scale click logs from commercial search engines, researchers have developed a variety of stochastic models to capture patterns of, and to predict, user interactions, such as selection of search results or navigating between pages of search results. Examples are models for identifying patterns of typical user browsing behaviour [16], predicting user selections [17,20,21,58,10] or deriving system performance [13].
Dwell time and mouse moves. Some studies have focused on dwell time [39,34] and mouse move-ments [38] as alternatives to queries and clicks. For instance, to model user behaviour with respect to clicks on relevant and non-relevant documents, Kim et al. [34] studied post-click dwell time and Guo and Agichtein [22] studied post-click mouse movement and scrolling. Lagun et al. [38] proposed to identify salient sub-sequences of user mouse movements and use these sub-sequences as a feature for improving estimation of document relevance.
While it is feasible to infer a user’s short term intent or perception of relevant information from queries, mouse clicks or other user interaction described above, it is difficult to infer high-level search tactics and strategies that a user employs to advance his/her search. A common assumption shared by the above re-search is that users are interacting with a standard “10 blue links” re-search interface, with which limited user interactions are allowed. However, in a different user interface model the same observations, conclusions and models may not generalise due to the interpretability and comparability issues highlighted in Section1. In this paper, we present a search log analysis method that abstracts user interactions from specific actions to a higher-level representation, i.e. search tactics. This allows not only analysis of user search behaviours in context, but also comparison between user behaviour recorded in logs from different search interfaces, whether the standard “10 blue links” interface or advanced interfaces employing richer interac-tion models. It should be noted that while many benefits can be gained with our proposed method, it is not a replacement for the traditional log analyses. Rather, our method offers a different lens to view logs, which we believe allows exploitation of the rich resources available in log files to provide a deep understanding of user search behaviour.
2.2. Beyond actions Search tactics
and revision of specific terms used. The tactics Bates formulated include some that are only cognitively manifested, while others are manifested in the interaction with a search system (hence possible to infer based on information in log files).
Later, Marchionini [42] proposed an alternative model of search tactics which consists of eight stages and focuses on describing possible transitions between them. The eight stages are “recognise accept,” “de-fine problem,” “select source,” “formulate query,” “execute query,” “examine result,” “extract information,” and “stop reflect.” In our opinion, Marchionini’s model provides a better match (than Bates’) for modern information retrieval, using, for instance, a Web-based search system, in comparison to Bates. Further, this model is attractive since it captures the search process on a level independent of search system or user interface.
Belkin et al. [3] applied models of information-seeking dialogues to model search in information re-trieval. Here, interaction is modelled at different levels: dialogue structures, cases, and scripts. Since this model builds on a dialogue model, both user’s and system’s responses are modelled. Wilson et al. [54] combined search tactic models developed by Bates [1] and Belkin et al. [3] into a unified framework. This framework aimed to predict how well a system meets user needs on a tactical level. Wilson et al. applied their framework for heuristic evaluation of three faceted search interfaces to estimate how well the user interface supports different search tactics.
Tactics offer an abstraction from the implementation details of a particular search system and the ability to capture the information seeking process. That being said, it can be costly to encode user interactions into tactics, especially compared to the cheaper but less deep log analysis option. Further, the various infor-mation seeking behaviour models presented in the literature provide abstraction of user search behaviour at different levels and from different perspectives, leaving many options when choosing a target model to encode user search tactics. Similar to Wilson et al. [54], in our approach, we encode user tactics more associated with the functionality of a system, and less with the cognitive activity of the users. An important difference, however, is that Wilson et al. used experts to project their hypothesised tactics to the function-ality of the evaluated systems, while we project search tactics to actual user activities recorded in log files. In practice, our work could be used to validate Wilson’s work given the availability of search logs, but we reserve this for future research.
From actions to tactics
Research on users’ search tactics typically relies on manual coding to map observed user actions to search tactics. More recently, a number of studies have attempted to automate this process.
Downey et al. [16] aimed to model search actions to predict what the user will do next in a standard ”10-blue link” search system. For this purpose, they developed the Search Activity Model to describe the temporal dependency between user search actions and predict a user’s next action. While this model does not aim to identify search tactics from usage logs, it provides a general language for describing all kinds of user browsing and searching activities with a standard Web search engine that considers user actions in context. However, as it directly models the action level patterns, the issue of comparability remains, as with other action-based user behaviour models.
Han et al. [26] proposed an automatic tactic identification approach using unsupervised Hidden Markov Models, where tactics are modelled as hidden states and user actions as recorded in usage logs are modelled as observables. Bayesian Information Criterion (BIC) was used to determine the number of hidden states that best fit the data. Specifically, in [26], 5 actions (submit query, click on search result, save a result summary, comments on a saved item, and comment on topic statement) were mapped to 5 HMM states. After the fact, the HMM states were mapped as tactics using Marchionini’s ISP model [42]. Using the same approach, Yue et al. [57] modelled individual and collaborative search using the same search system. The difference to the logs in Han et al. [26] was that a chat channel was turned on during collaborative search. Two models were created: an individual search model with 4 hidden-states and a collaborative search model with 6 hidden-states. It is interesting to note that the same search system with the difference of a chat channel creates very different models using automatic statistical modelling.
that there is a one-to-one mapping between actions and hidden-states, i.e. one action can only be indicative of one tactic. With this model, actions that are ambiguous or context dependent would need to be filtered out before the model is built. This line of research is closely related to the work presented in this paper. However, instead of using an unsupervised approach, we take a supervised approach and look into methods for efficient manual annotation, thus the learnt mapping between user actions and tactics are associated explicitly with human interpretations.
Analysis of tactics
Multiple studies have used tactics as a means to characterise user search patterns. Of particular interest are studies focused on modelling transition patterns between tactics as a model of how users advance their search via sequences of tactics.
Chen and Cooper [12] examined the transaction logs from a university library search system. They defined search states corresponding to Web-pages in the structured search system and fitted a continuous-time semi-Markov model to these states. To group users, clustering was applied on usage characteristics of search sessions; and these clusters, or user groups, were compared in terms of the transition patterns between search states. Chen and Cooper found that the group exhibiting high interactivity with good search results had a fourth-order sequential dependency, meaning that the current state depended on the previous four states, while other groups had a third-order dependency. They also compared different user groups using the same system with a chi-square analysis on the state transition probabilities.
Using image search, Goodrum et al. [19] examined and categorised transitions between search states. In their study, the steps participants took during the search process were recorded, and these search scripts were manually coded into one of eighteen search states. To examine transition patterns between states, Maximal Repeating Pattern analysis was used, where strings of states are analysed to identify the longest repeating pattern. The identified patterns and transitions between patterns were reported with frequencies. However, no attempt was made to align these patterns with established search tactics.
Xie and Joo [55] studied transition patterns of user search tactics derived from a lab study where 31 participants each created two Web search tasks based on their own search needs using a variety of search engines and tools. User intentions were gathered using a think-aloud protocol during the search session. All search sessions were recorded using a usability testing tool and the recorded search sessions were manually coded by experts for search tactics and transitions. This method gives the researchers access to both the user’s reasoning and their interactions during the search sessions. This material is much more detailed than can be expected from a typical search log and is also much more expensive to gather in terms of time and effort than a typical search log. To study transition patterns of user tactics, the authors defined a set of search tactics for Web search by extending Bates [1]’s and Marchionini [42]’s models. A fifth-order Markov chain was then applied to calculate the most common search strategies represented by patterns of tactic transition that occurred at the beginning, middle and end of each search session. They found that participants used different search tactics depending on the phase of the search session.
Similar to Chen and Cooper [12] and Xie and Joo [55], our proposed method identifies search tactics from logs, and we analyse user search tactics in terms of their transition patterns based on a Markov chain model. However, instead of a heuristic comparison of pattern frequencies, we summarise tactic transition patterns into a single statistics in terms of entropy rate of Markov chains, with which analysis can be performed with standard statistical tools.
3. Reference systems
In this section, we provide an overview of the systems we used for exemplifying our proposed method. The log data we use as an example and to validate our method are generated from Querium [18,45] and ViGOR [25]. Both logs contain usage data collected during two different experimental studies. Each study had two conditions, one control and one experimental, where the control condition was a baseline system and the experimental condition included novel search features beyond the baseline system.
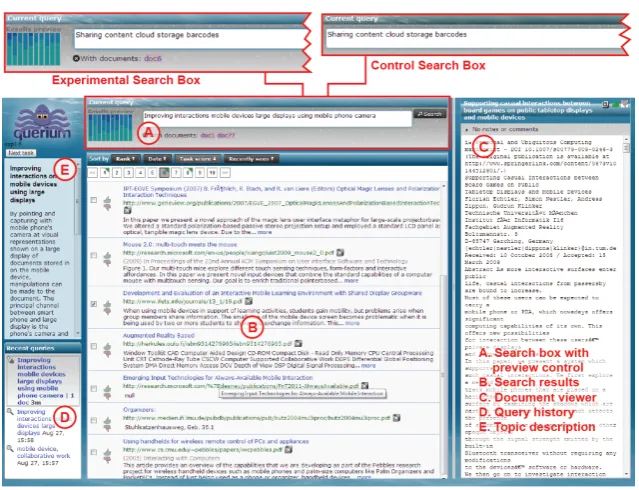
Figure 1: Screenshot of Querium interface with parts of the user interface marked. In the experiment two versions of the search box were used (top of figure).
save documents, perform relevance feedback (RF), etc. Querium makes it possible to perform relevance feedback by checking one or more check boxes next to document snippets in the results list, and re-running the search. Terms drawn from selected documents are used to expand the query.
In the present work, we used logs collected with a version of Querium particularly instrumented for studying the effect of a preview widget [45]. Querium was connected to a snapshot of the CiteSeer database of academic papers, containing about two million documents. The search UI (Figure1) organises the display into several regions: the query area (A), the search results (B), a query history (D) and the document display area (C). PDF documents were replaced with their extracted text because the browser used in the study could not display PDFs. Finally, the task the participants were working on was shown in topic description (E). To study the effect of the preview widget, an experimental condition was compared with a control condition. In the control condition, all components except the preview widget in the query area (A) were present. The preview widget visualises the number of new documents a new query would retrieve if the user would run it, as well as the number of previously retrieved and viewed documents within the current search session.
The log of Querium contains data from 13 subjects collected while performing searches on 6 different tasks, resulting in a total of 78 search sessions. Each task lasted for about 15 minutes. The experiment used a within subject design. For more details about the experiments see [45].
ViGOR. ViGOR [25] is a video retrieval system that allows users to group video shots in order to facilitate video retrieval tasks. The aim of the system is to allow users to visualise and conceptualise many aspects of their search tasks in one workspace and to allow users carry out a localised search using groups in order to solve an overarching search problem.
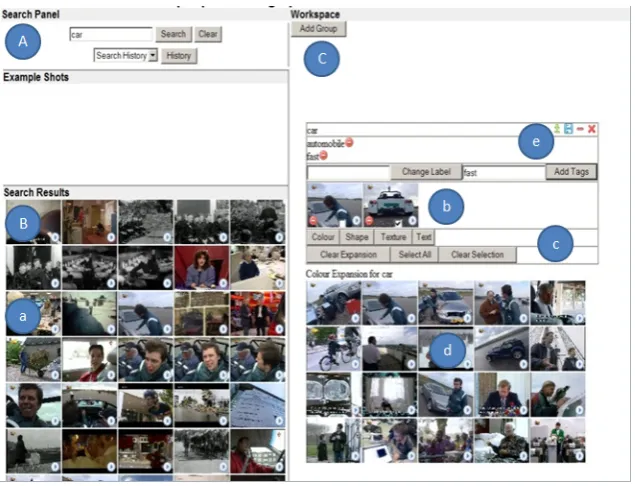
Figure 2: Screenshot of ViGOR interface with user interface parts (A: Search Panel, B: Search Results, C: Workspace) and user action functions marked (a: inspect search results, b: group videos, c & d: formulate query expansions, e: manipulating groups.)
Groups are created by clicking on the create group button. Users must then select a textual label for the group and can add any number of annotations to describe a group. Each group must have at least one annotation. Drag-and-drop techniques allow the user to drag videos into a group or reposition the group within the workspace (b). Groups can be deleted, minimised and moved around the workspace using a number of buttons (e). The workspace was designed to accommodate a large number of groups. Groups can be used as a starting point for further search queries. Users can choose to view an expansion of the group that contains similar videos based on a number of different features (c, d). ViGOR offers three expansion options for each group 1) similar colour; 2) similar shapes, which retrieves videos using edge histograms 3) and similar homogenous texture.
The log of ViGOR contains data from 24 experimental sessions with 16 participants, 8 novices and 8 experts. Expertise is based on experience of video search using TRECVID data [48]. Each novice completed 2 experimental sessions and each expert 1 experimental session. Each experimental session consisted of 4 TRECVID 2007 interactive video retrieval tasks, resulting in a total of 96 search sessions. All participants used ViGOR in two conditions. In the control condition the participants used a system resembling YouTube (i.e. ViGOR without the workspace) and in the experimental condition they used ViGOR as outlined above. The main difference between the two conditions was the availability of the workspace. For more details about the experiments see Halvey and Jose [24].
4. ESTI: Method for Efficient Search Tactic Identification
In this section, we describe a four step method for efficient development of a model for analysing search logs, with the purpose of identifying tactics. This method attempts to address our first research question, namely,How do we identify search tactics from search logs in a scalable and interpretable manner?
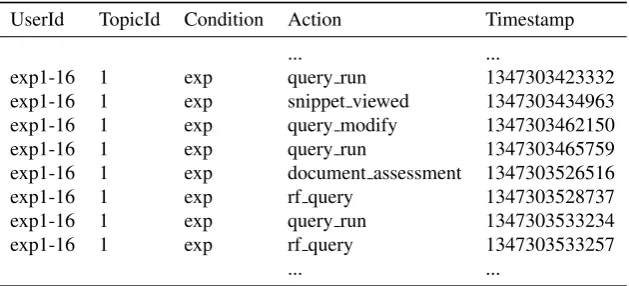
UserId TopicId Condition Action Timestamp
... ...
exp1-16 1 exp query run 1347303423332
exp1-16 1 exp snippet viewed 1347303434963
exp1-16 1 exp query modify 1347303462150
exp1-16 1 exp query run 1347303465759
exp1-16 1 exp document assessment 1347303526516
exp1-16 1 exp rf query 1347303528737
exp1-16 1 exp query run 1347303533234
exp1-16 1 exp rf query 1347303533257
[image:9.595.145.460.108.251.2]... ...
Table 1: An extract from the parsed action sequence of the Querium usage log with Action and Timestamps of each action. Each entry have user (UserId), topic (TopicId) and experimental condition (Condition) noted.
is that while there are various steps in our method which will result in comparable tactic representations for different search logs, there is some flexibility in how that representation is derived depending on data, resources etc. Some of the steps in our method are prescriptive and some are achievable through different approaches. The process of identifying search tactics from log data can be summarised into the following sequential steps:
S1. Action parsing from log data: parse the log and prepare the data to provide necessary information for tactic identification.
S2. Identify target search tactics: decide on a set of tactics that are supported by the system and can be observed from system usage.
S3. Action segmentation: segment action sequences in a log into meaningful units e.g. that can be inter-preted as search tactics.
S4. Tactic classification: classify the action segments into target search tactics.
The major challenges for analysing log files to infer tactics is (1) to segment the stream of actions into meaningful units and (2) to classify these action segments as a tactic. These challenges are captured in the steps S3 and S4. It is also in these steps, that we seek automatic methods to support human annotation. Below, we explain the purpose and challenges within each step. Further, using the data from the reference systems as examples, we detail our proposed tactic identification method, including the tools and algorithms we have developed and explored to facilitate each step.
4.1. Action parsing from log data
Log data comes in many shapes, for ESTI we expect that one or more people have interacted with a system to perform some search tasks, and that interactions are recorded in a log file as a sequence of discrete events (actions) of a finite number of types. The records are ordered temporally. For instance, with a typical Web search interface the types of log events could beissue query, click result, click result. The log data is parsed into a sequence of actions to prepare it for search tactic identification. During this parsing process, any information that can provide additional information for the tactic identification is recorded. In our case, we recorded dwell time duration between actions. The sequence of actions should preserve the order of events.
4.2. Identifying target search tactics
To map action sequences to search tactics, a set oftarget tacticsneeds to be defined. This set of pre-defined tactics are used as candidate labels for tactic classification (see Section4.4). In the classification stage, our annotators or classification algorithms will select tactics from the target tactic set as labels and assign them to action segments in the log.
Various models of information seeking behaviours have been proposed in the literature [1,42,3]. One may approach the selection of a target tactic model in a number of ways. For instance, from a system point of view, one can select tactics that are supported by the system features; or from a search task point of view, one can select tactics that are typically employed for a specific search task as discovered in the literature.
For this work, the target tactic model was chosen based on our system features and Marchionini’s model. We expanded Marchionini’s model since exploratory search systems generally include functions for organising search results. Also the tactics are at an operational level rather than at a cognitive level. Han et al. [26] adopted a similar approach of using a subset of tactics for their method which attempts to map tactics to HMM hidden states. Of course, this does not preclude any further studies from using models that include cognitive search tactics, e.g. Bates’ tactics [1], with our proposed method—if information about users’ cognitive activities is available and can be represented for quantitative analysis.
Further, a meaningful set of target tactics should satisfy two conditions: (1) the pre-defined target tactics should be supported by the underlying system; and (2) it should allow the identified action segments to be mapped to the target tactics. For instance, using a log with only queries recorded, we would not be able to identify actions and derive tactics relating to users interactions with the search results. Therefore, when deciding if a tactic should be included in the target tactic set, we consider whether this tactic can be associated with the observable user actions recorded in the search log. We present the target tactics we used in Section5.2.
4.3. Action segmentation
In this step, we group the parsed actions into action segments that likely correspond to a search tactic. Critical for the segmentation is that actions are grouped meaningfully and can easily be interpreted by human annotators. If the segments are only slightly different from the raw actions, it would be hard to gain any insights into a user’s tactical decisions beyond the actions employed by the user. On the other hand, action segments that are too long can be hard to interpret as representing a single tactic.
Manually going through each user action recorded in a search session and deciding when and where a segment should be formed is far from trivial. To minimise the effort in segmenting the actions, we explored alternative approaches to manual segmentation, namely heuristic rule based automatic segmentation and statistical model-based segmentation.
Manual segmentation
During manual segmentation an annotator goes through a sequence of recorded action events, and for each action decides whether or not this action is the start of a new tactic based on his/her interpretation. If there is more than one annotator, this process is typically followed by a stage where multiple annotations are compared and merged through discussion or other means to achieve agreement.
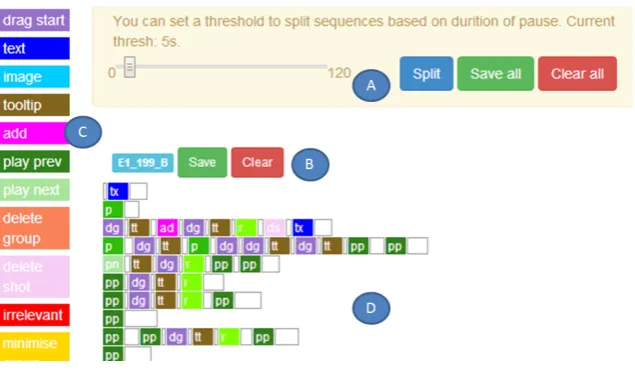
Manual segmentation is time consuming. We developed an online annotation tool (Figure3) to assist manual segmentation. This tool allows actions to be separated based on dwell time between actions on a global and local level. The slider can be used for setting different thresholds on the dwell time for a global split. A human annotator can then look over the resulting segments and combine or further split specific segments by clicking on the white segments representing dwell times in the user interface. The actions are colour-coded, where semantically related actions are assigned similar colours to provide annotators with a better view of related actions.
Figure 3: Screenshot of our segmentation tool. User can set a threshold in seconds for splitting segments (A). The user can then view segments for each log (D). If segments are not satisfactorily split, they can be combined or further split by clicking on white segments between or after actions. A legend describes the coding scheme for the actions to facilitate interpretation of segments (C). A user can save or clear segmentation if they wish (B).
Heuristic rule based segmentation
Segmentation can be determined by a number of factors, such as the dwell time duration before or after an action, combination patterns of actions, etc. One simple segmentation rule is to use a threshold on dwell time, e.g. one may assume that a user would start doing something different after a long period of inactivity. Similar heuristics have been used for identifying query sessions in other query log analyses [9,49]. However, when looking closely into the resulting action segments using this approach, we found that thresholding durations was fairly error prone. Sometimes even a quite short dwell time could indicate a shift in tactic, and sometimes a long dwell time did not indicate a shift in tactic. Further, each action in our two reference logs has a different distribution of dwell times, e.g. it generally takes longer for a user to play a video than to do a pagination. Therefore we found that a global time thresholding was not likely to work.
Hence we explored heuristic rules that are more context dependent than a simple dwell time threshold. The annotators discussed and agreed on strategies to segment the action sequences based on their obser-vations and interpretations and formalised them into as set of guidelines (L1 — L4 below) for automatic segmentation. To begin with, each action was assumed to formulate an individual tactic. We then derived a guideline, identifying four situations when consecutive actions can be merged into a segment. Although this guideline was developed with our two example systems in mind, we believe it applies to other search systems as well.
L1. Repeated actions. Users sometimes repeatedly perform an action, e.g. continuous book-marking of relevant documents or continuous pagination for a quick scan through the results. In these cases users do not switch tactics. However, caution needs to be taken as actions can sometimes be ambiguous— with the same recorded action event the user may be doing different things given different context, e.g. the dwell time after/before the action. See also discussion in Section4.4.
L2. Semantically close actions.Users may perform actions that serve similar purposes. For instance, users may attempt to reformulate their queries by performing relevance feedback or by directly modifying their query in the query box. While a user may switch between these two semantically close actions (i.e. relevance feedback and revising query), the user does not change tactic.
L4. Unintentional pre- and -post actions. Some recorded action events can be triggered unintentionally. This is often a result of a specific design of the interface and the logging system. For instance mouse hover over a snippet is a commonly recorded event in our logs. Our reference system Querium (Figure1), has a “thumb-up/thumb-down” button in front of each snippet. When users attempt to select this button, it is very likely that they would move the mouse over the snippet, which may unintentionally trigger a mouse-hover-over-snippet event. Unintentionally triggered actions should be merged as pre- or post-fix of the intended action. However, a mouse-hover event with a longish pause is likely an intentionally triggered event.
With the above guidelines, heuristic segmentation rules were generated by analysing merging condi-tions between each of the action events as identified from the action parsing step. The resulting rules are specific to each of the systems being analysed. We specify the rules discovered from our reference logs in Section5.
Compared to manual annotation, a heuristic rule-based approach saves the effort of manual marking every segment boundary. However, the derived rules’ completeness depends on how many action sequences the annotators have seen in a log, as well as how much the action sequences vary within a log. For a small log, the annotators can scan through all sequences and derive a relatively complete set of rules. For a large log, e.g. a log of Web scale, it would be difficult to derive a complete set of rules, unless users are provided with very limited interaction modes, and behave more or less the same. In addition, these rules can be combined with manual correction to annotate a set of training data, which can then be used to learn more sophisticated models which are more likely to generate to unseen cases. Below, we discuss one type of such models based on statistical learning.
Statistical model-based segmentation
An alternative method to automate the action segmentation process is to train a statistical model on action segments. While this is possible, classifying action segments identified with manual or heuristic methods may not be the most efficient approach. Such an approach would require yet another statistical model for classifying tactics from action segments. Instead, we define a statistical model that performs the segmentation and search tactic classification in one step. In Section4.4where we discuss tactic classifica-tion we describe the statistical model we used to do this.
4.4. Tactic classification
After obtaining the action segments we can assign them to a predefined target tactic. In practice we identified the following three situations:
one-to-one mapping. In this case, one action corresponds to one particular search tactic. However, if all action segments have a one-to-one relation with a target tactic, then the task of classifying search tactics is trivial and analysis based on tactics would not provide insights beyond the action level.
many-to-one mapping. In this case, a tactic can correspond to multiple unique action segments. This means, a user can achieve the same goal via different types of interactions with the system. For example, users can reformulate a query by applying relevance feedback or directly modifying the query text. In these cases the different types of actions areunifiedto the same tactic.
one-to-many mapping. In this case a single action can be interpreted as different tactics given different context. For example, mouse hovering over a result summary may indicate the user is inspecting the summary; it can also be that the user is skimming through the result list and the mouse quickly moves across the summary; or it may be unintentionally triggered because of the design of the interface and logging set-up as discussed in L4. In cases like this, actions need to bedisambiguatedby taking into account context for a better interpretation in terms of search tactics.
Manual classification
Similar to the manual segmentation process, we refer to the manual classification process as individual annotators assigning each action segment to a predefined target tactic based on his/her interpretation. This shares the same pros and cons as the manual segmentation process. In fact, the annotators may perform this task in parallel with action segmentation: when deciding if a series of consecutive actions should form an action segment, he/she may have made an interpretation ofwhichtarget tactic it corresponds to.
Heuristic rule-based tactic classification
Our approach to heuristic tactic classification consists of a general procedure and naturally, a set of specific rules. The general procedure has the following steps. (1) Classify single actions: each action of the users can be associated with an interpretation of the type of the tactic the user is applying; since some actions are ambiguous, context is needed to determine its label. (2) Classify action segments based on interpretations of single actions: Most likely, the meaning of a combination of actions would not be independent from that of the individual actions it contains. However, depending on specific combinations (e.g. cases L1 — L4 as listed in Section4.3), different rules may apply. For situations L1 and L2, the segment label has the same label as its individual actions, as all actions in the segment would have the same tactic label. For L3, specific rules need to be formulated case-by-case. For L4, the segment label takes the label of its “main action”, and similarly, rules to identify the “main action” need to be formulated on a case-by-case base.
To apply the above procedure, a set of specific rules need to be specified, including:
(a) the mapping between each individual action and the predefined target tactics; (b) rules to disambiguate ambiguous actions;
(c) rules that handle L3 segments; and
(d) rules that determine the “main action” from an L4 segment.
These rules are specific to each system and its log. In Section 5, where we examine and validate our approach, we describe the specific rules derived for our reference logs.
Statistical model-based tactic classification
Given anunsegmentedsequence of user actions, our goal is to assign each of the actions to one of the target tactics. This way the classifier simultaneously determines the boundary of the action segments and their corresponding tactic types. That is, an action segment contains consecutive actions that are assigned with the same target tactic. Labelled training data is used for identifying features of the action and its context, i.e. its precedent action, to create a model for assigning tactics to actions.
We start with a formal statement of the labelling problem. LetA = a1, . . . , an be an unsegmented but observed action sequence of lengthn, andT be the set of target tactics identified in a log. Also, let
T =t1, . . . , tnbe an unobserved sequence of tactic labels, whereti ∈ T, andticorresponds to the tactic assignment to actionai. To construct a model that predicts the mapping betweenAandT, we need a set of labelled training dataDthat consists of a set ofA’s, annotated with their correspondingT’s.
Many approaches have been proposed to solve this kind of sequence labelling problem, e.g. hidden Markov models (HMMs), conditional random fields (CRFs), structural SVMs [44] etc. The performance of these different approaches depends on the specific task [44] as well as the implementation details of the methods [33]. An extensive comparison of different approaches and their implementation details is out of the scope of this paper. We choose a CRFs [37] approach for our labelling problem. It has shown state-of-the art performance in a wide range of similar applications [37,33], and has the flexibility of allowing rich feature integration when compared to a generative model such as HMMs. Specifically, we define a conditional probabilityP(T|A), i.e. the probability of observing an assignmentT given action sequence
Aas follows:
p(T|A) =Z1(A)expPn
i
Pm
k λkfk(ti−1, ti, ai, i). (1)
large positive weight means it is very likely that a tacticxis followed by a tacticy. The termZ(A)is a normalisation factor that makes sure the likelihood is between 0 and 1.
GivenD, the goal of the learning procedure is to find a set ofλ’s that maximise the log-likelihood of
D(as summed over all sequences inD). With the learnt weights, Eq.1can be used to score and find the best labels for an (unseen) action sequence.
4.5. Summary
Our method for identifying search tactics from usage logs consists of four steps, namely, action parsing, target tactic identification, action segmentation and tactic classification. In terms of action segmentation and tactic classification, annotators have the choice between manual, heuristic rule based and statistical model-based labelling. These three options have their own advantages as well as disadvantages. Manual labelling is likely to be the most accurate, but requires large effort and post-processing for resolving dis-agreement and inconsistencies. Heuristic rule based labelling saves the manual effort of inputting labels. However, specific rules need to be formulated case-by-case, and its completeness depends on both the ex-perience of the annotators as well as the variability of user search behaviour. A statistical model-based approach is expected to have better generalisability compared to a rule-based approach with regards to unseen cases. However, its performance depends on the quality of the training data, which is a result of manual or rule-based annotation, or the combination of the two. No matter which approach is taken, some manual annotation is necessary, as a starting point to derive heuristic rules, or to establish a training set for learning a statistical model. Next, we validate and examine our ESTI method by analysing the two search logs described in Section3. In particular, we compare the different approaches for action segmentation and tactic classification.
5. Validation of ESTI with reference logs
In this section we demonstrate how we can apply the ESTI method to analyse search logs and validate its efficiency and effectiveness. We examine the trade-offs of the different options that are available within our proposed method. In particular, for action segmentation and tactic classification, we illustrate how these can be conducted in three different ways (manual, rule-based and statistical model-based approaches). We created a ground-truth by annotating the logs from our reference systems in order to evaluate the rule-based and statistical model-based approaches.
Three annotators were involved in the annotation process; one annotator had been involved in de-veloping Querium, one involved in dede-veloping ViGOR, while the third annotator was independent from development of both systems. All annotators were in different geographical locations. The system expert annotators were responsible for explaining the system design and the set-up of the logging systems to the other annotators.
5.1. Action parsing of the reference systems’ logs
The logs from the two reference systems were parsed as described in Section4.1. Table2(Querium) and Table3(ViGOR) show the actions identified in the logs for each references system.
Of the nine actions in Querium, eight correspond directly to events in the log files. The remaining action, QM (modify query), was recorded in the log when a dwell time longer than two seconds was recorded when entering text in the query box. Querium includes a preview widget tied to the query box. A two second pause is used to trigger an update of the preview widget, hence this “composite” action.
Action Description
QR Excute a query
QS Select query from history
MD Mark document (as relevant or irrelevant)
VD Open a document and view
VS View a result summary (mouse hover summaries) RF Select a document for relevance feedback
PG Pagination
SR Resize the document or expand/minimize summaries
[image:15.595.89.525.190.535.2]QM Modify query. This is triggered by user typing in the query box. A QM is recorded if there is a pause over 2 seconds between keystrokes.
Table 2: Actions recorded in Querium log.
Action Description
I Execute a search using example video shots T Execute a search using text
B Execute a search using both text and example video shots
ADD Add a video shot to a relevance feedback panel to be used for relevance feedback DEL Delete a video shot from the relevance feedback panel, this is the opposite of ADD DRA Drag a video shot from somewhere in the interface
NEX A video consists of a sequence of shots, this moves to the next shot in a playing video
PL Play a video
PRE Move to the previous shot in a playing video; this is the opposite of NEX REL Mark a video shot as relevant by adding it to a group or to the relevant panel
iREL Delete a video shot that is marked as relevant from a group or the relevant panel, this is the opposite of relevant
tTIP When a video shot is moused over, a box containing text describing the video pops up
Extra actions under experimental condition
CreG Create a group in the workspace DelG Delete a group from the workspace
MaxG Maximise a group, like a window from a tool bar MinG Minimise a group, like a window to a tool bar MovG Move a group in the workspace
Table 3: Actions recorded in ViGOR log.
5.2. Target search tactics for the reference systems
Next, the target tactics need to be specified. We adopted the model by Marchionini [42]. This model served our purposes since it has tactics that can be manifested by actions recorded in the log files. Specif-ically, we used four of the eight stages; “formulate query (FQ),” “execute search (ES),” “examine result (ER),” and “extract information (EI).” The other stages are either not applicable for our data (but could easily be applied in other situations), or do not have physical representation as an action recorded in a log file.
Tactics Description Examples (Querium) Examples (ViGOR)
FQ Formulate/refine a query RF+ QM*; QM+; DRA ADD; DEL+
ES Execute search QR+ I+; T+; I+ B+;
ER Examine results VS+ (short dwell time);
PG+
NEX+; PRE+; DRA+ tTip
EI Extract information, e.g. relevance assessment, review results
VS+ (long dwell time); VS MD+
PL+; DRA iREL; DRG REL
Extra tactics
ORG Organising results SR+ [MinG MaxG MovG]+
[image:16.595.91.512.109.243.2]RV Review history QS+ –
Table 4: Target tactics identified in the two logs. Example actions or action segments are written as regular expressions and separated by “;”. For example, RF+ QM* means one or more RF, may or may not followed by one or more QM.
we also defined a category “O” meaning “out of vocabulary”, in case some of the action segments cannot be interpreted as any search tactic.
As discussed in Section4.4, there exist many-to-one as well as one-to-many mappings between actions and tactics. In Table4, we see a typical one-to-many example from Querium: View Summary (VS) can either be Extract Information (EI) or Examine Results (ER). To correctly assign this action to a tactic, dwell time duration is used. If the dwell time is long, i.e.≥5seconds, it is more likely that a user is reading the search results summary (ER) rather than only skimming it (EI). The 5 second threshold was determined based on reading research using eye tracking [46] and the size of the summaries in Querium. A time span of less than 5 seconds is a too short period for being able to read a summary and extract information.
5.3. Validating action segmentation
The ground-truth for action segmentation was created using the segmentation tool as shown in Figure3
and the set of heuristics developed (as discussed in Section4.3). After the heuristic rules had been applied, the action segments were uploaded to the segmentation tool and the annotators manually reviewed and corrected the segments. With this ground truth data-set we can evaluate the effectiveness of both the heuristic rules and the statistical model-based approach. Note, our selected statistical method performs both segmentation and labelling, therefore validation of this method will be discussed in Section 5.4.
Heuristic rule based segmentation
Following the approach described in Section4.3, our annotators formulated specific heuristic rules for each of the reference logs based on the general guidelines outlined in Section4.3. The rules specified for Querium are listed in Table5, and the rules for ViGOR are listed in Table6. Guideline L1 is a straight-forward rule that can be applied to any actions. However, note that certain actions may be ambiguous, e.g. VS in Table5, in which case L1 cannot be applied without considering the context. Here we only mention guideline L1 as special cases as such, otherwise we only list rules corresponding to guidelines L2 — L4, which deal with merging conditions betweendifferentactions.
Performance of rule-based segmentation. The ground truth data contained 5852 action segments from the Querium logs and 12,437 action segments from the ViGOR logs. The identified segments from Querium and ViGOR contain on average 1.8 and 2.3 actions respectively.
To observe the effectiveness of the heuristic rules, we compare the result of rule-based segmentation to the ground truth, i.e. segments after manual correction. For the purpose of evaluation, we assign each action to one of the two classes: “SP” (splitting point) or “Non-SP” (non-splitting point). That is, if an action is labelled as “SP”, then it is the start of a new segment. We report precision, recall, and F1 for each class over all actions in a log, as well as the micro and macro average over classes (Table7).
Action Rule Guideline
QS Alone or combined with following VS: viewing a result summary after selecting a historical query can be seen as a whole process of reviewing history.
L2
MD Alone or combined with a precedent VS, regardless of the dwell time of VS: users need to move mouse over a result summary to mark the document, which most likely will trigger a VS.
L4
VD Alone or combined with precedent VS: users need to click on a result summary to read the document, which will most likely trigger a VS.
L4
VS 1. Repeated VS’s are grouped in long viewing and short viewings (i.e. depend-ing on the dwell time after a VS as discussed above.)
L1
2. Follow rules of combining with other actions. L4
RF 1. It can be combined with QM, as RF can be seen as another form of QM; L2 2. VS with short dwell time may be intermixed, as VS may be triggered when users move the mouse over the summary to click on RF checkbox.
L4
PG Alone or combined with VS with short dwell time: both actions indicate skim-ming of the results.
L2
SR Alone or combined with following or precedent VD’s: SR is performed to make the document window larger for easy reading.
L3
[image:17.595.89.529.110.348.2]QM Alone or combined with RF: semantically close actions. L2
Table 5: Heuristic rules to segment Querium log with reference to general heuristic guidelines outlined in Section4.3.
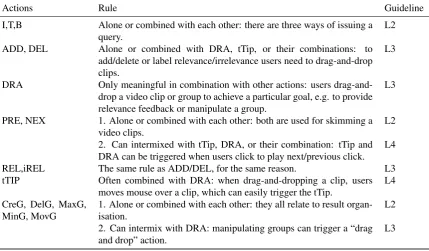
Actions Rule Guideline
I,T,B Alone or combined with each other: there are three ways of issuing a query.
L2
ADD, DEL Alone or combined with DRA, tTip, or their combinations: to
add/delete or label relevance/irrelevance users need to drag-and-drop clips.
L3
DRA Only meaningful in combination with other actions: users
drag-and-drop a video clip or group to achieve a particular goal, e.g. to provide relevance feedback or manipulate a group.
L3
PRE, NEX 1. Alone or combined with each other: both are used for skimming a video clips.
L2
2. Can intermixed with tTip, DRA, or their combination: tTip and DRA can be triggered when users click to play next/previous click.
L4
REL,iREL The same rule as ADD/DEL, for the same reason. L3
tTIP Often combined with DRA: when drag-and-dropping a clip, users
moves mouse over a clip, which can easily trigger the tTip.
L4
CreG, DelG, MaxG, MinG, MovG
1. Alone or combined with each other: they all relate to result organ-isation.
L2
2. Can intermix with DRA: manipulating groups can trigger a “drag and drop” action.
L3
Table 6: Heuristic rules to segment ViGOR log with reference to general heuristic guidelines outlined in Section4.3.
[image:17.595.94.524.378.629.2]Querium ViGOR
Classes Precision Recall F1 Precision Recall F1
SP 0.965 0.983 0.974 0.993 1.000 0.997
Non-SP 0.978 0.956 0.967 1.000 0.995 0.998
Avg (macro) 0.971 0.969 0.970 0.997 0.998 0.997
[image:18.595.147.454.108.199.2]Avg (micro) 0.971 0.971 0.971 0.997 0.997 0.997
Table 7: Accuracy of rule-based segmentation after manual correction, in terms of precision, recall, and F1-measure. Each action is labelled as “SP” (split point) or “Non-SP” (non-split point).
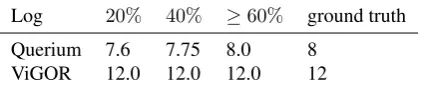
Log 20% 40% ≥60% ground truth
Querium 7.6 7.75 8.0 8
ViGOR 12.0 12.0 12.0 12
Table 8: Average number of segmentation rules discovered from the “training sets” of different size.
rules over the 5 folds. For ViGOR, 20% of the data would discover all rules, while for Querium we may miss 1 rule when observing only 20% or 40% of the data, depending on the sample from which rules are discovered. This indicates that, at least for our reference logs, a small amount of data can cover the majority of the rules.
Thus, we have learnt that: (1) It is possible to formulate simple rules to achieve an accurate segmenta-tion on acsegmenta-tion sequences. With a small set of sequences it is possible to derive rules with good coverage. This can greatly reduce the manual effort for annotation. (2) These rules are however not perfect. If nec-essary, the action segments can be manually corrected, e.g. to obtain a ground truth set for developing statistical learning models. This correction is, in our experience, faster than manually segmenting the logs.
5.4. Tactic classification for the reference systems
Having obtained action segments we can now map them to the target tactics. As with action segmenta-tion we use the heuristic rule based approach combined with manual correcsegmenta-tion to create a ground truth set. With this set we then evaluate the effectiveness of the heuristic rules as well as the CRF-based automatic approach.
Heuristic rule based tactic classification
Following the procedure described in Section4.4, four sets of specific rules need to be formulated in order to assign action segments to target tactics for our reference logs. These rules were summarised by annotators based on their observations and interpretations during the action segmentation stage.
Rules for Querium.
(a) Interpretation of individual actions. Table9lists the rules for mapping individual actions to target tactics. These rules can be overridden by rules in (b) — (d).
(b) Disambiguation rules. As already discussed in Section5.2we set a threshold of 5 seconds for the dwell time after SV to indicate short/long SV for the purpose of disambiguation. In some cases dwell time is not important, i.e. this rule can be overridden by rules (c) — (d).
(c) Rules for fixed combinations (L3 segments). Based on Table 5 we have the following L3 case for Querium: VD combined with SR. When SR follows VD it is most likely that SR is to make the window larger for easy reading, while the main purpose of the reader is to view a document (VD), which corresponds to target tactic EI.
[image:18.595.197.409.236.281.2]Action(s) Tactic Reasoning
QR ES QR runs a query, and therefore executes a search.
QS RV QS selects and executes a query from historical queries.
MD EI MD provides relevance assessment to documents, this is a type of information extraction.
VD EI Users extract information by viewing a document.
VS EI/ER For VS with short dwell time, users are likely to skim through a result summary, which would be “examine result” (ER), while for VS with long dwell time, users may be reading the result summary, and hence extract information (EI).
RF, QM FQ Both actions provide (re)formulation of a query, i.e. FQ PG ER The purpose of pagination is to examine results (ER).
[image:19.595.87.535.281.409.2]SR ORG Resizing the document window can be seen as organising results.
Table 9: Heuristic rules for mapping individual action to target tactics (Querium).
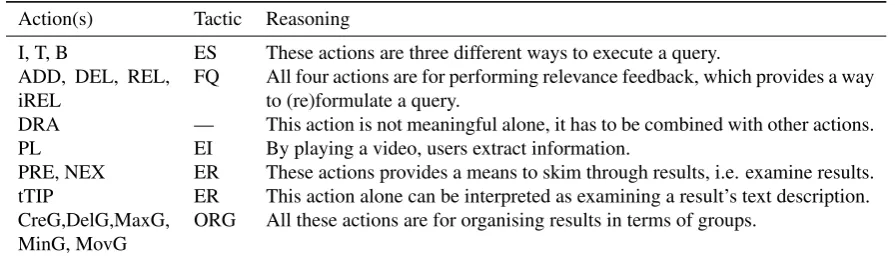
Action(s) Tactic Reasoning
I, T, B ES These actions are three different ways to execute a query. ADD, DEL, REL,
iREL
FQ All four actions are for performing relevance feedback, which provides a way to (re)formulate a query.
DRA — This action is not meaningful alone, it has to be combined with other actions.
PL EI By playing a video, users extract information.
PRE, NEX ER These actions provides a means to skim through results, i.e. examine results. tTIP ER This action alone can be interpreted as examining a result’s text description. CreG,DelG,MaxG,
MinG, MovG
ORG All these actions are for organising results in terms of groups.
Table 10: Heuristic rules for mapping individual action to target tactics (ViGOR).
Rules for ViGOR.
(a) Individual actions. Table 10lists the rules that map individual actions to predefined target tactics. These rules can be overridden by rules in (b) — (d).
(b) Disambiguation rules. Not applicable for ViGOR. The only ambiguous action in ViGOR is “iTip”, which may be unintentionally triggered when performing other actions. The interpretation of “iTip‘” can be determined by its contextual actions, using rules (c) — (d).
(c) Rules for fixed combinations (L3 segments). From Table6we see the following L3 combinations of actions:
ADD, DEL, REL, iREL combined with DRA. Users need to drag-and-drop to perform ADD / DEL / REL / iREL to perform relevance feedback. Therefore these combinations are interpreted as QF. While drag-and-drop, tTIP may be triggered, and can be considered as an unintentional event and can be ignored.
CreG, DelG, MovG, MaxG, MinG combined with DRA. Users sometimes drag-and-drop groups in order to move them around while performing other operations on groups. Together they can be seen as organising tactic (ORG).
(d) Rules for unintendedly triggered actions (L4 segments). In terms of L4 rules, we have the following cases.
tTip and DRA combined with PRE and NEX. When clicking to play the previous or next clip users sometimes unintentionally move the clip and trigger the drag-and-drop or tooltip event. In these cases, these actions are followed PRE or NEX and can be interpreted as ER.
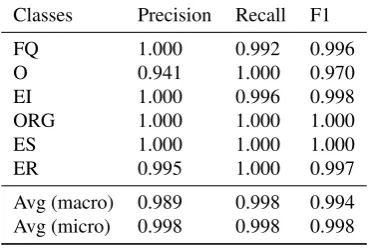
Performance of rule-based tactic classification. To evaluate the effectiveness of the above rules, we created a ground truth set by manually correcting the labels after applying the rules. We then compare the output of the rule-based classification to the ground truth set. Table11and Table12list the results in terms of the precision and recall of each tactic category. The overall micro performance for precision, recall and F1 is high, about 0.98 for both systems. While macro performance takes the average of all classification classes, micro performance is measured over all instances whose values are influenced by the dominant classes. As Table11and Table12show the macro performance is lower than the micro performance. The performance difference can be traced to the low performance of the “O” cases, particularly with Querium. This is because with Querium no rules covered these cases, and only in manual correction did the annotators discover and decide to label these cases as “O”. However, as the micro performance indicates, the “O” cases were quite infrequent and hence had very little impact on the micro performance.
Further, we observe that when an action can be interpreted as multiple tactics depending on how it is combined with other actions, rules tend to make errors. For example, we see that in Querium both RV and ORG have a relatively low precision compared to other tactics. A closer investigation reveals that the mistakes involve recognising ER as RV and EI as ORG, the problems being: QS can be interpreted as RV when standing alone, but also ER when combined with short SV; while SR can be interpreted as ORG when standing alone, but EI when combined with VD.
Classes Precision Recall F1
FQ 0.965 0.999 0.982
RV 0.773 1.000 0.872
EI 1.000 0.983 0.991
O 0.000 0.000 0.000
ORG 0.811 1.000 0.896
ES 1.000 1.000 1.000
ER 0.985 0.973 0.979
Avg (macro) 0.791 0.851 0.820
[image:20.595.89.276.373.509.2]Avg (micro) 0.983 0.983 0.983
Table 11: Accuracy of rule-based tactic labelling after man-ual correction in terms of precision, recall and F1-measure; Querium.
Classes Precision Recall F1
FQ 1.000 0.992 0.996
O 0.941 1.000 0.970
EI 1.000 0.996 0.998
ORG 1.000 1.000 1.000
ES 1.000 1.000 1.000
ER 0.995 1.000 0.997
Avg (macro) 0.989 0.998 0.994
Avg (micro) 0.998 0.998 0.998
Table 12: Accuracy of rule-based tactic labelling after man-ual correction in terms of precision, recall and F1-measure; ViGOR.
Tactic identification rule coverage. We also evaluated the coverage of the rules discovered from partially observed data. Table13lists the results. Assuming the annotators can always identify a rule if the situation described by the rule occurs in the “observed set”, we see that for Querium, all the rules can be discovered if only 20% of the data is inspected. For ViGOR, one rule may be missing if only 20% of the data is inspected depending on the sample. That is, similar to the segmentation rules, with our reference logs, a small portion of the data covers the majority of the rules discovered from the complete set.
CRFs-based tactic identification
Next, we move on to the application of the statistical model-based approach, following the CRF model specified in Section4.4. We use the CRF implementation provided by crfsuite.1 In terms of features, we apply the simplest features for a linear chain model: the transition relations between tactics and the emission relations between tactics and actions. These two types of feature can be directly observed in any logs. It is possible to consider more complex features if more information is contained in or can be derived
[image:20.595.322.507.381.505.2]Log 20% 40% ≥60% ground truth
Querium 10.0 10.0 10.0 10
[image:21.595.194.407.108.155.2]ViGOR 17.8 18.0 18.0 18
Table 13: Average number of rules discovered from the “training sets” of different sizes.
from a log, but for this work we have concentrated mainly on simple text based logs as they are most prevalent. Further, with a linear-chain model we implicitly assume that the sequence of user search tactics constitute a first-order Markov chain. In Section6when using search tactics to analyse user behaviour, we will provide a validation of this property.
Here, we are interested in two aspects of the result of CRF-based tactic identification: (1) To which extent can the statistical model-based approach correctly segment and identify tactics for a log? (2) How well can a statistical model generalise when the training data does not contain all possible patterns?
To answer the first question we ran a 5-fold cross validation and used precision, recall and F1-measure as evaluation metrics to assess classification performance. We report the averaged values of the metrics over the cross validation folds.
To answer the second question, we experiment with different divisions between training and testing data by adjusting the amounts of holdout data during cross-validation. With the 5-fold cross validation, we experiment with training onkfolds, and test on the rest, wherek∈[1, ..,4].
Classes Precision Recall F1
FQ 1.000 0.982 0.991
RV 1.000 0.992 0.996
EI 0.942 0.909 0.925
O 1.000 0.714 0.833
ORG 0.843 0.983 0.908
ES 1.000 1.000 1.000
ER 0.895 0.938 0.916
Avg (macro) 0.954 0.931 0.943
[image:21.595.92.279.359.496.2]Avg (micro) 0.939 0.939 0.939
Table 14: Accuracy of CRF-based tactic labelling in terms of precision, recall and F1-measure; Querium.
Classes Precision Recall F1
FQ 0.903 0.921 0.912
EI 0.892 0.990 0.938
O 1.000 0.021 0.041
ORG 1.000 0.964 0.982
ES 1.000 1.000 1.000
ER 0.986 0.905 0.944
Avg (macro) 0.964 0.800 0.874
Avg (micro) 0.943 0.943 0.943
Table 15: Accuracy of CRF-based tactic labelling in terms of precision, recall and F1-measure; ViGOR.
Performance of CRFs-based tactic identification. Table14and Table15show the performance of the CRF based tactic identification approach in terms of precision, recall and F1 measure. From our results the following can be observed. First, the overall micro performance is quite promising (>0.93). The macro recall and F1 is lower for ViGOR, which can be traced to the “O” class. In ViGOR, the “O” class consists of patterns that can be easily confused with EI and ER (e.g. the combination of “DRA”s and “tTip”s). Also, the number of examples for training of action segments belonging to the “O” class is much lower than for the other classes. Also for Querium, recall and F1 is lower than for the other classes due to fewer training examples. Second, if we compare the performance here to the performance of rule-based approach (Table11and12), we see that it is hard to conclude which approach is better. In four out of seven cases the rule-based approach leads to better F1 scores for both logs. “ES” seems to be an easy tactic to identify, both approaches result in a F1-measure of 1.0. In the rest of the cases the CRF-based approach actually achieved better performance in terms of F1-score.
Here, the rules are formed based on extensive analyses of the logs, and the statistical models are trained on 80% of the data that have been manually annotated. That is, for these experiments extensive manual effort has been involved in both approaches. However, we have already seen that it is possible to identify the majority of the rules needed from a small proportion of the data. Next, we investigate if such effort can further be reduced by the statistical model-based approach.
[image:21.595.319.508.367.490.2]