City, University of London Institutional Repository
Citation
:
Javdani, S., Fabian, M., Ams, M., Carlton, J., Sun, T. and Grattan, K. T. V.
(2014). Fiber bragg grating-based system for 2-D analysis of vibrational modes of a steel
propeller blade. Journal of Lightwave Technology, 32(23), pp. 3991-3997. doi:
10.1109/JLT.2014.2361631
This is the accepted version of the paper.
This version of the publication may differ from the final published
version.
Permanent repository link:
http://openaccess.city.ac.uk/4982/
Link to published version
:
http://dx.doi.org/10.1109/JLT.2014.2361631
Copyright and reuse:
City Research Online aims to make research
outputs of City, University of London available to a wider audience.
Copyright and Moral Rights remain with the author(s) and/or copyright
holders. URLs from City Research Online may be freely distributed and
linked to.
City Research Online:
http://openaccess.city.ac.uk/
[email protected]
Fibre Bragg Grating-based system for 2D analysis
of vibrational modes of a steel propeller blade
Saeed Javdani, Matthias Fabian, Martin Ams, Member, OSA, John Carlton, Tong Sun, and Kenneth T. V. Grattan
Abstract—This paper reports results obtained using Fibre Bragg Grating (FBG)-based sensors to investigate the displacement mode shapes of a cantilevered steel propeller blade, using FBG arrays for vibration monitoring for the first time. The experimental data obtained are cross-compared with those from a finite element analysis of the same blade, undertaken using proprietary software. In the experimental configuration used, a network of gratings, forming a series of sensor arrays, was mounted on the blade under study to monitor its bending modes, whilst a further set was mounted perpendicular to this array to monitor torsional modes. To obtain the shape of the strain modes generated in the blade at specific frequencies, the dynamic response of the FBG arrays, as a function of time, was captured and then processed using Fourier Transform algorithms to show the natural frequencies of the blade. As a result, the displacement modes shapes for the bending, torsional and coupled modes of the first nine natural frequencies of the plate were obtained. The experimental data show very good agreement with theoretical analysis. This work demonstrates the potential of using the lightweight, minimally invasive sensing technique described for the analysis of propeller blades and thus illustrating an effective method to overcome the deleterious effects of propellers seen in some commercial propeller designs.
Index Terms—Fibre Bragg Grating (FBG), wavelength shift, signal-processing, vibration sensor, mode shape, vibration analysis
I. INTRODUCTION
OPTICAL fibre sensors (OFSs) have been widely accepted as a highly effective means of monitoring a range of important physical and chemical parameters, in different ways. Through their applications in the structural health monitoring (SHM) of a range of materials e.g. composites, concrete and metals, the field has developed rapidly, with a number of in-the-field tests and evaluations on different systems having been carried out by some of the authors and others [1]–[6]. Amongst those important parameters which have been measured are physical parameters such as temperature and strain and the ingress of chemical species such as pH, moisture and chloride, especially in concrete structures. However, the effects of vibration and of a range of acoustic frequencies on a structure are important for many different types of structures and to date there has been little done to exploit the potential of optical fibre sensors for such analysis in SHM. In particular, a major advantage of the use of optical fibre sensors is that they can be configured along a single optical fibre network and thus a number of different sensors, all acting as optical transducers but often each for a different measure and at a different location, can be multiplexed and where required, widely distributed on the structure.
Manuscript received October 4, 2013; revised March 17, 2014. Authors are with the Sensors & Instrumentation Research Centre, the School of Mathematics, Computer Science & Engineering and City Graduate School, City University London, Northampton Square, London EC1V 0HB, United Kingdom (e-mail: [email protected]).
In addition, optical fibre methods are well suited for use in the marine environment due to the inertness of the sensors, their resistance to corrosion due to exposure to sea water, and their low mass and the lightweight nature of the whole optical sensor network. Thus they have been successfully used in monitoring marine platforms of various types [7], [8] but little has been reported on vibrational analysis of ship related structures. Vibration is an interesting and integrity-related parameter for marine propellers because small changes in their manufacture or deviations from the original design configuration can cause unacceptable changes in cavitation performance and acoustic emissions.
To understand this deleterious aspect of the propeller performance better, vibration measurement through displacement estimation of vibrating bodies (such as a propeller) becomes an important issue both in the reduction of the vibration of the elastic components of a structure and in terms of correlation with numerical analysis methods [9]. The direct measurement of displacement is often highly complicated, or indeed impossible to make in-situ due to the operating condition of a structure; for example making measurements on marine propellers when fully operational and when they are at sea and underwater. Therefore, indirect displacement measurements, for instance involving the application of conventional strain gauges, have become a favoured, yet essentially flawed, technique in the vibration analysis of such structures. Conventional strain gauges are relatively bulky and are prone to damage from cavitation and breakage, apart from not being well suited to working underwater. Thus such an approach is fundamentally unsatisfactory. To pave the way for future studies on complex propeller blades a rectangular blade was used for the current study as a means of proving the technique.
extends it in a new direction to achieve novel performance characteristics of an important marine structure using a large FBG-based sensor network.
II. THEORETICAL BACKGROUND
The key, desired outcome of the work described has been to determine the deflection mode shapes of a propeller related structure by using the displacement/vibration data obtained from a strategically placed optical fibre Bragg grating-based measurement system. An accurate knowledge of modal properties of the structure under consideration is important, as emphasised, for example, by Pisoni et al. [9]. Different methods have been discussed in the literature for reconstructing the deformation mode shapes of a structure such as that considered. For example, Kang et al. [11] suggested that the bending modes of a cantilever beam could be obtained using the following relationship
{d} = [Ф
N]
T([ψ
N
]
T[ψ
N
])
-1[ψ
N]
T{s} (1)
where {d}, [ФN], [ψN] and {s} represent the displacement, the
displacement mode shapes, the strain mode shapes and strain respectively. Although this approach can be used as a general solution to strain-displacement transformation relationship even for coupled modes, it requires information on the displacement mode shapes, which sometimes can be quite complicated to achieve. Existing literature looking at the subject in a simplistic way takes an approach mainly based on uncoupled vibration modes, where essentially only pure bending is considered as there is still lack of theoretical information in strain-displacement relationship, particularly in the case of torsional vibration and strain data.
Much has been written on the strain-displacement relationship in pure bending vibration analysis. For example, Foss and Haugse [12], Bogert et al. [13] and Chuang et. al. [14], suggested the concept of a modal transformation algorithm to recover deformations from strains and structural modal characteristics. Pisoni et al. [9] presented a similar procedure for the determination of displacements at any given point in a vibrating body by using two strain gauges. Davis et al. [5] reconstructed vertical deflections of simple beam models using Fibre Bragg Grating (FBG) sensor signals and using the relationship between the strain and the deflection. Thus the data obtained from the finite element analysis carried out could be made directly comparable with those from the optical sensors used, due to their low mass and minimal interference with the shape and configuration of the structure.
For the purpose of this study, to reconstruct the displacement mode shapes, a curve fitting procedure outlined by Yau et al. [15] was used. In this analysis, in order to calculate the modes shapes, it was assumed that the plate has a small deflection and therefore the relationship between the strain and deflection in the bending modes could be described by the following curvature function [16]
= -
=
(2)
where is the curvature at location on the surface of the plate and and are strain amplitude and vertical
position at location respectively. is the deflection at location . Therefore integrating the above formula twice will provide a relationship for the deflection at each FBG location for the various modal shapes. A zero displacement boundary condition was considered at the clamped end of the plate and in order to solve the 4th or 5th degree polynomial functions of deflection and to find the nodal position, Roark’s formula for a cantilevered beam was used [17]
√
(3)
where is the natural frequency (Hz), is a constant where refers to the mode of vibration, is gravitational acceleration (units consistent with length dimension),
is the modulus of elasticity and is area moment of inertia. and are uniform load per unit length (including beam weight) and beam length respectively.
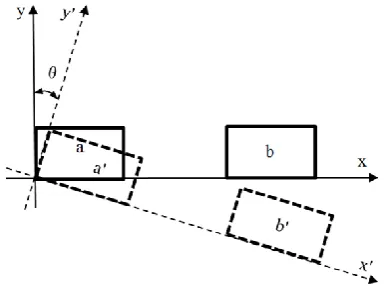
In torsional motions (which are additional to out of plane expansions) there is a twisting angle along the nodal line. Figure 1 shows two elements of a plate undergoing a twisting motion (θ, the twist angle) along the z axis. Therefore, in mode shape extraction, this angle also has to be considered. An estimation of this angle can be obtained from the strain values monitored along the x axis. In order to find the direction of bending when the structure is in flexural or torsional vibration, the wavelength shift at each FBG was determined. If there is a compression at the FBG location, the wavelength blue-shifts (i.e. the wavelength decreases) and similarly if there is an expansion at the FBG location, the wavelength red-shifts (i.e. the wavelength increases).
Fig. 1. Two elements of a plate undergone a twisting motion (θ, twist angle) along z axis
Most of the previous works in the area of strain-displacement relationship, particularly using FBG sensors, has been limited to the analysis of cantilevered beam type geometries in a single dimension. The present work provides more detailed information on the deformation mode shapes, i.e. taking a two-dimensional approach, as well as providing information on the direction of bending not only in the flexural modes, but also in the torsional and coupled modes.
III. EXPERIMENTAL ASPECTS
[image:3.595.331.524.445.592.2]torsional and flexural modes, are extremely complex. This complexity, in the case of marine propellers, seems likely to arise from a variety of causes such as a non-symmetrical outline of the blade, the variable thickness and camber distribution both chordally and radially, and the twist of the blade caused by changes in the radial distribution of the pitch angle. Immersion of a propeller in water also causes a reduction in the modal frequency and to a lesser extent changes the mode shapes compared with the corresponding characteristics in air. Thus, in order to understand better how blade vibration can be a problem, a symmetrical flat blade in air is first examined, so that many of the practical complexities are eliminated, to allow an initial and simplified consideration of the problem [18]. It is a common practice in marine engineering to simplify the propeller blades geometry since the fundamental modes are similar with respect to their shapes in the case of a simple geometry and a complex propeller blade.
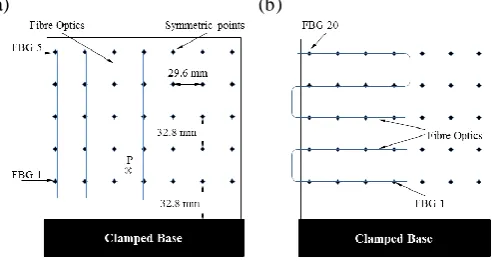
To do so, a series of pilot experiments was performed in the laboratory with a flat-plate blade as a basis to understand both vibration behaviour in terms of the modal response and the frequencies generated and its relationship with the vibration/displacement values measured by the use of a series of FBG sensors. In this experimental arrangement, a flat steel plate of size 7 x 7 inches (178 x 178 mm) and thickness of 0.073 inches (1.85 mm) was manufactured and cantilevered at one end of its axis to a vibration-less table by three G-clamps. The modes of vibration in air were excited by bowing on the centre-line, with a small hammer, close to the root of the blade (Fig.2a) and in order to capture the vibrational frequency range, an optical FBG sensor network of the type discussed earlier was used.
[image:4.595.38.285.440.571.2](a) (b)
Fig. 2. Schematic of the instrumented model steel plate as used for the optical sensor vibrational analysis using a fibre Bragg grating grid (a: top side, b: bottom side). Location P shows the excitation point on the plate.
The FBGs used as the sensor elements were as follows. Type I FBGs (of 6 mm length) were fabricated using the conventional zero-order nulled diffraction phase mask technique [19]. To do so, 248 nm laser pulses (12 mJ at 300 Hz) from an ATLEX-300-SI excimer laser were focussed via a 20 mm focal length plano-cylindrical lens through a series of commercially available phase masks (Oe-land, QPS) into the core of a photosensitive fibre (Fibercore PS1250). Five FBGs at wavelengths between 1525 nm and 1565 nm were chosen to ensure that there was no spectral overlap even when each sensor responds to its maximum range. These gratings were respectively written into four optical fibres,
each of length 300 mm, and were fixed to the blade surface by means of a two component adhesive. The blade dimensions as well as the specific sensor locations on the blade surface are shown in Fig. 2.
The dynamic Bragg wavelength shifts of each FBG in the FBG network, caused by the vibrations detected, were captured simultaneously using a Micron Optics SM130-700 sensing interrogator unit, at a sampling rate of 2000 Hz. All the DC components were then removed from the transient signals before a Fast Fourier Transform (FFT) algorithm was applied to extract the frequency components from each of the sensor data sets, with the maximum detectable vibration frequency being 1000 Hz (half the sampling rate). In order to determine the strongest spectral features for all frequencies in the FFT spectra the sampling interval was chosen to be 0.625 s. Longer sampling intervals were found to result in lower amplitudes for the higher frequencies as they typically dampen faster than low frequency vibrations. The frequency resolution, Δf, of the FFT spectra depends on the sampling frequency, fs, and the number of sample values N taken (Δf = fs/N), where N is a product of the sampling frequency and the sampling interval ts. Thus, Δf = 1/ts = 1.6 Hz for the chosen sampling interval of 0.625 s. A band-pass filtering approach was also applied to track the relative wavelength shifts of each FBG at their natural frequencies to obtain the strain mode shape of the plate at that specific frequency. For each of the detected frequency components, the amplitudes and relative wavelength shifts at the different sensor locations were then used to plot the deflection charts (mode maps) of the steel blade.
In order to be able to compare accurately the results from the optical sensors with those obtained from an analysis of the vibrational modes of the plate, a finite element analysis was undertaken using the commercially available ANSYS FE software. The modal analysis function from the software was used and a solution was obtained when the deflection results converged as the mesh density increased.
IV. RESULTS AND DISCUSSION
Examples of typical time domain plots captured during vibration tests from the five FBGs along one fibre are shown in Fig. 3(a). The corresponding FFT spectra of these transient signals are shown in Fig. 3(b). Firstly, it was observed that the positioning of the FBG sensors along the plate directly affects their responsiveness to the vibrational modes of the plate and, as expected, it was noted that the captured signal for each FBG depends on the location of the sensor. This can be seen, for example, in Fig 3(b) where FBG1 which was close to the root of the plate and was sensitive to the low fundamental frequency while FBG5 on the same fibre was more sensitive to higher modes of vibration. Secondly, a number of tests conducted on the plate showed that not only did the amplitudes of the individual FFT features depend on the location at which the plate was being excited, but also in some of the tests it was noted that the higher natural frequencies were appearing in the output signal only if the plate was excited at specific locations. Therefore a number of tests were carried out to find the best location at which to excite the plate. This location (P) is shown in Figure 2 (a).
(a) (b)
[image:5.595.35.543.61.217.2]Fig. 3. (a) Example time domain signal of 5 FBGs along the same fibre. (b) Corresponding FFT spectra of the transient signal shown in (a)
TABLE 1
SIMULATED AND EXCREMENTALLY OBTAINED NATURAL FREQUENCIES OF THE MODEL STEEL PLATE.
model created using the ANSYS software, for a series of vibrational nodes of the steel plate (Table 1). The results shown are in excellent agreement for the first 9 natural frequencies of the plate. This outcome confirms that the optical FBG sensor network is able to provide valuable data over a wide frequency range and at multiple positions which cannot readily be achieved with conventional sensors.
Fig. 4. Band-pass filtered transient of Fig. 3(a), showing as an example the bending mode at around 860 Hz in the time domain.
With the effective magnitudes of vibration and frequency at each location known (from the FFT feature amplitudes), the direction of bending at any given point in time could then be obtained from the transient data by band-pass filtering the time
domain signals and extracting only a single frequency component. Figure 4 shows as an exemplar, the magnified section of a software based band-pass filtered transient of the first five gratings (Fig. 2, FBG1-5) showing the second bending mode at a frequency of approximately 860 Hz (Butterworth, cut-off frequencies: 850..870 Hz, grade: 2). A wavelength red-shift indicates grating expansion (increased strain, downward bend, negative curvature) and a blue-shift grating compression (reduced strain, upward bend, positive curvature). Thus, for any given point in the data set, the direction of the bending can be obtained with regard to the sensor location when the fitted signals are in phase.
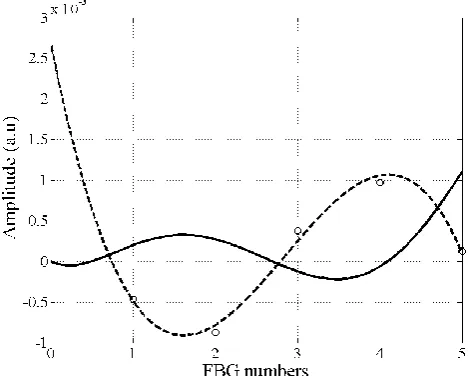
Figure 5 shows the effect of combining the effective vibration magnitude and the direction of bending (the values of the dotted line in Fig. 4) of the same bending mode at 860 Hz, plotted against the locations of the grating sensors, FBG1-5. As illustrated in Fig. 4, a positive magnitude measured at FBG 1 and 2 represents a negative curvature (expansion) at the locations of these two grating sensors and the negative magnitude of FBG 3-5 indicates a positive curvature (compression) at their corresponding locations. Considering Equation 2, the longitudinal strain is inversely proportional to radius of curvature at location x and the sign of
[image:5.595.101.488.295.433.2] [image:5.595.39.291.545.701.2]Fig. 5. Fitted curve to the strain data (dashed line); Strain data governing equation for curve (circles); Deflection curvature (solid line)
In order to create pure torsional modes (column 2, 4 and 8 in Fig. 6) the wavelength shifts of the bottom layer sensors in Fig. 2(b) were used to determine the strain magnitude and direction of bending along the x-axis which was monitored. The curvature at the location of each sensor in torsional modes represents the angle of twist, θ,(see Fig. 1) along the z axis. In the case of the coupled modes, i.e., columns 5, 6 and 9 in Fig. 6, the strain values of the top and bottom layer sensors were combined to obtain the deformation mode shapes.
Finally, an interpolation of the deformation data obtained from all the sensors and their corresponding frequencies enable the 2D displacement mode shapes shown in Fig 6 to be created. Here the excellent agreement between the experimental results obtained and the results of the simulation can be seen. The top row in Fig. 6 shows the simulated deformation mode shapes of the first nine natural frequencies of the model steel blade used in this work. The bottom row shows the experimentally obtained mode shapes at the same frequencies.
Column 1 in Fig.6 shows the fundamental mode shape of the plate, with zero deformation at the root and maximum out of plane deformation at the tip. This mode appears in all
Fig. 6. The first 9 simulated (top row) and experimentally obtained (bottom row) displacement mode shapes of the model steel plate. Dark lines (nodal lines) in each mode shape represent zero deformation. Between these lines and from these lines towards the edges, out of plane deformation increases. Each figure represents the entire plate with the x-axis (clamped base) being the clamped base and y-axis (plate edge) pointing towards the tip of the plate.
cantilevered structures like marine propeller blades as the first mode of vibration. Columns 3 and 7 show the first and second flexural modes where the dark lines (nodal lines) show zero deformation and on the sides of these lines the plate deforms out of the plane (x,y plane) in opposite directions. This can also be seen in Figure 5 (solid line) along an array of sensors where the nodal points (with zero deformation) are seen as appearing somewhere between FBG 2 and 3 and at FBG 4.
Column 2 shows the first torsional mode, with zero deformation along the centreline and maximum deformation at the two corners of the tip in opposite out of plane directions. Columns 4 and 8 represent the second and third torsional modes where the dark lines (nodal lines) show a zero deformation and the plate deforms out of plane in opposite directions between the lines and towards the edges. As for coupled modes, seen from columns 5, 6 and 9, the plate deforms in the opposite directions between the nodal lines, in the same way as was explained for the case of the pure flexural and torsional modes.
The close correlation in the results revealing these two sets of profiles can especially be seen in the nodal lines (the areas of no deformation, shown as dark areas) which are of particular
interest in the mode shape analysis as they are the distinctive property of a mode shape and are independent of the direction of bending (zero displacement). The inevitable small discrepancies in the relative displacement amplitudes or of the mode shapes reported are likely due to the blade not being perfectly rectangular or having a non-uniform thickness, as is featured in the simulation model used. The bonding mechanisms used to secure the blade to its base may also have an effect on its vibrational properties which would also not be represented in the simulation carried out. Other sources of error that may have created the small differences between the experimental and the simulated outputs may include the presence of reflected vibrations from the table to which the blade was clamped and the actual clamping technique itself. However Table 1 shows that good agreement to within experimental error in most cases is achieved, showing the veracity of the techniques used.
V. CONCLUSION
[image:6.595.46.282.69.257.2] [image:6.595.38.560.322.465.2]mode shapes of a cantilevered steel plate based on real-time Bragg wavelength shift data of arrays of FBG sensors was used and verified through a comparison of the results obtained from these experimental measurements and those from simulation using finite element techniques. The experimentally obtained results showing the frequencies detected, as well as the shapes of all the bending, torsion and coupled modes, were found to be in very good agreement, within experimental error, with those from the theoretical model which allowed an analysis to be performed using ANSYS FE software. It was also found that the location of the excitation of the blade, as expected, directly affected the amplitudes of the various frequencies that were detected in the experiment.
The results of this work have shown the potential for the use of these experimental and modelling techniques for a more comprehensive investigation of not only a single blade, as was undertaken successfully in this work, but of actual multiple blade propellers. This is the subject of on-going research. However, the outcome of this work has shown the value of the FBG sensors being mounted along the estimated nodal lines in order to reduce the effects due to the position of the source when the blades are excited representing an innovative use of FBG devices for this purpose in marine technology.
ACKNOWLEDGMENT
The support of the Royal Academy of Engineering and the George Daniels Educational Trust for K. T. V. Grattan is gratefully acknowledged.
REFERENCES
[1] A. Kerrouche. W.J.O.Boyle, T. Sun, K.T.V.Grattan, J.W.Schmidt, B.Taljsten, Strain measurement using embedded fiber bragg grating sensors inside an anchored carbon fibre polymer reinforcement prestressing rod for structural monitoring, J. Sensors, IEEE, 9(11), pp. 1456-1461, Nov. 2009 [2] A. Kerrouche, W.J.O. Boyle, T. Sun, K.T.V. Grattan, J.W. Schmidt, B. Taljsten, Enhanced FBG sensor-based system performance assessment for monitoring strain along a prestressed CFRP rod in structural monitoring, J. Sensors and Actuators A: Physical, 151(2), Pages 127-132, 2009
[3] S.K.T. Grattan, S.E. Taylor, T. Sun, P.A.M. Basheer, K.T.V. Grattan, Monitoring of corrosion in structural reinforcing bars: performance comparison using in situ fibre-optic and electric wire strain gauge systems, J. Sensors, IEEE , 9(11), pp.1494-1502, Nov. 2009
[4] C. Ambrosino, G. Diodati and A. Laudati, Fiber Bragg grating sensors and piezoelectric actuators for active vibration control application, In Proc. 4th European Workshop on Structural Health Monitoring, Cracow, Poland, 02-04 July 2008, Pages: 802-809
[5] M.A. Davis, A.D. Kersey, J. Sirkis, E.J. Friebele, Shape and vibration mode sensing using a fibre optic Bragg grating array, J. Smart Mater and Struct., 5(6), pp. 759-765, July 1996
[6] S.W. Ko, M.S. Jang, H.I. Kim, Shape estimation and health monitoring of wind turbine tower using a FBG sensor array, Instrumentation and Measurement Technology Conference (I2MTC), 2012 IEEE International , pp.496,500, 13-16 May 2012
[7] R. Liang, L. Ren, H. N. Li, J. Zhou, D. S. Li and L.Sun, Health monitoring system for offshore platform with fiber Bragg grating sensors, J. Optical Engineering, vol. 45 (8): Art. No.08441, Aug. 2006
[8] M. Majumder, T. K. Gangopadhyay, A. K. Chakraborty, K. Dasgupta, D.K. Bhattacharya, Fibre Bragg gratings in structural health monitoring - Present status and applications, J. Sensors and Actuators A: Physical, 147(1), pp. 150-164, 15th Sep. 2008
[9] A. C. Pisoni, C. Santolini, D. E. Hauf , S. Dubowsky, Displacements in vibrating body by strain gauge measurements, In Proc. 13th international modal analysis Conf., vol.1, Feb. 1995, pp. 119-125
[10] Y. R. Garcia, J.M. Corres, and J. Goicoechea, Vibration detection using optical fibre sensors, J. Sensors, vol. 2010, Art. No. 936487, 12 pages, July 2010
[11] L. H. Kang, D. K. Kim and J. H. Han, Estimation of dynamic structural displacements using fibre Bragg grating strain sensors, J. Sound and Vibration, 305(3), pp. 534-542, 2007
[12] G.C. Foss and E.D. Haugse, Using modal test results to develop strainto displacement transformation, In Proc. 13th international modal analysis Conf., vol.1, Feb. 1995, pp.112-118
[13] P.B. Bogert, E. Haugse and R.E. Gehrki, Structural shape identification from experimental strains using a modal transformation technique, presented at 44th AIAA/ASME/ASCE/AHS/ASC Structures, Structural Dynamics, and Materials Conf., Norfolk, Virginia, April 7-10, 2003
[14] K.C. Chuang, S.H. Lin, C.C. Ma, R.H. Wu, Application of a Fiber Bragg Grating-Based Sensing System on Investigating Dynamic Behaviors of a Cantilever Beam Under Impact or Moving Mass Loadings, Sensors Journal, IEEE , vol.13, no.1, pp.389,399, Jan. 2013
[15] M.H. Yau, T.H.T. Chan, D.P. Thambiratnam, and H.Y. Tam, Using Fiber Bragg Grating (FBG) sensors for vertical displacement measurement of bridges, In Proc. 14th Asia Pacific Vibration Conf., The Hong Kong Polytechnic Univeristy, Hong Kong, 2011, pp. 288-297
[16] C. H. Kim, I. Paek and N. Yoo, Monitoring of small wind turbine blade using FBG sensors, presented at Int. Conf. on Control, Automation and Systems, in KINTEX, Gyeonggido, Korea, Oct. 27-30, 2010
[17] Young W. C. and Budynas R. G., Roarks Formulas for Stress and Strain, 7th ed., New York: McGraw Hill, 2002 [18] Carlton J. S., Propeller blade vibration in Marine Propeller and Propulsion, 2nd ed., MPG Books Ltd, Bodmin Cornwall, UK, 2007, ch. 21, pp. 425-434
[19] K. O. Hill and G. Meltz, Fiber Bragg Grating Technology Fundamentals and Overview, J. Lightwave Tech. 15(8), pp. 1263-1276, 1997
Matthias Fabian Dr Matthias Fabian received a degree (Dipl.-Ing. (FH)) in Electronics from Hochschule Wismar, Germany, in 2006. He spent a semester at the Tokyo University of Science (TUS) in Tokyo, Japan, in 2005 gaining practical experience with microwave and optical devices. He was awarded his PhD in Fibre Optic Sensors from the University of Limerick, Ireland, in 2012. In 2010 he was awarded a short term visiting researcher grant from the Italian National Research Council for a stay at the National Institute of Optics in Naples, Italy, where he worked on fibre-loop cavity ringdown spectroscopy. He was a Systems Engineer intern at Intel Corporation for a year in 2011 writing software for wireless sensors connected to Android devices. He is currently a post-doctoral research fellow at City University London, UK, working on optical fibre sensors for a variety of applications in the civil engineering, marine and power electronics sector.
Martin Ams Dr Martin Ams received the B.Sc. degree in physics and the Ph.D. degree in optical laser physics from Macquarie University, Sydney, NSW, Australia, in 2001 and 2008, respectively. He then worked as a Research Associate at the MQ Photonics Research Centre and the Centre for Ultrahigh bandwidth Devices for Optical Systems (CUDOS), Macquarie University until mid-2011. He is currently a post-doctoral researcher at City University London. His research interests include laser fabrication of photonic waveguide devices and Bragg-gratings for use in telecommunication, sensing, astronomy, quantum information and biophotonic applications.
John Carlton Following training as a mechanical engineer and mathematician, Professor Carlton served in the Royal Naval Scientific Service undertaking research into underwater vehicle hydrodynamic design and propulsors. Five years later he joined Stone Manganese Marine Ltd as a propeller designer and research engineer. During this time he specialised in controllable pitch propellers and transverse propulsion units but also undertook analysis into other aspects of ship propulsion technology; particularly in the fields of ship powering and manoeuvring. In 1975, he joined Lloyds Register, first in the Technical Investigation Department and after nine years transferred to the Advanced Engineering Department as its Deputy Head. He later moved to the newly formed Performance Technology Department where he initiated and led several research and development activities in the fields of ship hydrodynamics, diesel engine technology, machinery condition monitoring and control technology. In 1992 he returned to the Technical Investigation Department as the Senior Principal Surveyor and Head of Department in which capacity he served for 11 years and then, in 2003, Professor Carlton was invited to become the Global Head of Marine Technology for Lloyds Register.
After 35 years within Lloyds Register, Professor Carlton was then invited to become Professor of Marine Engineering at the City University London in which capacity he now serves and is responsible for the postgraduate maritime studies. He is also closely involved with the newly formed International Institute for Cavitation Research at the University.
During his career he has presented and published around 120 technical papers and articles on many aspects of marine technology as well as having written a textbook entitled Marine Propellers and Propulsion which is now in its 3rd Edition. He is also a contributing author to the Marine Engineering Reference Book. Professor Carlton has been awarded the Denny Gold Medal of the Institute of Marine Engineering, Science and Technology twice and has also won the Stanley Gray Award for Marine Technology twice. Additionally, he is active in a number of research groups and has sat on several international and government committees. In 2006 he was awarded the honorary degree of Doctor of Science for his contribution to marine technology. Professor Carlton was the 109th President of the Institute of Marine Engineering, Science and Technology in 2011/12 and was elected a Fellow of the Royal Academy of Engineering in 2011.
Tong Sun Professor Tong Sun was awarded the degrees of Bachelor of Engineering, Master of Engineering and Doctor of Engineering from the Department of Precision Instrumentation of Harbin Institute of Technology, Harbin, China in 1990, 1993 and 1998 respectively. She was awarded the degree of Doctor of Philosophy at City University in applied physics in 1999 and was an Assistant Professor at Nanyang Technological University in Singapore from year 2000 to 2001 before she re-joined City University in 2001 as a Lecturer. Subsequently she was promoted to a Senior Lecturer in 2003, a Reader in 2006 and a Professor in 2008 at City University, London. Prof. Sun is currently the Director of Research Centre of Sensors and Instrumentation and is leading a research team focused on developing a range of optical fibre sensors for a variety of industrial applications, including structural condition monitoring, early fire detection,
homeland security, process monitoring, food quality and
environmental monitoring. She has been working closely with partners across disciplines from academia and industry, both in the UK and overseas. Prof. Sun is a member of the Institute of Physics and a Fellow of the Institution of Engineering and Technology and a Chartered Physicist and a Chartered Engineer in the United Kingdom. She has authored or co-authored some 230 scientific and technical papers.