Rochester Institute of Technology
RIT Scholar Works
Theses
Thesis/Dissertation Collections
6-1-1990
The Influence of the position of a color control bar
on a form when determining the most appropriate
location to measure variability in solid ink density
and dot gain of a printed product
Kevin B. Leines
Follow this and additional works at:
http://scholarworks.rit.edu/theses
This Thesis is brought to you for free and open access by the Thesis/Dissertation Collections at RIT Scholar Works. It has been accepted for inclusion
in Theses by an authorized administrator of RIT Scholar Works. For more information, please contact
Recommended Citation
FORM WHEN
DETERMINING
THE MOST APPROPRIATE LOCATION
TO
MEASURE VARIABILITY IN SOLID INK DENSITY AND DOT GAIN OF A
PRINTED PRODUCT
by
Kevin B. Leines
A thesis
submittedin
partialfulfillment
ofthe
requirements
for the degree
ofMaster
ofScience
in the
School
ofPrinting
Management
andSciences
in the
College
ofGraphic Arts
andPhotography
ofthe
Rochester
Institute
ofTechnology
June,
1990
Certificate of Approval -- Master's Thesis
School of Printing Management and Sciences
Rochester Institute of Technology
Rochester, New York
CERTIFICATE OF APPROVAL
MASTER'S THESIS
This is to certify that the Master's Thesis of
KEVIN LEINES
With a major in PRINTING TECHNOLOGY
has been approved by the Thesis Committee as
satisfactory for the thesis requirement for the
Master of Science degree at the convocation of
date
Thesis Committee:
Clifton T Frazier
Thesis Advisor
Joseph I Noga
Graduate Program Coordinator
THE INFLUENCE OF THE POSITION OF A COLOR CONTROL BAR ON A
FORM WHEN DETERMINING THE MOST APPROPRIATE LOCATION TO
MEASURE VARIABILITY IN SOLID INK DENSITY AND DOT GAIN OF A
PRINTED PRODUCT
I. Kevin Leines, hereby grant permission to the Wallace Memorial Library of RIT
to reproduce my thesis in whole or part. Any reproduction will not be for
commercial use or profit.
ACKNOWLEDGEMENTS
I
wouldlike to thank my beautiful
wife,Christina,
for supporting
methroughout this
program,
both
financially
and mentally.Thank
you alsoto my
parents,
brothers
and sistersfor supporting
methroughout this
endeavor; yourencouragement was
heard
overthe many
miles.I
would alsolike to
thank
all ofmy
advisorshelping
me choosecorrectly
the
information that
has helped
this thesis become
an experienceI
shall neverforget.
Also
thanks
to Bill Eisner
and all ofthe
wonderful peopledown
atthe
T
&
E
Center.
Their
effort,
time
andmoney
wasgreatly
appreciated.Last,
but
notleast,
the
graduate students ofPrinting
Technology,
Graphic
Arts
Systems,
andPublishing,
year1990!
Thanks especially to Enrique Arce for
his
knowledge,
time
andfriendship.
LISTOFTABLES
iv
LIST OF
FIGURES
viiABSTRACT
viiiChapter
1
INTRODUCTION
1
Purpose
2
Chapter 2 THEORETICAL BASIS
3
Chapter
3
LITERATURE REVIEW
9
Chapter4 HYPOTHESES
15
Chapter 5 METHODOLOGY
16
Procedures
16
Printing
Conditions
20
Limitations
21
Chapter
6
THE
RESULTS
24
Chapter 7
CONCLUSIONS
AND
RECOMMENDATIONS
28
Summary
28
Conclusions
28
Recommendations
31
BIBLIOGRAPHY
32
APPENDIXES
A
36
B
39
C
43
D
45
E
52
OF
Table
1.
Densities
anddot
gain calculations ofrange,precision,
andaccuracy
for the
cyanink
on press sheet53
2.
Densities
anddot
gain calculations ofrange,
precision, andaccuracy
for the black ink
on press sheet54
3.
Densities
anddot
gain calculations ofrange, precision,
andaccuracy
for the
magentaink
on press sheet55
4.
Densities
anddot
gain calculations ofrange, precision,
andaccuracy
for the
yellowink
on press sheet56
5.
Cyan
density
measured atlead
when controlled atlead
57
6. Cyan dot
gain measured atlead
whencontrolled atlead
58
7.
Cyan
density
measured atlead
when controlled at middle59
8. Cyan
dot
gain measure atlead
when controlled at middle60
9.
Cyan
density
measured atlead
whencontrolled attrail
61
10.
Cyan dot
gain measured atlead
whencontrolled attrail
62
11. Black
density
measured atlead
whencontrolled atlead
63
12. Black dot
gain measured atlead
whencontrolled atlead
64
13. Black
density
measured atlead
whencontrolled at middle65
14. Black
dot
gain measured atlead
whencontrolled at middle66
15. Black
density
measured atlead
whencontrolled attrail
67
16. Black dot
gain measured atlead
whencontrolled attrail
68
17. Magenta
density
measured atlead
whencontrolled alead
69
18. Magenta dot
gain measuredatlead
whencontrolled atlead
70
19.
Magenta
density
measured atlead
whencontrolled at middle71
20.
Magenta dot
gain measured atlead
whencontrolled at middle72
21.
Magenta
density
measured atlead
whencontrolled attrail
73
22.
Magenta
dot
gain measuredatlead
whencontrolled attrail
74
23.
Yellow
density
measured atlead
whencontrolled atlead
75
24. Yellow
dot
gain measured atlead
whencontrolled atlead
76
25. Yellow
density
measured atlead
whencontrolled at middle77
26.
Yellow
dot
gainmeasured atlead
whencontrolled at middle78
27. Yellow
density
measured atlead
whencontrolled attrail
79
28. Yellow dot
gainmeasured atlead
when controlled attrail
80
29.
Cyan
density
measured at middlewhencontrolled atlead
81
30. Cyan
dot
gain measured at middlewhencontrolled atlead
82
31. Cyan
density
measured at middlewhencontrolled at middle83
32. Cyan dot
gain measured at middle whencontrolled at middle84
33. Cyan
density
measured at middle when controlled attrail
85
34. Cyan dot
gain measured at middle when controlled attrail
86
35.
Black
density
measured at middlewhencontrolled atlead
87
36.
Black
dot
gain measured at middlewhencontrolled atlead
88
density
measured at middle when controlled at middle38.
Black
dot
gainmeasured at middle when controlled at middle90
39. Black
density
measured at middle when controlled attrail
91
40.
Black
dot
gain measured at middle when controlled attrail
92
41
.Magenta
density
measured at middle when controlled atlead
93
42.
Magenta dot
gain measured at middle when controlled atlead
94
43.
Magenta
density
measured at middle when controlled at middle95
44. Magenta dot
gain measured at middle when controlled at middle96
45.
Magenta
density
measured at middle when controlled attrail
97
46.
Magenta
dot
gain measured at middle when controlled attrail
98
47. Yellow
density
measured at middle when controlled atlead
99
48. Yellow
dot
gain measured at middle when controlled atlead
100
49. Yellow
density
measured at middle when controlled at middle101
50. Yellow
dot
gain measured at middlewhencontrolled at middle102
51. Yellow
density
measured at middle when controlled attrail
103
52. Yellow dot
gain measured at middle when controlled attrail
104
53.
Cyan
density
measured attrail
whencontrolled atlead
105
54.
Cyan
dot
gain measured attrail
whencontrolled atlead
106
55.
Cyan
density
measured attrail
whencontrolled at middle107
56.
Cyan dot
gain measured attrail
whencontrolled at middle108
57.
Cyan
density
measured attrail
when controlled attrail
109
58.
Cyan
dot
gain measured attrail
whencontrolled attrail
110
59. Black
density
measure attrail
whencontrolled atlead
111
60. Black dot
gain measured attrail
whencontrolled atlead
112
61.
Black
density
measuredattrail
when controlled at middle113
62. Black dot
gain measured attrail
whencontrolled at middle114
63. Black
density
measured attrail
when controlledattrail
115
64. Black dot
gainmeasured attrail
whencontrolled attrail
116
65. Magenta
density
measured attrail
whencontrolled atlead
117
66.
Magenta dot
gain measured attrail
whencontrolled atlead
118
67.
Magenta
density
measured attrail
whencontrolled at middle119
68.
Magenta dot
gain measured attrail
whencontrolled at middle120
69. Magenta
density
measured attrail
whencontrolled attrail
121
70. Magenta
dot
gain measured attrail
whencontrolled attrail
122
71. Yellow
density
measured attrail
whencontrolledatlead
123
72. Yellow
dot
gain measured attrail
whencontrolled atlead
124
73.
Yellow
density
measured attrial
whencontrolledat middle125
74.
Yellow
dot
gain measured attrail
whencontrolled at middle126
75. Yellow
density
measured attrail
when controlledattrail
127
76.
Yellow
dot
gain measured attrail
whencontrolled attrail
128
77.0.
Calculations
ofone-way
analysis of variancefor
printed cyan129
77.1. Cyan
density
controlledatlead
129
77.3. Cyan
density
controlled at middle129
77.4.
Cyan dot
gaincontrolledat middle129
77.5.
Cyan
density
controlledattrail
129
77.6. Cyan dot
gaincontrolled attrail
129
78.0. Calculations
ofone-way
analysis of variancefor
printedblack
130
78.1. Black
density
controlled atlead
130
78.2. Black dot
gaincontrolledatlead
130
78.3. Black
density
controlled at middle130
78.4. Black
dot
gaincontrolledat middle130
78.5. Black
density
controlled attrail
130
78.6.
Black dot
gaincontrolled attrail
130
79.0.
Calculations
ofone-way
analysis of variancefor
printed magenta131
79.1.
Magenta
density
controlled atlead
131
79.2.
Magenta
dot
gain controlled atlead
131
79.3.
Magenta
density
controlled at middle131
79.4. Magenta
dot
gain controlled at middle131
79.5.
Magenta
density
controlled attrail
131
79.6.
Magenta dot
gain controlled attrail
131
80.0.
Calculations
ofone-way
analysis of variancefor
printed yellow132
80.1.
Yellow
density
controlled atlead
132
80.2.
Yellow dot
gain controlled atlead
132
80.3. Yellow
density
controlled at middle132
80.4. Yellow dot
gaincontrolled at middle132
80.5. Yellow
density
controlled attrail
132
80.6. Yellow dot
gain controlled attrail
132
Figures
Table
Page
1.
Example
ofthe
SWOP/GATF
color controlbar
16
2. Layout
of press sheetincluding
ImageWorld
andSWOP/GATF
color control
bars
17
This study
proposedto
determine
the
most appropriate placeto
measurevariability
in dot
gain and solidink
density
on aform using
color controlbars.
The study developed
aform that
entailedthree
GATF/SWOP,
133 line
color controlbars
placedstrategically
atthe
lead,
middle andtrail
edges ofthe
sheet.The
test
set specificdensity
standardsto
controlto,
and whilethese
densities
were
being
controlled,
samples were obtainedthat
represented atypical
press run.Each
ofthe
controlbar
set-ups wastreated
as a separate press run,allowing
the
press operatorto
changethe
setdensities to the
next controlbar
oncethe
samples were pulled.Five
samples were averagedto
obtain one samplefor that
particular sample set.That
sample represented one ofthirty
for
one entire press run.Every
sample's averagedensity
anddot
gain wasdetermined,
as well asits
accuracy, precision,
and range.A one-way
analysis of variance was usedto
determine difference between
controlbar data.
Through the
statisticaltools listed
above,
the variability in
each position ofthe
controlbars
wasdetermined. The
results revealedthat both the
density
anddot
gain positions atthe
trail
edgefor
cyan,
black,
magenta,
and yellow werethe
mostconsistent,
mostprecise,
mostaccurate,
aswell ascontaining
the
smallest range ofdata. In
conclusion,based
onthis
study,
the
trail
edgemay be
the
most appropriate position on aform to consistently
control a web offset press.The data that
were obtainedwhenthe
middle wasbeing
controlled also showedthis
to be
a goodlocation
for the
control ofthe
press.INTRODUCTION
The
needfor
quality
andconsistency
has greatly intensified
sincethe
beginning
ofthe
printing industry.
Most
recently,to
meetthis
need,the
industry
has
developed
a conceptofhow to
attainquality
through
statistical process controltools.
Statistical
process control(SPC)
can give abase from
whichto
build
a successful printed product.This
approachto quality
assurancehas
sparked arevolutionary
design
conceptthat
has been implemented in
several successfulindustries.
Several
aspects ofthe
field
ofprinting lend
themselves
to this
approach of a controlled environment.One
ofthe
mostimportant
ofthese
aspectsis the
ability to
consistently
monitorthe variability
of solidink
density
anddot
gain of a printed product.Variability
existsin
mostprocesses,
generating the
needfor
controllimits.
Those limits
must curtailthe variability
ofthe
process asit is
operating
naturally,
andbe
compatible with otherfactors that influence
press variation.Each
processhas
a point at whichit
willvary
across adesired
aimpoint,
withthe
resulting
productshowing the
upperandlower
controllimits
ofthe
process.These
limits
entailthe
naturalvariability
ofthe
process.Many
variables caneasily
changethe
appearance of a printed product.Dot
gain,
whichis
directly
influenced
by
solidink
density,
tends to
alter animage the
most and needsto
be
frequently
monitored.The
way that the
pressoperator monitors
this
solidink
density
anddot
gainis
through
the
use of a reflectiondensitometer
that
reads color controlbars
placed onthe
printed product.Members in
industry
have
expressed a concernthat these
controlbars
may,
in
fact,
be
very
seldom used.One
ofthe
major reasonsbehind
the
abuse,
non-use,
or misuse of controlbars
is
cost.Other
reasonsinclude
the
availability
of space onthe
printedproduct,
orlack
thereof,
andpossibly ignorance
onthe
part ofthe
pressoperator.It
has been
shownthrough
the
implementation
of statistical analysisthat
press
inconsistency
canbe
monitored andcontrolledusing information
made availableby
measurementofthese
controlbars. A
widevariety
ofthese
controlbars
will give representativeinformation
on changeduring
a press run.product,
andto how
representativethis positioning is in
relationto the
total
variability
ofthe
solidink
density
anddot
gain,
has
not yetbeen determined.
What
this
study has focused its
attention uponis positioning
ofthese
bars
onthe
printed
form,
as well asthe
variation ofthose
controlbars.
The
assumptionin this
study has
been that
controlbars
are animportant
meansto
monitorthe
solidink
density
anddot
gain ofa printed product.As
pointed out
in
Chapters Two
andThree,
the
factors
mostinfluential
onimage
quality
aredot
gain and solidink
density
(SID). Because
ofthis,
these two
variables,
andhow
they
canbe
usedto
control apress,
have been
madethe
focus
ofthis
study.The
purpose ofthis study has been to determine the
most appropriatelocation
ofthese
color controlbars,
either atthe
middle,
lead,
ortrail
edges ofthe
printedproduct,
whenassessing variability in
solidink
density
anddot
gain.The
method ofthis study has
allowedthe
press operatorsto
bring
the
pressto
previously determined
densities,
having
a separateset-up
at each controlbar
position andcontrolling
the
press within specificdensity
limits. For
eachset-up,
variability
has
been
assessedfor
each ofthe
othertwo
uncontrolled colorbars.
Statistical
tools have helped to
measurethe
performance ofthese changing
THEORETICAL
BASIS
The
theoretical
basis
for this study is the belief that stabilizing
andmaintaining
the
solidink
density
anddot
gain on a process color printedimage
using
color controlbars
may
produce a superior product.If
these
two factors
arenot
controlled,
the tone
reproduction of process color printedimages may be
affected.
Miles Southworth defines
tone
reproduction as"the
visual andphotometric
relationship
of neutral grays onthe
originalcopy to
the
reproducedneutral
grays."
[1]
Press
operators utilizethe
measurements of solidink
density
and
dot
gainfrom
a controlbar to
try
to
reproducethis desired tone
reproductionand
gray
balance.
The desired
tone
reproduction andgray balance
is,
in
itself,
not alwaysan
easily
attainablecondition,
but
canbe
controlledthrough
the
solidink
density
anddot
gaininformation
given on a controlbar.
According
to Peter
Brehm
ofGCA,
"Optimizing
tone
reproductionis usually the
key
to producing the
best
possibleblack-and-white
and color[2]
The printing
processitself
cannotbe
held
responsiblefor
aH reproductionproblems,
but
through
measurable control
tools,
such as controlbars,
one cangreatly
reducethe
opening
for
error.Several factors influence
good reproduction; as outlinedby
Southworth,
these include "the
originalimage,
the
ink,
the
solidink
density,
the
screenruling,
the
papercharacteristics,
the
dot
shape,
andprinting
considerationssuch as
dot
gain,
doubling,
slur,
trapping,
andfill-in."
[3]
Some
pre-pressvariables can
be
removed orgreatly
reducedif
specificdirections
aretaken to
measure and plot
the tone
reproductionthrough
the
use ofthe
Jones Diagram.
This,
in
effect, canhelp
in the
control ofthe final
printedimage.
More
information
may
be
obtained aboutthe Jones Diagram in Appendix A.
One
ofthe
aspects of processvariability is
that
ofdot
gain."Dot
gainis
the increase in the
size of ahalftone dot from the time
it is
created onthe
halftone film
untilit
is
finally
printed onpaper."
[4]
There
aretwo
specifickinds
ofdot
gain,
physical and optical."Physical
dot
gainis
an enlargement ofmechanical
dot
size.It
can occurduring
the
platemaking
process,
orduring
conditions.
Optical dot
gainis
ink
on paper andits
relationship
withlight
asit
penetratesinto
the
paper,
causing
somelight
trapping
underthe
printeddots."
[5]
Calculations
for dot
gain are availableusing
eitherthe Murray-Davies
equation
for "total
dot
gain"
or
the
Yule-Nielsen
equationfor "physical
dot
gain."
Both
ofthese
equations arefurther discussed in
Appendix
B. "The
Murray-Davies
equation,
andthe
modification,
do
notdistinguish
among dot
gain,
slur, anddoubling.
Therefore,
it is
alsoimportant
to
use a visualtarget
whenexamining dot distortion
problems."
[6]
There
are otherfactors
that
influence
goodreproduction,
asit
relatesto
dot
gain.At
aTAGA
conferencein
1973,
Franz
Sigg
reportedthe
results ofhis
study showing
the tone
reproduction curvechanging
along
with solidink
density. "The higher the
solidink
density
printed,the
morethe
middletone(50%
dot
area)
gainedin
density."[7]
As
one cansee,
SID
that
is
out of controlmay
greatly
affectthe
dot
gain,
as well asaffecting
mostimage's
reproductions.Paper
is
another variablethat
may
affectthe dot
gain."Smoother
papers andpapers with
coating
exhibitless dot
gain."
[8]
Register
will also createchanges;
most obviousin
doubling,
eitherincreased
ordecreased.
Doubling
is
"an
obviousdefect in
whichdouble images
ofdots
are printed out of register witheach other.
"[9]
An image
canhandle
adegree
of misregisterdepending
onthe
image's
sharpness and screen ruling,but the
control ofdoubling
has been
greatly influenced
by
properregistration.Misregister
caninduce
ahue
shiftin
a colorimage,
thus creating
an undesirable printed colorimage. Ink
factors
also affectdot
gainthrough
a changein ink tack. "Higher tack
inks
andinks
withhigher
pigmentconcentration exhibitlower
dot
gain."
[10]
Screen
ruling
can alsohave
an effectondot
gain.As
statedin
the
Border
Zone
Theory,
"if there
is dot
gainit
will occur atthe
edgeofthe
dot."[1
1]
A
study
done
atRIT
showed, through
extensive materialstesting,
that
"regardless
ofthe
paper,
the
dot
gain wasonly 2
percentfor
the
65-line
screen,
whilethe
120-line
screenwas15
percent, andthe
150-line
screen was28
percent~proving
that
asthe
screenruling
increases,
sodoes the dot
gain."
[12]
This
information,
along
withthe Border Zone
Theory,
indicates
anincrease
in
dot
gainthrough
higher
screen ruling, moredots
resulting in
moredot
gain.Ink
trap
is
anotherfactor
influencing
goodimage
reproduction."Some
ofinks;
ink
film thickness
ofthe first-and
second-downinks;
ink-water
balance
(for
Lithography)
ofthe
first-and
second-downinks;
time between the first
and secondimpressions;
paperabsorptivity;
tack
stability;
paperhardness;
pressspeed;
andink
temperature
(S.D.
Warren
Company, 1980; Watkins,
1983)."
[13]
Any
changein any
ofthese
variablesmay
influence the
reproduction ofthe
product.Ink
trap
calculations,
along
with a series of other calculations andevaluations,
are reviewedin Appendix B.
Shape
ofthe
halftone dots
may
also affectthe
dot
gain of a printed product."Specific dot
shapes affectthe
percentdot
areadue to
dot
gainin
different
dot
arearanges."
[14]
In
otherwords,
for
specific applications andimages,
dot
shapemay
have
more orless
of an effect onthe
printed product.Tone
compressionis
a characteristic essentialto
printing.In
a sense, withouttone
compression,
photographicimages
wouldbe
mostdifficult,
if
notimpossible
to
reproduce."Tone
compression altersthe tones
ofthe
originalin
such away
asto
makethem
appear normal when reproduced, eventhough
they
have been
compressed andreduced."
[15]
The
printing
processis
capable ofreproducing
tones,
on coatedpaper,
printing
a maximum4-color
range with a maximumtotal
density
of1.94.
"Some
originaldensities
of colortransparencies
canreachup to
adensity
range of2.70."
[16]
All
ofthese
aspects of reproduction areimportant
and offeropportunity
for
a greatdeal
of change asthe
processis
in
operation.It
canbe
saidthat if
one can controlthese
aspectsthrough
an understandablecontrolling
device,
the
approachto producing
saleableprinting
wouldbe
aneasy task. As
printersmay
know,
that ideal
statehas
yetto
be
reached.One
cannotignore
the
changing printing
environment,but
printers nowhave
the
capabilities and methodsto
control and optimizetheir printing
process.One
meansby
whichto
controlthis
variableprinting
environmentis
by
taking density
readingsusing
a reflectiondensitometer.
There
arebasically
two
types
ofdensitometers,
reflectance andtransmittance.
The
transmission
6
measurement of
information
that
enables a press operator, as well as others,to
assess variablesto the
printing
process."The
purposes ofdensitometric
measurement
is
to
complimentthe
visual assessment and aidin
better
control of colorreproduction;
andalso,
quantitativedata
canbe
gathered andanalyzed."
[18]
Through this
data,
one can assessneeds, problems,
and changes neededto
control and optimizethe
printing
process.The
pushfor
"inter-instrument
agreementhas
alwaysbeen
a problemwhen
using
reflectiondensitometers
to
read solidink
densities."[19]
Recently,
adensitometer
response called"Status
T"has been implemented to be
a cross over pointfor
inter-instrument
agreement.More information
onthe
reflectancedensitometer
andthe
development
of"Status
T"
can
be
seenin Appendix C.
Much
ofthe
data that
canbe
gatheredby
the densitometer
will provide agreat
deal
of usefulinformation for
process control.There
is
a recentinterest in
the
interpretation
ofthis
data
receivedfrom
eachprocesses'
variability
andhow
to
monitorany
changestaking
place.This interest
has developed
a meansby
Endnotes
For
Chapter
2
1
.Miles
Southworth,
"Gray
Balance
andTone
Reproduction for
Color,"
Quality
Control
Scanner. Vol.
2,
No.
3
(1982),
pg.1.
2. Miles
Southworth,
"Optimizing
Tone
Reproduction."Quality
Control
Scanner.
Vol.
2,
No. 2
(1982),
pg.1.
3. Ibid.
4.
Miles
Southworth,
"Dot Gain: Causes
andCures,"
Quality
Control
Scanner.
Vol.
2,
No.
9
(1982),
pg.1.
5. Ibid.
6.
Field,
Gary,
Color And Its Reproduction
,Graphic
Arts Technical
Foundation,
Pittsburgh, PA., 1988,
pp.117-118.
7. Miles
Southworth,
"Dot Gain: Causes
andCures,"
Quality
Control
Scanner.
Vol.
2,
No.
9
(1982),
pp.1-2.
8.
Field, Gary,
Color And Its
Reproduction
,Graphic Arts
Technical
Foundation, Pittsburgh, PA., 1988,
pg.115.
9.
Miles
andDonna
Southworth,
Quality
andProductivity
In The
Graphic Arts.
Graphic Arts
Publishing Co.,
1989,
pp.8-12.
10.
Field.
Gary.
Color And Its Reproduction.
Graphic Arts
Technical
Foundation, Pittsburgh, PA., 1988,
pg.115.
8
12.
Miles
Southworth,
"Dot Gain: Causes
andCures,"
Quality
Control
Scanner.
Vol.
2,
No. 9
(1982),
pg.2.
13.
Miles
Southworth,
"Ink
Trap
Measurement,"Quality
Control
Scanner.
Vol.
5,
No.
6(1985),
pg.1.
14.
Franz
Sigg,
"Percent
Dot Area
andDot
Gain."TAGA Proceedings.
1978.
(Rochester,
N.Y.,
Technical Association
ofthe
Graphic
Arts),
pp.209-212.
15.
Miles
Southworth,
"Optimizing
Tone
Reproduction,"
Quality
Control
Scanner.
Vol.
2,
No.
2
(1982),
pg.1.
16.
Ibid.
1 7.
Miles
andDonna
Southworth,
Quality
andProductivity
In The Graphic
Arts.
Graphic Arts
Publishing Co.,
1989,
pp.8-10.
18.
Robert
Chung,
Lecture
notes on"Densitometric
Analysis Of
Press
Sheet,"Rochester
Institute
ofTechnology, Rochester, N.Y.,
PPRT-71
1,2.3,
2.3.1,1990.
19.
Miles
Southworth,
"Aids
to
Quality
Control,"
Quality
Control
Scanner.
Vol.
5,
No.
1
(1985),
pg.1.
LITERATURE REVIEW
The
amountofinformation
aboutthe
position ofa color controlbar
on a printed productto
measure variationin dot
gain and solidink
density
was,to
say the
least,
disappointing.
However,
literature
was available on pressvariability,
along
withinformation
onthe
press operator'sinfluence
on variability.That
discussion
was animportant basis
ofthis
study.Some
ofthe
materials on solidink
density
anddot
gain were alsoimportant to this
study.The
March,
1990
issue
ofGraphic
Arts
Monthly
discussed Rochester
Institute
ofTechnology's
"Anatomy
of aWeb
Press
Run."This
workshop,held in
the
summer of1989,
wasthe third
annual"Conference
onQuality
andProductivity
in the
Printing
Industry."The
workshop's goal wasto
demonstrate
that the
press(RIT's
Harris
M1000B
weboffsetpress)
has
aninherent
variability
and alsoto
showthe
affects of press variables such as solidink
density
anddot
gain
have
onthe quality
ofthe
finished
printed product.[1]
One
ofthe
important
conclusions madeduring
the
"Anatomy
of aWeb
Press
Run" wasthat "pressmen tend
to
'tweak'
too
much.They
play
with color and registration alittle
too
much."
[2]
The
press was allowedto
runfor
30
minutes,
and afterSWOP
(Specifications Web Offset
Publication) density
standards were
attained,
'without intervention from the
presscrew,
the
inherent
(or
natural)
variability
ofthe
press wasfound."
[3]
Samples
were pulledevery
two
minutesfor
atotal
of30
minutes,
making
a sample ofthe
populationequaling 15. Although the
number of samplesmay
nothave
reached a representativesampling
ofthe
pressrun,
it did
give someinsight into
the
variability
ofthe
press.Results
from these
15
samplesshowedthat
"despite
a slightdecline in
solidink
density during
the
run,the
density
anddot
gain of each process color remained withinthe
range of acceptabledeviation."
[4]
SWOP
statesthat "Total
dot
gain(physical
andoptical)
. . .using
the
Murray-Davies
formula,
shouldbe
24%,
plus or minus4%,
as measuredin
the
50% target 133-line
screen."
[5]
The
density
specifications usedfor the
"Anatomy
of aWeb Press
Run,"based
onSWOP
standardswere:1.35
Magenta
1.20
Cyan
1.60
Black
"Each
has
atolerance limit
of plus or minus .14for
colorprinting."
[6]
After the
information
was obtainedfrom the
30
minute press run,the
nexttask
wasto
vary
the
solidink
density
and observethe
effects onthe
appearanceof
the tone
reproduction.The
aboveSWOP
density
standards were used as amiddle point
to
establish some consistency."A total
of six variations wereproduced,
allowing
Cyan,
Magenta,
andYellow to
run .15 above andbelow the
middle point
densities
for
10
minutes each.The
press was allowedto
normalizeto
its
middle pointbetween
eachvariation."
[7]
As
one mightexpect,
changes madein
solidink
density
"noticeably
changed
the
appearance ofthe
printedproduct."
[8]
These
changes shownthrough
measurement support a"high
cause-and-effectrelationship between
solid
ink
density
anddot
gain."
[9]
In
otherwords,increases
in
solidink
density
increases dot
gain,
thus affecting the tone
reproduction ofthe
finished
printedproduct.
This
information
wasimportant to the
structure andlayout
ofthe
product
that
wasprinted andmeasured,
andhas
also contributedto the
analysis and conclusions of
this
project.Some
ofthe
conclusionsdrawn from
the
"Anatomy
ofaWeb Press
Run"were:"+
Natural variability
existsin the
printing
process.+
Variability
increases
when special causes areintroduced
whether
intentionally
or not.+
Printers
canlearn the
capabilitiesoftheir
presses andhow to
control
them
through the
use ofmeasurement equipment andA
report given atRochester
Institute
ofTechnology
by
the
Graphic
Communications
Association's
(GCA)
Print Properties
Committee,
as a part ofGCA's
SPECTRUM
conference,
wasdevoted to
"improved
communications ofcolor and
better
coordinationamong
the
many
segmentsinvolved in printing
and
publishing
production."
[11] Many
different
aspects ofprinting
werediscussed,
but
this
review of relatedliterature focused only
onthose
partsimportant
to the
purpose ofthis
study.The information
that
waspresentedby
the
Print Properties
Committee,
which consists of
industry
representatives,
was receivedfrom
"28
pressesshowing
that
mid-tonedot
gain rangedbetween
20
and40
percent."
[12]
This
raised some concern over
the
possible causes ofthis
wide range ofdot
gain.Some
ofthe
possible causesdiscussed
entailed:"Solid ink
density,
ink-film
thickness,
paper,
screen ruling,type
ofink, doubling,
slur,
papersmoothness,relative
humidity
ofthe
paper,
blanket
hardness,
ambienttemperature,
overprint,
blanket
nip
tension,
platepacking,
blanket
packing,
plate or cylinderwear,
trapping,
paperthickness,
paper surfaceefficiency,
paper surfacestrength,
blanket
thickness,
pressspeed,
and webtension."
[13]
The intent
ofthis study is
notthe
explanation ofthese
problems,
but to find
whereto
placecolor control
bars
on a printed productto
measurethe
least
variability in
solidink
density
anddot
gain.The
Graphic Communications Association's
approach wasto
study any
effects
that
change wouldhave
onthat
process'soutput,
if the
processis
stable,
and what variations exist.
GCA
alsocommentedthat
"
the
application ofprocess control
tools
is
neededto
makeany
changesto the
processto
establishconsistency
and reliability."
[14]
Two
separate press runs were employedin
GCA's findings. One
pressrun
(August)
allowedfor
press operatorintervention
where needed.The
secondpress run
(October)
allowedonly
pressmakeready
and standards achievedwithout press operator
intervention
even when problems were evident.Samples
were pulledevery
two
minutes,
providing insight into
the
processvariation and capabilities of
the
press.The Materials Interaction Task Force
ofthe SPECTRUM
conferencedecided that
"the
two
response variables ofAlthough
someinformation
aboutthe stability
ofdensity
anddot
gain wasquestionably
variablein
someareas,
these
conclusions were never-the-less made public:"1. Variation found
in
solidink
density
anddot
gain wassignificantly
smallerin the
press runduring
whichthe
operatorswere not allowed
to
alterthe
process.2.
The
processcapability
ofmeeting
specificationsfor
all variableswas
significantly
higher in the
press runduring
whichthe
operatorswere not allowed
to
alterthe
press.3. Statistical
processcontrol methods canbe successfully
applied
to the
print productionprocess."
[16]
The
conclusionsin
each ofthese
studiesmay
showthe
needto
controlsolid
ink
density
anddot
gain.Its variability diminishes the
ability
ofthe
processto
produce a productwiththe consistency
andaccuracy
neededfor
a saleableproduct.
Operator
intervention
was shownto
cause even more variability.However,
the
study may
not resemble an actualprinting
environmentsinceeach press
may have different
characteristicsthat
makeit
unique.This
uniqueness
has demanded
that the
press operatorconsistently
controlhis
Endnotes
for Chapter
3
1
.Robert
Chung,
Richard
Adams,
andTom
Petronio,
"Anatomy
ofaWeb
Press
Run,"Graphic Arts Monthly.
March
1990,
pg.1.
2.
T
&
E News.
"Anatomy
of aWeb Press
Run,"Technical
andEducation
Center,
Rochester
Institute
ofTechnology, Rochester, N.Y.,
Special
Edition,
Vol.
17,
No. 7
(1989),
pp.8-9.
3. Robert
Chung,
Richard
Adams,
andTom
Petronio,
"Anatomy
ofaWeb
Press
Run,"Graphic Arts Monthly.
March
1990,
pg.1.
4.
Ibid,
pg.2.
5.
SWOP,
Recommended
Specifications Web Offset Publication.
"Ink
Density,"Edition,
pg.15.
6. Robert
Chung,
Richard
Adams,
andTom
Petronio,
"Anatomy
of aWeb
Press
Run,"Graphic Arts Monthly.
March
1990,
pp.1-2.
7.
Ibid.
8.
Ibid.
9. T
&
E News.
"Anatomy
of aWeb
Press
Run,"Technical
andEducation
Center,
Rochester
Institute
ofTechnology, Rochester, N.Y.,
Special
Edition,
Vol.
17.
No. 7
(1989),
pg.9.
10.
Robert
Chung,
Richard
Adams,
andTom
Petronio,
"Anatomy
of aWeb
Press
Run,"1 1
.Larry
Wilson,
John
Compton,
"The
QPC
program andthe
practicalapplication of
Statistical Process
Control,"
TAGA Proceedings
,1988(Rochester,
N.Y.,
Technical Association for the Graphic
Arts),
pg.148.
12.
Ibid,
pg 149.
13.
Miles
andDonna
Southworth.
Quality
andProductivity
In
The
Graphic
Arts.
Graphic Arts
Publishing
Co.,
1989,
pp.14-2, 14-3, 14-13,
and14-14.
14.
Larry
Wilson,
John
Compton,
"The
QPC
program andthe
practicalapplication of
Statistical Process
Control,"
TAGA Proceedings
,1988(Rochester,
N.Y.,
Technical Association for the
Graphic
Arts),
pg.149.
15.
Ibid,
pg.156.
Chapter 4
HYPOTHESIS
Throughout
the
previouschapters,
abasic
assumptionhas
been
that
there
is
a needto
monitorthe
variables ofthe printing
process.Although the
variables
that
exist aremany,
there
aretwo that
have
provento be the
mostsignificant
for
color control.These
two
variables aredot
gain and solidink
density.
The
placement ofthe
controlbars
onthe
press sheet canhave different
applications
for
different
printers.For
this
study,
the
"most
appropriate" position
will entail
the
control of a variable processthrough
the
minimization ofthose
variables.
Hypotheses
1.0
-There
is
no significantdifference,
within an alphalevel
of .05,in the
position of a color control
bar
whendetermining
variability in
solidink
density
atthe
lead,
middle,
ortrail
edges of a printed sheet.1.1-
This
hypothesis
willbe
tested for
the
cyan control patch.1
.2-
This
hypothesis
willbe
tested for the black
control patch.1.3-
This hypothesis
willbe
tested for the
magenta control patch.1
.4-
This hypothesis
willbe tested for the
yellowcontrol patch.
1.5
-This
hypothesis
willbe
tested
when controlled atthe
lead,
middleand
trail
edges ofthe
printed sheet.2.0
-There
is
no significantdifference,
within analphalevel
of.05,
in the
position of a color control
bar
whendetermining
variability in
dot
gain atthe
lead,
middle,
ortrail
edges of a printed sheet.2.1
-This
hypothesis
willbe
tested for the
cyan control patch.2.2
-This
hypothesis
willbe
tested for
the black
control patch.2.3
-This
hypothesis
willbe
tested for the
magenta control patch.2.4
-This
hypothesis
willbe
tested for the
yellowcontrol patch.2.5
-This
hypothesis
willbe
tested
whencontrolled atthe
lead,
middleChapter 5
METHODOLOGY
This study has
relied ontwo
recent studies of pressvariability
control and statistical process control(SPC).
The first
wasdescribed in
a report given atRochester Institute
ofTechnology
in 1988
by
the
Graphic
Communications
Association's Print Properties
Committee,
gathered withthe interest
of"improved
communication of color andbetter
coordinationamong the many
segmentsinvolved
in printing
andpublishing
production."
[1]
One
oftheir
mostinteresting
conclusions,
explainedin the "Review
ofLiterature,"
was
that
"variation found
in
solidink
density
anddot
gain wassignificantly
smallerin
a press runduring
whichthe
operators were not allowedto
alterthe
press."
[2]
In
short,
too
much operatorinterference
wasdetrimental to the
naturalvariability
ofthe
pressitself.
The
secondstudy
was presented atRIT's
Conference
onQuality
and
Productivity
in the
Graphic Arts
in the Summer
of1989.
Since
the
aim ofthis study
wasto
find the
most appropriatelocation to
measure
variability in
solidink
density
anddot
gainthrough
the
use of color controlbars,
three
common page positions were used.The
Graphic Arts
Technical Foundation's SWOP/GATF
(133
line)
colorcontrolbars
were placed atthe
lead,
middle, andtrail
edges ofthe
productto
be
printed.This
controlbar
was chosen
because it has
anarray
of screenedareas;
thus
it
allowsthe
greatest amount of
information
ontotal
dot
gain changes.Typical
density
patches were also available
for
each process color(including
black). An
example ofthis
SWOP/GATF
color controlbar is
shownin Figure 1
.Ft*
Figure 1
~SWOP/GATF
Color
Control
Bar
Because
ofthe design
ofthis
project, and ofthe
proposedtypical
pressreceptor.
These
process colorimages
serveonly the
purpose ofproviding
a"real"
environment and
their
variability
will notbe
assessed.One
ofthe
pressruns
that
is done
regularly
onRIT's
web pressis
called"ImageWorld,"
an
informative
newslettertype
ofpublicationthat
is
sentto high
schools acrossthe
country.
Because
ofits
frequency
of run andits
familiarity
to the
presscrew,
images
that
werepreviously
printed were re-plated and positioned so as notto
interfere
withthe
controlbars. The
separationsdone for ImageWorld
were150
line
screen.A
mix of133 line
controlbars
and150 line images
would notbe
done
in
a realprinting
environment.However,
sincethe hue
ofthe
image
wasnot measured or
visually determined
asbeing
variable or notvariable,line
screening
was not of particularimportance.
Images
that
overlappedthe
controlbars
were masked outonly in those
areasthat
interfered
withthe
positionedcontrol
bars. An
example ofthe
layout
used,
including
the
position ofthe
SWOP/GATF
controlbars,
is
shownin
Figure 2.
=
Cut Line
WEB DIRECTION->
< ?J o O CJ o o t-i___
oo
CJ O<
& S2 INsa
Figure
2
Form
Layout
Layout
ofForm Used in
Test
Another decision that
wasimplemented
wasto
print ononly
one side ofthe
coated paper.Printing
onboth
sidesmay have
resultedin
incorrect
density
porosity
andopacity differences may have
causedthis
problem.By
printing only
oneside,
this
problem was eliminated.For
each controlbar
position(lead,
middle,
trail),
the
press wasbrought
up to
previously determined
specificdensities,
(Y
1.0,
M
1.35,
C
1.20,
K
1.60)
and registered.
Once
registration anddensity
specifications wereattained,
the
press operators were allowedto
makechanges,
whilemaintaining densities
within .05.Press
speedwas set at1200
ft/min.,
atypical
speed used whenrunning
ImageWorld.
Peter
Brehm
ofGCA
points outthat
"sampling
sizeis
critical;
it
mustbe
large
enoughto distinguish between
variationthat
is
inherent in the
process and special cause variation ~random,
erratic variationintroduced
into
an otherwisestatistically
stableprocess."
[3]
Chuck Layne
ofGraphic
Arts
Training
cautions
that the information
attainedfrom these
samplesmustbe
"representative
ofthe
typical
running time
of a normal press run,including
representativesampling
ofthe
actualquantity
being
printed."
[4]
Samples
were pulledfor
each controlbar
positiontreated
as a separatejob,
10
sheets at atime,
onceevery
30
secondsfor 15
minutes,
totaling
300
sampled sheets.The
press ran at1200
ft/min.,
or37,705
impressions
perhour.
Sampling
every
30
seconds
for 15
minutes gave a representativesampling
of9,426
impressions.
Each
30
secondsampling
represented314
impressions
ofthat
representative9,426
impressions.
It is important here
to
mentionthe
ratio ofplateto blanket
onpress,
asit
influenced the sampling
approach.Since
the
ratio of plateto
blanket is
2:1,
meaning two
plate cylinder revolutions per oneblanket
cylinderrevolution,
the
blanket
cylinderfor the black
printer wasslightly
scoredto
ensurethat the
samples were pulled
from the
same side ofthe blanket.
Five
signatures ofthe
ten that
possessedthe
scored mark were used.The
otherfive
samples werediscarded.
Out
ofthese
remaining
five
samples,
the
averagedensities
weredetermined.
The
average ofthe
five
samples was used asthe
single samplefor
that
particular sampling.This
wasdone for the
lead,
middle andtrail
edge samples respectively,providing
atotal
of90
samples.Once
90
representative samples were collected,the
analysis ofthe
data
began.
If these
samples were not representative,meaning
the total
process andstatistical analysis
that
supportsthis
sampling
size statesthat "The
minimumsampling
size ...is 30. It
requires atleast
this
number of observationsbefore
the
pattern"stabilizes"
and can
be interpreted
withconfidence."
[6]
Then,
"as
the
sample size approaches
100,
the
pattern ofvariability
shownby
the data closely
approximates
the
pattern ofthe
entirepopulation."
[7]
In
short,
as oneapproaches
100,
the
description
ofthe
processesvariability
willaccurately
reflect
that
ofthe
total.
The
measurementofthe data
wasdone
by
Cosar's
AutoSmart
Scanning
Densitometer. This densitometer is
a reflectiondensitometer that
is
capable ofreading
up to
200
measurement points per minute.The
component parts ofthis
densitometer
include
a systemcomputer,
a printer and optionalplotter,
aPC
based
computer,
atrack
ball for
manualpositioning,
aviewing booth
equippedwith standard
viewing
conditions,
as well asthe
actual probehead
ofthe
densitometer. The
probehead
containsthe densitometer consisting
offour
filters,
plus atargeting
lamp
for the
reference ofspotplacement.While
notin
use,
the
probehead
retreatsback to its
"Home"
position.
A
ceramic calibrationplaque
is
positioned underneaththe head's
home
position.This
plaqueis
usedto verify the
densitometer's
calibrationbefore every
measurement cycle.This
densitometer
is
calibratedfor
industry-standard,
Status-T
response.While in
operation,
this densitometer
gaveinformation regarding
solidink
density
anddot
gain.With this
information,
finding
the variability in the
solidink
density
anddot
gain,
according to the
control ofthe
lead,
middle andtrail
edge controlbars,
was attempted.
For
each controlbar
on eachsheet,
the variability in
density
anddot
gainwas
determined
across one controlbar for the
lead,
middle andtrail
edges.It
will
be
important to
considerthe likeness
anddifference
ofthe
separately
controlled control
bars
between the
otherremaining
29
samples.This is
wherethe determination
is
made ofwhetheror notthere
is
a"most
appropriate"
position
for
color controlbars
regarding
the
measure ofvariability
in
solidink
density
anddot
gain of a printed product.The
comparison ofthis
acquiredinformation
about each positionhas
supported and/or rejectedthe
hypotheses
stated earlier.
The
data
analysis and conclusions canbe found in Chapters Six
Statistical
analysis was usedto determine the
range, average,accuracy
and
the
precision ofthese
data.
Accuracy
consists ofthe
average ofthe
data
minusthe
aim.This
aimis generally
specifiedfor
adesired
outcome.The
definition
of rangeis the
spread ofinformation,
orthe highest
reading
minusthe
lowest
reading.Precision is defined
asthe
upperspecificationlimit
minusthe
lower
specificationlimit
divided
by
the
upper controllimit
minusthe
lower
control
limit.
Any
precisiondata that
equals or exceeds1.33 is
consideredto
be
precise.
A
desired
aim was setandconformedto,
thus accuracy
and precisionwere
determined.
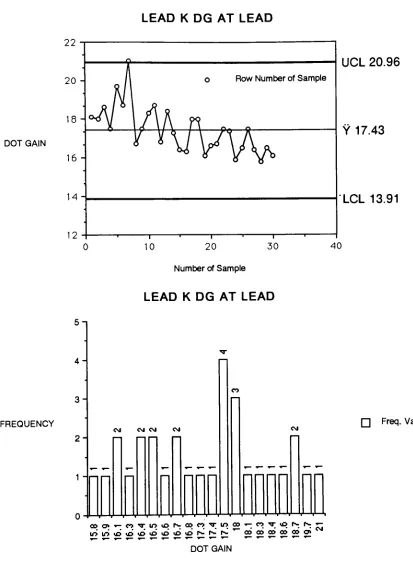
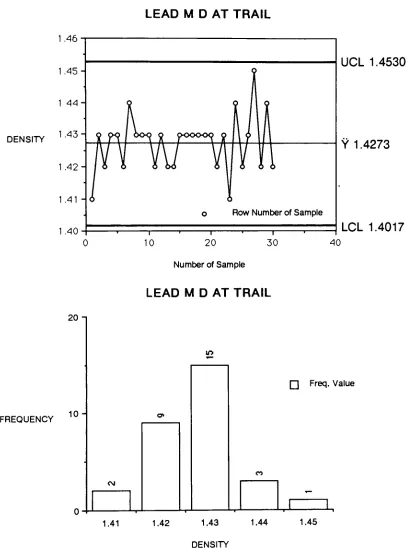
Histograms
were usedto
describe the
distribution
ofthe data
received
from
the
oress sheet.Also
used was a control chartwhichshowsthe
stability
ofthe
process,
the
average,
upper andlower
controllimits,
aswell asthe fluctuation
ofthe data. In
addition,
aone-way
analysis of variance was usedto
determine any differences
in
data
andtheir
significance.A
sample ofthe
approach used
to
determine
aone-way
analysis of varianceis
givenin
Appendix
D.
Conditions
andlimitations may influence the
outcome ofthe
printedproduct.
It is important to have
abasic
understanding
ofthose
conditions aswellas
their
limitations.
The
following
information
describes the
printing
conditionsof
this
study, aswell as asummary
ofthe limitations.
Printing
Conditions
Press:
*
Harris
M1000B,
four
unit,four
color,
Web
Offset
Press
Blanket-to-blanket
press*
Reeves
2000 Plus
3Ply
Compressible
Blankets,
allfour
units *3M
Viking
GM
Plates,
allfour
units*
Packing
Blanket packing
-.005, all
four
unitsPlate packing
-.001, all
four
units*
Weyerhauser
Old
Coventry
Coated
Paper
Basis
weight,25/38, 500,
45#.
Width
35".
*
*
Lincoln
auto-inkfeed
system*
Auto ink
levelers
*
Ink
agitators*
Water
cooledink
oscillators*
Rosos
KSP #500 AS
M-4
Fountain
solution6 1/2
oz. per gallon of waterAcidic base
solution2450
conductivity
Dutrose
Dampening
*Auto F.S. mixing
*F.S.
cooling
system*
Registration
system-Automatic,
Quad.
Web
compensatorsRibbon
compensators *Control
consoleRegistration
Color
Fountain
solution *Press
speed1200 ft/min.
*
Drying
system-2
Zone Tec
Hot Air Dryer
Web
exittemperature
-260 degrees F.
* "0" speed splicer *Festoon
Measurement:
*Cosar scanning densitometer
Status
"T"Limitations
The
limitations that
existin this
study lie
in the
assessment ofthe
variability
in the
position ofthe
controlbars
withoutthe
determination
ofthe
acceptance,
or eventhe knowledge
of,
the
variation of animage
that may be
control
bars
alone.The
images
andthe relationship
ofthe images to the
controlof
the
color controlbars
are notdetermined,
oreven attempted.Things
such ashue
will notbe
attributes ofthe
copy
that
willhave
the
opportunity
to
be
givencharacteristics.
The
press runitself
(sampling
andset-up)
took two
hours;
in that
time
a representative press run was attained.Only
one side ofthe
web wasprinted.
Since
three
press runs,consisting
of15
minuteseach,
running
at1200
ft./min.
used atremendous
amount ofpaper,
the
press runhad to be limited to
the
availability
ofpaper,
while stillallowing
atotal
of90
samplesto
be
pulled.The
paper used was a45
pound,
coated stock.All
materials and conditionsEndnotes for Chapter 5
1.
Larry
Wilson,
John
Compton,
"The
QPC Program
andthe Practical
Application
ofStatistical Process
Control,"
TAGA
Proceedings. 1988
(Rochester,
N.Y.,
Technical
Association
for the
Graphic
Arts),
pg.148.
2.
Ibid,
pg.159.
3.
Peter
Brehm,
"Sampling
andMeasurement for
anSPC
Application,"
Graphic
Communication
Association, 1989,
pg.1.
4.
Chuck
Layne,
"Statistical
Process
Control,"Lecture
onSPC,
Rochester
Institute
ofTechnology, March,
1990.
5.
GCA,
"QPC: An
Introduction
to QPC:
GCA's
Quality
Process
Commitment
Program,"
Graphic Communications
Association,
1989.
6.
Ibid,
pg.D1.
Chapter 6
RESULTS
The
analysis ofthe resulting
data
can oefound
in
Tables
1
-80.0
ofAppendix
E.
Throughout
each ofthese
tables,
the
range ofdata
asit
was gatheredfor
eachtreatment
ofthe three
controlbars is listed. The
information
obtained represents an example of
three
separate press runsconsisting
of apreviously
specifieddensity
standardthat
wasimplemented
in
each case.If
each ofthe
press run'sdata
werecomparedto
one anotherin the
analysis ofdata,
one coulddevelop
a processcapability
study.But
asthe
resultsshow,
process
capability
explanationswere not attempted.Specific
control ofthe
controlbars
atthe
lead,
middle andtrail
edges representthree
separate pressruns,
but
in
actualtesting,
were completed consecutively.For
eachtreatment,
density
anddot
gainfor
cyan,
black,
magenta,
and yellow are presented.The
approach whendeveloping
the
analysis ofdata
wasto
determine,
through
statisticaltools,